Reports

- Global Locations -

Headquarters

Future Market Insights, Inc.

Christiana Corporate, 200
Continental Drive, Suite 401,
Newark, Delaware - 19713,
United States

T: +1-845-579-5705

Americas

Future Market Insights, Inc.

616 Corporate Way, Suite 2-9018,
Valley Cottage, NY 10989, United States

T: +1-347-918-3531

MEA

Future Market Insights

1602-6 Jumeirah Bay X2 Tower, Plot No: JLT-PH2-X2A,
Jumeirah Lakes Towers, Dubai,
United Arab Emirates

Europe

Future Market Insights

3rd Floor, 207 Regent Street,
W1B 3HH London
United Kingdom

T: + 44 (0) 20 8123 9659
D: +44 (0) 20 3287 4268

Asia Pacific

Future Market Insights

IndiaLand Global Tech Park, Unit UG-1, Behind Grand HighStreet, Phase 1, Hinjawadi, MH, Pune – 411057, India

Citrus Fiber Market Outlook for 2024 to 2034

The citrus fiber market is predicted to be valued at US$ 172.7 million in 2024 and is expected to reach US$ 248.6 million by 2034, marking a CAGR of 3.7%. The upsurge in product acceptance and usage is the factor accountable for the market growth during the forecast period.

Attributes Details
Market Value for 2024 US$ 172.7 million
Projected Market Value for 2034 US$ 248.6 million
Value-based CAGR of Market for 2024 to 2034 3.7%

Don't pay for what you don't need

Customize your report by selecting specific countries or regions and save 30%!

Citrus Fiber Demand Analysis

  • Numerous manufacturers have participated in this market to cater to the product's growing popularity in the food industry due to its penetrating flavoring qualities, the odor it emits, and its nutritional benefits.
  • Citric fibers also aid in refining heart health, addressing irritable bowel syndrome, managing weight, boosting immunity, and controlling blood sugar levels. All of these benefits are anticipated to increase the use of citric fibers, driving the market forward.
  • Growing applications in bakery, food preservation, and dairy going to be be the main driver for its market growth, along with the increasing demand for gluten-free food products. Utilizing citric fiber in place of artificial ingredients and fats in production going to be further contribute to its market expansion.
  • The inclination towards clean labels and the demand for natural food products are increasing, leading to the addition of citrus fiber in several product ranges across multiple industries. Additionally, the rising popularity of citric fiber in industries is fueling market growth.
  • Government regulations on citric fiber going to be benefit its market growth, as new cost-effective procedures are introduced for the design of citrus fiber-added food products.

Comparative View of Adjacent Markets

Apart from the citrus fiber market, an in-depth analysis has been done on two other related markets: the citrus powder market and the citrus oil market.

Leading players in the citrus powder market are anticipated to create close alliances with farmers or bolster their in-house origination of oranges to further boost the profitability of production. In addition, the increasing adoption of oranges in citrus powder used for manufacturing citrus oils is also fostering this trend.

The expansion of the citrus oil market is predicted to be aided by the rising demand for plant extracts and natural food in food and beverage products, to be applied as flavoring and other additives.

Citrus Fiber Market:

Attributes Citrus Fiber Market
Value-based CAGR (2024 to 2034) 3.7%
Projected Market Value (2034) US$ 248.6 million
Market Trends Popularity of citrus fiber as a natural alternative to synthetic food additives and stabilizers
Growth Factors Consumer demand for natural and clean label ingredients in food and beverages

Citrus Powder Market:

Attributes Citrus Powder Market
Value-based CAGR (2024 to 2034) 8.06%
Projected Market Value (2034) US$ 6.7 billion
Market Trends Development of customized blends to meet specific flavor profiles and functional requirements
Growth Factors Regulatory approvals and certifications supporting the use of citrus powder in various food applications

Citrus Oil Market:

Attributes Citrus Oil Market
Value-based CAGR (2024 to 2034) 4.0%
Projected Market Value (2034) US$ 6.08 billion
Market Trends Expansion of citrus oil applications in cleaning and household products as natural alternatives
Growth Factors Preference for natural oils in cosmetics, aromatherapy, and food industries
Nandini Roy Choudhury

Principal Consultant

Talk to Analyst

Find your sweet spots for generating winning opportunities in this market.

Category-wise Outlook

The powder is the top form of citrus fiber. The preferable product type as per the consumer demand is natural citrus fiber.

Citrus Fiber Powder Takes Centre Stage because of Convenience

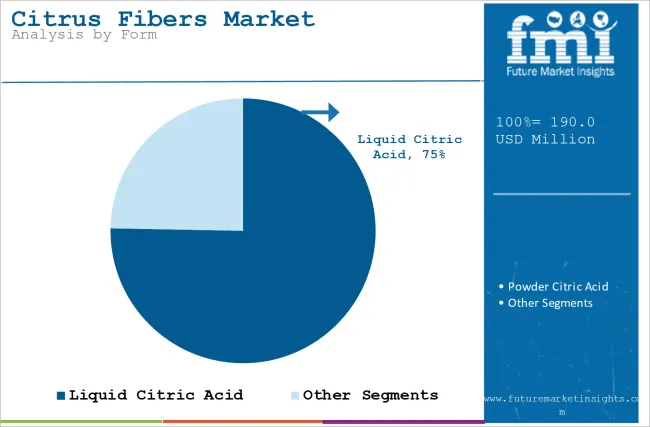
The powdered citrus fiber is expected to capture an 87.7% CAGR of the market share in 2024. Here are some factors influencing the growth of the market:

  • Powdered citrus fiber has a longer shelf life than liquid forms. This makes it easier for people to store and transport without worrying about spoiling.
  • When using powdered citric fibers, handling it is easy and convenient. People can measure, mix, and add it to recipes without calling for special tools or skills.
Attributes Details
By Form Powder
Market Share (2024) 87.7%

Natural Citrus Fiber’s Sustainable Surge in Clean-label Products

The natural citrus fiber segment is anticipated to account for 91.7% of the market share in 2024. Some of the reasons for the progress of natural citric fibers adoption are:

  • Increasing popularity of natural citric fibers due to consumer demand for clean-label products. Consumers are seeking natural and plant-based ingredients in various sectors such as food, medicine, and cosmetics.
  • Manufacturers prioritize sustainable ingredients, and natural citrus fiber aligns with environmentally friendly practices. With consumer demand growing for transparency and natural alternatives, citric fiber emerges as a versatile option.
Attributes Details
Product Type Natural
Market Share (2024) 91.7%

Country-wise Analysis

North America is developing new product lines due to the growing demand for fortified food and beverages in the region, encompassing the United States, Canada, and Mexico. The market is expanding because of changing consumer eating patterns and a focus on a healthier lifestyle. The demand for citrus fiber in North America has driven the expansion of the citrus fiber market.

Industrialists are frequently investing in research and development programs to innovate a wide variety of health and nutritional supplements. The launch of new products has increased the demand for citric fiber in developing regions such as Asia Pacific and the Middle East.

Countries CAGR (2024 to 2034)
United State 2.3%
Germany 2.3%
China 4.3%
Japan 5.1%
India 5.1%

Citric fibers Revolutionize Eco- friendly Product Innovation in the United States

North America is a key player in the global citrus fiber market, with the United States projected to grow at a CAGR of 2.3% through 2034.

  • The consumer demand for natural functional ingredients across various applications, along with several health benefits and nutrient content like citrus fiber, continues to rise.
  • Manufacturers are developing new products using citric fiber to stabilize emulsification and deliver appealing textures to products. The focus on making the product eco-friendly is increasing market growth.

Citrus Fiber’s Health Benefits Appeal China’s Health-conscious Consumers

The citrus fiber market is expected to progress at a CAGR of 4.3% in China through 2034.

  • As consumers in China become more health-conscious, they actively seek out products that are rich in fiber. Citrus fiber offers multiple functional properties and health benefits that are attractive to food and beverage manufacturers.
  • Manufacturers use it to improve the sensory experience of their products, making them more appealing to consumers. This is anticipated to expand market growth.

Citrus Fiber’s Role as a Versatile Fat Substitute in Germany’s Market

The market is expected to progress at a CAGR of 2.3% in Germany throughout the forecast period.

  • The growing demand for fat substitutes in Germany plays a pivotal role in determining the citrus fiber market. Citrus fiber, derived from partially depeptidized citrus peel, can replace up to 50% of oil or fat in bakery products without compromising quality.
  • The demand for fat substitutes, with the multifaceted advantages of citric fiber such as functional benefits, health impact, metabolic benefits, and a sustainable manufacturing process, contributes to its growth in Germany's market.

Citrus Fiber Additives Cater to Japan’s Aging Health-conscious Consumers

The citrus fiber market is estimated to progress at a CAGR of 5.1% in Japan during the forecast period.

  • Citrus fiber is a neutral-tasting food additive that increases the shelf life of products due to technological advancements. There are several ongoing research studies on this application, developing it to become more convenient for manufacturers.
  • The increasing aging population in Japan makes people more conscious about their health, which is surging the growth of the citrus market trend.

Adoption of Sustainable Solution is Driving India’s Clean Label Movement

India is also anticipated to observe a profitable growth at a CAGR of 5.1% during the forecast period of 2024 to 2034.

  • The clean label movement in India is an influential force, propelling citric fiber into focus. Indian consumers seek transparency and simplicity in food products; the clean label resonates with the desire for natural ingredients that align with health and well-being.
  • Industrialists are turning to citric fiber to replace synthetic additives and emulsifiers. It serves as a preservative-free alternative. The manufacturing of citric fiber from a by-product of juice extraction reinforces its eco-friendly image.

Get the data you need at a Fraction of the cost

Personalize your report by choosing insights you need
and save 40%!

Competitive Landscape

Citrus fiber is gaining popularity in culinary applications due to its functional potential. Market players are taking advantage of this and trying to improve their offerings to further penetrate the market. As regulatory agencies recognize its safety and benefits, manufacturers are innovating new products with citric fiber, ensuring food safety standards and promoting market growth through regulatory backing and approval.

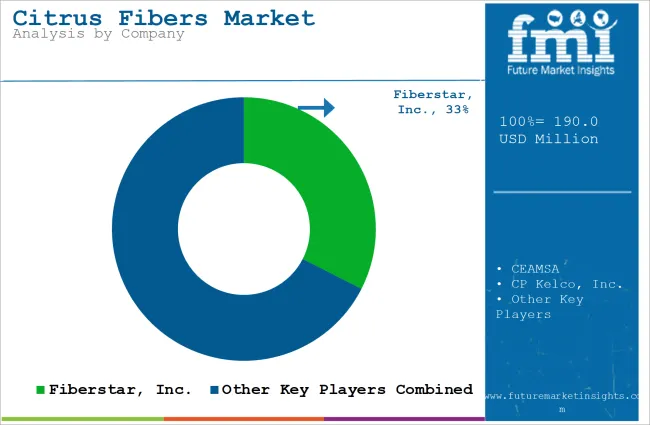
Fiberstar, Inc. has launched the new organic citric fiber in response to the increasing demand for natural, sustainable, and organic food ingredients, fueling an uptick in demand and supporting growth in consumer health and wellness initiatives.

CP Kelco, a global leader in nature-based ingredient solutions, announces that its NUTRAVA citrus fiber is certified as an upcycled ingredient by the Upcycled Food Association.

Recent Developments

  • January 2023, Fiberstar, Inc. launched the new organic citrus fiber to encounter the growing popularity of natural, sustainable food ingredients, which is driven by consumer health initiatives and increased sustainability visibility.
  • June 2022, Givanudan and Manus Bio, a producer of natural products, uncovered BioNootkatone, an ingredient pegged to make a wave in the citrus flavor space. Rendering the industries, BioNootkatone replies to the market demand for environmentally sustainable, natural, clean-label flavors.
  • December 2022, Orange Fiber, a startup, launched a new fabric variety using citrus fiber and pulp, in partnership with H&M and Marinella brands.

Key Companies

  • Fiberstar, Inc.
  • CEAMSA
  • CP Kelco, Inc.
  • Herbafoods Ingredients GmbH
  • Florida Food Products, Inc.
  • Lemont
  • Golden Health
  • FUYAN PHARM (Henan), Inc.
  • Nans Products
  • Cifal Herbal Private Ltd.

Key Coverage in the Citrus Fiber Market Report

  • Citrus-based Products Industry
  • Competitive Landscape in the Citrus Fiber Market
  • Market Share of Citrus Fiber Brands
  • Emerging Opportunities in the Citrus Fiber Industry
  • Future Outlook for Citrus Fiber

Market Segmentation of Citrus Fiber Market

By Application:

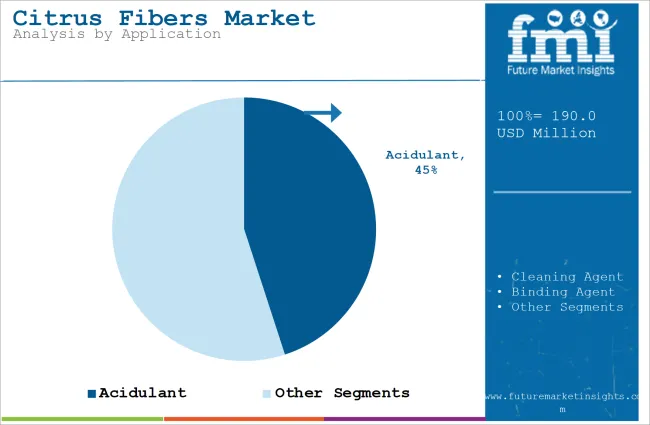
  • Acidulant
  • Cleaning Agent
  • Binding Agent
  • Preservative
  • Others

By Form:

  • Liquid Citric Acid
  • Powder Citric Acid
    • Anhydrous
    • Monohydrous

By Product Type:

  • Natural
  • Artificial

By End Use:

  • Citric Acid for Food & Beverages
    • Bakery & Confectionary
    • Dairy
    • Convenience Food
    • Beverages
    • Jams & Preserves
    • Others
  • Citric Acid for Pharmaceuticals
  • Citric Acid for Animal Feed
  • Citric Acid for Personal Care
  • Citric Acid for Metal Finishing & Cleaning
  • Others

By Region:

  • North America
  • Latin America
  • Europe
  • Asia Pacific (APAC)
  • Middle East & Africa (MEA)

Frequently Asked Questions

How large is the Citrus Fiber Market?

The market size is estimated to be US$ 172.7 million in 2024.

At What Rate is the Citrus Fiber Market Expected to Grow?

The market is expected to increase at a CAGR of 3.7% over the forecast period.

What is the Scope of Citric Acid in China?

The market is expected to register a CAGR of 4.3% in China from 2024 to 2034.

What is the Forecast of the Citrus Fiber Market?

The Market is forecasted to have reached a size of US$ 248.6 million by 2034.

Who are the Key Companies in the Citrus Fiber Market?

Fiberstar, Inc., CEAMSA, CP Kelco, Inc., Herbafoods Ingredients GmbH, Florida Food Products, Inc., Lemont, Golden Health, FUYAN PHARM (Henan), Inc., Nans Products, Cifal Herbal Private Ltd.

What is the Scope of Citric Acid in India?

The market is expected to register a CAGR of 5.1% in India from 2024 to 2034.

Table of Content

1. Executive Summary

    1.1. Global Market Outlook

    1.2. Demand-side Trends

    1.3. Supply-side Trends

    1.4. Technology Roadmap Analysis

    1.5. Analysis and Recommendations

2. Market Overview

    2.1. Market Coverage / Taxonomy

    2.2. Market Definition / Scope / Limitations

3. Market Background

    3.1. Market Dynamics

        3.1.1. Drivers

        3.1.2. Restraints

        3.1.3. Opportunity

        3.1.4. Trends

    3.2. Scenario Forecast

        3.2.1. Demand in Optimistic Scenario

        3.2.2. Demand in Likely Scenario

        3.2.3. Demand in Conservative Scenario

    3.3. Opportunity Map Analysis

    3.4. Product Life Cycle Analysis

    3.5. Supply Chain Analysis

        3.5.1. Supply Side Participants and their Roles

            3.5.1.1. Producers

            3.5.1.2. Mid-Level Participants

        3.5.2. Value Added and Value Created at Node in the Supply Chain

        3.5.3. List of Raw Material Suppliers

        3.5.4. List of Existing and Potential Buyer’s

    3.6. Investment Feasibility Matrix

    3.7. Value Chain Analysis

        3.7.1. Profit Margin Analysis

    3.8. PESTLE and Porter’s Analysis

    3.9. Regulatory Landscape

        3.9.1. By Key Regions

        3.9.2. By Key Countries

    3.10. Regional Parent Market Outlook

    3.11. Production and Consumption Statistics

    3.12. Import and Export Statistics

4. Global Market Analysis 2019 to 2023 and Forecast, 2024 to 2034

    4.1. Historical Market Size Value (US$ Million) & Volume (Tons) Analysis, 2019 to 2023

    4.2. Current and Future Market Size Value (US$ Million) & Volume (Tons) Projections, 2024 to 2034

        4.2.1. Y-o-Y Growth Trend Analysis

        4.2.2. Absolute $ Opportunity Analysis

5. Global Market Analysis 2019 to 2023 and Forecast 2024 to 2034, By Grade

    5.1. Introduction / Key Findings

    5.2. Historical Market Size Value (US$ Million) & Volume (Tons) Analysis By Grade, 2019 to 2023

    5.3. Current and Future Market Size Value (US$ Million) & Volume (Tons) Analysis and Forecast By Grade, 2024 to 2034

        5.3.1. Food Grade

        5.3.2. Pharmaceutical Grade

        5.3.3. Cosmetic Grade

    5.4. Y-o-Y Growth Trend Analysis By Grade, 2019 to 2023

    5.5. Absolute $ Opportunity Analysis By Grade, 2024 to 2034

6. Global Market Analysis 2019 to 2023 and Forecast 2024 to 2034, By Source

    6.1. Introduction / Key Findings

    6.2. Historical Market Size Value (US$ Million) & Volume (Tons) Analysis By Source, 2019 to 2023

    6.3. Current and Future Market Size Value (US$ Million) & Volume (Tons) Analysis and Forecast By Source, 2024 to 2034

        6.3.1. Orange

        6.3.2. Tangerine/Mandarins

        6.3.3. Grapefruit

        6.3.4. Lemons and Lime

    6.4. Y-o-Y Growth Trend Analysis By Source, 2019 to 2023

    6.5. Absolute $ Opportunity Analysis By Source, 2024 to 2034

7. Global Market Analysis 2019 to 2023 and Forecast 2024 to 2034, By Application

    7.1. Introduction / Key Findings

    7.2. Historical Market Size Value (US$ Million) & Volume (Tons) Analysis By Application, 2019 to 2023

    7.3. Current and Future Market Size Value (US$ Million) & Volume (Tons) Analysis and Forecast By Application, 2024 to 2034

        7.3.1. Bakery

        7.3.2. Desserts and Ice-cream

        7.3.3. Sauces & Seasonings

        7.3.4. Meat & Egg Replacement

        7.3.5. Beverages

        7.3.6. Flavourings & Coatings

        7.3.7. Snacks & Meals

        7.3.8. Personal Care

        7.3.9. Pharmaceutical

        7.3.10. Other Application

    7.4. Y-o-Y Growth Trend Analysis By Application, 2019 to 2023

    7.5. Absolute $ Opportunity Analysis By Application, 2024 to 2034

8. Global Market Analysis 2019 to 2023 and Forecast 2024 to 2034, By Function

    8.1. Introduction / Key Findings

    8.2. Historical Market Size Value (US$ Million) & Volume (Tons) Analysis By Function, 2019 to 2023

    8.3. Current and Future Market Size Value (US$ Million) & Volume (Tons) Analysis and Forecast By Function, 2024 to 2034

        8.3.1. Water Binder & Fat Replacer

        8.3.2. Thickening Gums

        8.3.3. Gelling Gums

        8.3.4. Others

    8.4. Y-o-Y Growth Trend Analysis By Function, 2019 to 2023

    8.5. Absolute $ Opportunity Analysis By Function, 2024 to 2034

9. Global Market Analysis 2019 to 2023 and Forecast 2024 to 2034, By Region

    9.1. Introduction

    9.2. Historical Market Size Value (US$ Million) & Volume (Tons) Analysis By Region, 2019 to 2023

    9.3. Current Market Size Value (US$ Million) & Volume (Tons) Analysis and Forecast By Region, 2024 to 2034

        9.3.1. North America

        9.3.2. Latin America

        9.3.3. Western Europe

        9.3.4. Eastern Europe

        9.3.5. South Asia and Pacific

        9.3.6. East Asia

        9.3.7. Middle East and Africa

    9.4. Market Attractiveness Analysis By Region

10. North America Market Analysis 2019 to 2023 and Forecast 2024 to 2034, By Country

    10.1. Historical Market Size Value (US$ Million) & Volume (Tons) Trend Analysis By Market Taxonomy, 2019 to 2023

    10.2. Market Size Value (US$ Million) & Volume (Tons) Forecast By Market Taxonomy, 2024 to 2034

        10.2.1. By Country

            10.2.1.1. USA

            10.2.1.2. Canada

        10.2.2. By Grade

        10.2.3. By Source

        10.2.4. By Application

        10.2.5. By Function

    10.3. Market Attractiveness Analysis

        10.3.1. By Country

        10.3.2. By Grade

        10.3.3. By Source

        10.3.4. By Application

        10.3.5. By Function

    10.4. Key Takeaways

11. Latin America Market Analysis 2019 to 2023 and Forecast 2024 to 2034, By Country

    11.1. Historical Market Size Value (US$ Million) & Volume (Tons) Trend Analysis By Market Taxonomy, 2019 to 2023

    11.2. Market Size Value (US$ Million) & Volume (Tons) Forecast By Market Taxonomy, 2024 to 2034

        11.2.1. By Country

            11.2.1.1. Brazil

            11.2.1.2. Mexico

            11.2.1.3. Rest of Latin America

        11.2.2. By Grade

        11.2.3. By Source

        11.2.4. By Application

        11.2.5. By Function

    11.3. Market Attractiveness Analysis

        11.3.1. By Country

        11.3.2. By Grade

        11.3.3. By Source

        11.3.4. By Application

        11.3.5. By Function

    11.4. Key Takeaways

12. Western Europe Market Analysis 2019 to 2023 and Forecast 2024 to 2034, By Country

    12.1. Historical Market Size Value (US$ Million) & Volume (Tons) Trend Analysis By Market Taxonomy, 2019 to 2023

    12.2. Market Size Value (US$ Million) & Volume (Tons) Forecast By Market Taxonomy, 2024 to 2034

        12.2.1. By Country

            12.2.1.1. Germany

            12.2.1.2. UK

            12.2.1.3. France

            12.2.1.4. Spain

            12.2.1.5. Italy

            12.2.1.6. Rest of Western Europe

        12.2.2. By Grade

        12.2.3. By Source

        12.2.4. By Application

        12.2.5. By Function

    12.3. Market Attractiveness Analysis

        12.3.1. By Country

        12.3.2. By Grade

        12.3.3. By Source

        12.3.4. By Application

        12.3.5. By Function

    12.4. Key Takeaways

13. Eastern Europe Market Analysis 2019 to 2023 and Forecast 2024 to 2034, By Country

    13.1. Historical Market Size Value (US$ Million) & Volume (Tons) Trend Analysis By Market Taxonomy, 2019 to 2023

    13.2. Market Size Value (US$ Million) & Volume (Tons) Forecast By Market Taxonomy, 2024 to 2034

        13.2.1. By Country

            13.2.1.1. Poland

            13.2.1.2. Russia

            13.2.1.3. Czech Republic

            13.2.1.4. Romania

            13.2.1.5. Rest of Eastern Europe

        13.2.2. By Grade

        13.2.3. By Source

        13.2.4. By Application

        13.2.5. By Function

    13.3. Market Attractiveness Analysis

        13.3.1. By Country

        13.3.2. By Grade

        13.3.3. By Source

        13.3.4. By Application

        13.3.5. By Function

    13.4. Key Takeaways

14. South Asia and Pacific Market Analysis 2019 to 2023 and Forecast 2024 to 2034, By Country

    14.1. Historical Market Size Value (US$ Million) & Volume (Tons) Trend Analysis By Market Taxonomy, 2019 to 2023

    14.2. Market Size Value (US$ Million) & Volume (Tons) Forecast By Market Taxonomy, 2024 to 2034

        14.2.1. By Country

            14.2.1.1. India

            14.2.1.2. Bangladesh

            14.2.1.3. Australia

            14.2.1.4. New Zealand

            14.2.1.5. Rest of South Asia and Pacific

        14.2.2. By Grade

        14.2.3. By Source

        14.2.4. By Application

        14.2.5. By Function

    14.3. Market Attractiveness Analysis

        14.3.1. By Country

        14.3.2. By Grade

        14.3.3. By Source

        14.3.4. By Application

        14.3.5. By Function

    14.4. Key Takeaways

15. East Asia Market Analysis 2019 to 2023 and Forecast 2024 to 2034, By Country

    15.1. Historical Market Size Value (US$ Million) & Volume (Tons) Trend Analysis By Market Taxonomy, 2019 to 2023

    15.2. Market Size Value (US$ Million) & Volume (Tons) Forecast By Market Taxonomy, 2024 to 2034

        15.2.1. By Country

            15.2.1.1. China

            15.2.1.2. Japan

            15.2.1.3. South Korea

        15.2.2. By Grade

        15.2.3. By Source

        15.2.4. By Application

        15.2.5. By Function

    15.3. Market Attractiveness Analysis

        15.3.1. By Country

        15.3.2. By Grade

        15.3.3. By Source

        15.3.4. By Application

        15.3.5. By Function

    15.4. Key Takeaways

16. Middle East and Africa Market Analysis 2019 to 2023 and Forecast 2024 to 2034, By Country

    16.1. Historical Market Size Value (US$ Million) & Volume (Tons) Trend Analysis By Market Taxonomy, 2019 to 2023

    16.2. Market Size Value (US$ Million) & Volume (Tons) Forecast By Market Taxonomy, 2024 to 2034

        16.2.1. By Country

            16.2.1.1. GCC Countries

            16.2.1.2. South Africa

            16.2.1.3. Israel

            16.2.1.4. Rest of MEA

        16.2.2. By Grade

        16.2.3. By Source

        16.2.4. By Application

        16.2.5. By Function

    16.3. Market Attractiveness Analysis

        16.3.1. By Country

        16.3.2. By Grade

        16.3.3. By Source

        16.3.4. By Application

        16.3.5. By Function

    16.4. Key Takeaways

17. Key Countries Market Analysis

    17.1. USA

        17.1.1. Pricing Analysis

        17.1.2. Market Share Analysis, 2023

            17.1.2.1. By Grade

            17.1.2.2. By Source

            17.1.2.3. By Application

            17.1.2.4. By Function

    17.2. Canada

        17.2.1. Pricing Analysis

        17.2.2. Market Share Analysis, 2023

            17.2.2.1. By Grade

            17.2.2.2. By Source

            17.2.2.3. By Application

            17.2.2.4. By Function

    17.3. Brazil

        17.3.1. Pricing Analysis

        17.3.2. Market Share Analysis, 2023

            17.3.2.1. By Grade

            17.3.2.2. By Source

            17.3.2.3. By Application

            17.3.2.4. By Function

    17.4. Mexico

        17.4.1. Pricing Analysis

        17.4.2. Market Share Analysis, 2023

            17.4.2.1. By Grade

            17.4.2.2. By Source

            17.4.2.3. By Application

            17.4.2.4. By Function

    17.5. Germany

        17.5.1. Pricing Analysis

        17.5.2. Market Share Analysis, 2023

            17.5.2.1. By Grade

            17.5.2.2. By Source

            17.5.2.3. By Application

            17.5.2.4. By Function

    17.6. UK

        17.6.1. Pricing Analysis

        17.6.2. Market Share Analysis, 2023

            17.6.2.1. By Grade

            17.6.2.2. By Source

            17.6.2.3. By Application

            17.6.2.4. By Function

    17.7. France

        17.7.1. Pricing Analysis

        17.7.2. Market Share Analysis, 2023

            17.7.2.1. By Grade

            17.7.2.2. By Source

            17.7.2.3. By Application

            17.7.2.4. By Function

    17.8. Spain

        17.8.1. Pricing Analysis

        17.8.2. Market Share Analysis, 2023

            17.8.2.1. By Grade

            17.8.2.2. By Source

            17.8.2.3. By Application

            17.8.2.4. By Function

    17.9. Italy

        17.9.1. Pricing Analysis

        17.9.2. Market Share Analysis, 2023

            17.9.2.1. By Grade

            17.9.2.2. By Source

            17.9.2.3. By Application

            17.9.2.4. By Function

    17.10. Poland

        17.10.1. Pricing Analysis

        17.10.2. Market Share Analysis, 2023

            17.10.2.1. By Grade

            17.10.2.2. By Source

            17.10.2.3. By Application

            17.10.2.4. By Function

    17.11. Russia

        17.11.1. Pricing Analysis

        17.11.2. Market Share Analysis, 2023

            17.11.2.1. By Grade

            17.11.2.2. By Source

            17.11.2.3. By Application

            17.11.2.4. By Function

    17.12. Czech Republic

        17.12.1. Pricing Analysis

        17.12.2. Market Share Analysis, 2023

            17.12.2.1. By Grade

            17.12.2.2. By Source

            17.12.2.3. By Application

            17.12.2.4. By Function

    17.13. Romania

        17.13.1. Pricing Analysis

        17.13.2. Market Share Analysis, 2023

            17.13.2.1. By Grade

            17.13.2.2. By Source

            17.13.2.3. By Application

            17.13.2.4. By Function

    17.14. India

        17.14.1. Pricing Analysis

        17.14.2. Market Share Analysis, 2023

            17.14.2.1. By Grade

            17.14.2.2. By Source

            17.14.2.3. By Application

            17.14.2.4. By Function

    17.15. Bangladesh

        17.15.1. Pricing Analysis

        17.15.2. Market Share Analysis, 2023

            17.15.2.1. By Grade

            17.15.2.2. By Source

            17.15.2.3. By Application

            17.15.2.4. By Function

    17.16. Australia

        17.16.1. Pricing Analysis

        17.16.2. Market Share Analysis, 2023

            17.16.2.1. By Grade

            17.16.2.2. By Source

            17.16.2.3. By Application

            17.16.2.4. By Function

    17.17. New Zealand

        17.17.1. Pricing Analysis

        17.17.2. Market Share Analysis, 2023

            17.17.2.1. By Grade

            17.17.2.2. By Source

            17.17.2.3. By Application

            17.17.2.4. By Function

    17.18. China

        17.18.1. Pricing Analysis

        17.18.2. Market Share Analysis, 2023

            17.18.2.1. By Grade

            17.18.2.2. By Source

            17.18.2.3. By Application

            17.18.2.4. By Function

    17.19. Japan

        17.19.1. Pricing Analysis

        17.19.2. Market Share Analysis, 2023

            17.19.2.1. By Grade

            17.19.2.2. By Source

            17.19.2.3. By Application

            17.19.2.4. By Function

    17.20. South Korea

        17.20.1. Pricing Analysis

        17.20.2. Market Share Analysis, 2023

            17.20.2.1. By Grade

            17.20.2.2. By Source

            17.20.2.3. By Application

            17.20.2.4. By Function

    17.21. GCC Countries

        17.21.1. Pricing Analysis

        17.21.2. Market Share Analysis, 2023

            17.21.2.1. By Grade

            17.21.2.2. By Source

            17.21.2.3. By Application

            17.21.2.4. By Function

    17.22. South Africa

        17.22.1. Pricing Analysis

        17.22.2. Market Share Analysis, 2023

            17.22.2.1. By Grade

            17.22.2.2. By Source

            17.22.2.3. By Application

            17.22.2.4. By Function

    17.23. Israel

        17.23.1. Pricing Analysis

        17.23.2. Market Share Analysis, 2023

            17.23.2.1. By Grade

            17.23.2.2. By Source

            17.23.2.3. By Application

            17.23.2.4. By Function

18. Market Structure Analysis

    18.1. Competition Dashboard

    18.2. Competition Benchmarking

    18.3. Market Share Analysis of Top Players

        18.3.1. By Regional

        18.3.2. By Grade

        18.3.3. By Source

        18.3.4. By Application

        18.3.5. By Function

19. Competition Analysis

    19.1. Competition Deep Dive

        19.1.1. Fiberstar, Inc.

            19.1.1.1. Overview

            19.1.1.2. Product Portfolio

            19.1.1.3. Profitability by Market Segments

            19.1.1.4. Sales Footprint

            19.1.1.5. Strategy Overview

                19.1.1.5.1. Marketing Strategy

                19.1.1.5.2. Product Strategy

                19.1.1.5.3. Channel Strategy

        19.1.2. CEAMSA

            19.1.2.1. Overview

            19.1.2.2. Product Portfolio

            19.1.2.3. Profitability by Market Segments

            19.1.2.4. Sales Footprint

            19.1.2.5. Strategy Overview

                19.1.2.5.1. Marketing Strategy

                19.1.2.5.2. Product Strategy

                19.1.2.5.3. Channel Strategy

        19.1.3. CP Kelco, Inc.

            19.1.3.1. Overview

            19.1.3.2. Product Portfolio

            19.1.3.3. Profitability by Market Segments

            19.1.3.4. Sales Footprint

            19.1.3.5. Strategy Overview

                19.1.3.5.1. Marketing Strategy

                19.1.3.5.2. Product Strategy

                19.1.3.5.3. Channel Strategy

        19.1.4. Herbafoods Ingredients GmbH

            19.1.4.1. Overview

            19.1.4.2. Product Portfolio

            19.1.4.3. Profitability by Market Segments

            19.1.4.4. Sales Footprint

            19.1.4.5. Strategy Overview

                19.1.4.5.1. Marketing Strategy

                19.1.4.5.2. Product Strategy

                19.1.4.5.3. Channel Strategy

        19.1.5. Florida Food Products, Inc.

            19.1.5.1. Overview

            19.1.5.2. Product Portfolio

            19.1.5.3. Profitability by Market Segments

            19.1.5.4. Sales Footprint

            19.1.5.5. Strategy Overview

                19.1.5.5.1. Marketing Strategy

                19.1.5.5.2. Product Strategy

                19.1.5.5.3. Channel Strategy

        19.1.6. Lemont

            19.1.6.1. Overview

            19.1.6.2. Product Portfolio

            19.1.6.3. Profitability by Market Segments

            19.1.6.4. Sales Footprint

            19.1.6.5. Strategy Overview

                19.1.6.5.1. Marketing Strategy

                19.1.6.5.2. Product Strategy

                19.1.6.5.3. Channel Strategy

        19.1.7. Golden Health

            19.1.7.1. Overview

            19.1.7.2. Product Portfolio

            19.1.7.3. Profitability by Market Segments

            19.1.7.4. Sales Footprint

            19.1.7.5. Strategy Overview

                19.1.7.5.1. Marketing Strategy

                19.1.7.5.2. Product Strategy

                19.1.7.5.3. Channel Strategy

        19.1.8. FUYAN PHARM (Henan), Inc.

            19.1.8.1. Overview

            19.1.8.2. Product Portfolio

            19.1.8.3. Profitability by Market Segments

            19.1.8.4. Sales Footprint

            19.1.8.5. Strategy Overview

                19.1.8.5.1. Marketing Strategy

                19.1.8.5.2. Product Strategy

                19.1.8.5.3. Channel Strategy

        19.1.9. Nans Products

            19.1.9.1. Overview

            19.1.9.2. Product Portfolio

            19.1.9.3. Profitability by Market Segments

            19.1.9.4. Sales Footprint

            19.1.9.5. Strategy Overview

                19.1.9.5.1. Marketing Strategy

                19.1.9.5.2. Product Strategy

                19.1.9.5.3. Channel Strategy

        19.1.10. Cifal Herbal Private Ltd.

            19.1.10.1. Overview

            19.1.10.2. Product Portfolio

            19.1.10.3. Profitability by Market Segments

            19.1.10.4. Sales Footprint

            19.1.10.5. Strategy Overview

                19.1.10.5.1. Marketing Strategy

                19.1.10.5.2. Product Strategy

                19.1.10.5.3. Channel Strategy

20. Assumptions & Acronyms Used

21. Research Methodology

Don't pay for what you don't need

Customize your report by selecting specific countries or regions and save 30%!

List of Tables

Table 1: Global Market Value (US$ Million) Forecast by Region, 2019 to 2034

Table 2: Global Market Volume (Tons) Forecast by Region, 2019 to 2034

Table 3: Global Market Value (US$ Million) Forecast by Grade, 2019 to 2034

Table 4: Global Market Volume (Tons) Forecast by Grade, 2019 to 2034

Table 5: Global Market Value (US$ Million) Forecast by Source, 2019 to 2034

Table 6: Global Market Volume (Tons) Forecast by Source, 2019 to 2034

Table 7: Global Market Value (US$ Million) Forecast by Application, 2019 to 2034

Table 8: Global Market Volume (Tons) Forecast by Application, 2019 to 2034

Table 9: Global Market Value (US$ Million) Forecast by Function, 2019 to 2034

Table 10: Global Market Volume (Tons) Forecast by Function, 2019 to 2034

Table 11: North America Market Value (US$ Million) Forecast by Country, 2019 to 2034

Table 12: North America Market Volume (Tons) Forecast by Country, 2019 to 2034

Table 13: North America Market Value (US$ Million) Forecast by Grade, 2019 to 2034

Table 14: North America Market Volume (Tons) Forecast by Grade, 2019 to 2034

Table 15: North America Market Value (US$ Million) Forecast by Source, 2019 to 2034

Table 16: North America Market Volume (Tons) Forecast by Source, 2019 to 2034

Table 17: North America Market Value (US$ Million) Forecast by Application, 2019 to 2034

Table 18: North America Market Volume (Tons) Forecast by Application, 2019 to 2034

Table 19: North America Market Value (US$ Million) Forecast by Function, 2019 to 2034

Table 20: North America Market Volume (Tons) Forecast by Function, 2019 to 2034

Table 21: Latin America Market Value (US$ Million) Forecast by Country, 2019 to 2034

Table 22: Latin America Market Volume (Tons) Forecast by Country, 2019 to 2034

Table 23: Latin America Market Value (US$ Million) Forecast by Grade, 2019 to 2034

Table 24: Latin America Market Volume (Tons) Forecast by Grade, 2019 to 2034

Table 25: Latin America Market Value (US$ Million) Forecast by Source, 2019 to 2034

Table 26: Latin America Market Volume (Tons) Forecast by Source, 2019 to 2034

Table 27: Latin America Market Value (US$ Million) Forecast by Application, 2019 to 2034

Table 28: Latin America Market Volume (Tons) Forecast by Application, 2019 to 2034

Table 29: Latin America Market Value (US$ Million) Forecast by Function, 2019 to 2034

Table 30: Latin America Market Volume (Tons) Forecast by Function, 2019 to 2034

Table 31: Western Europe Market Value (US$ Million) Forecast by Country, 2019 to 2034

Table 32: Western Europe Market Volume (Tons) Forecast by Country, 2019 to 2034

Table 33: Western Europe Market Value (US$ Million) Forecast by Grade, 2019 to 2034

Table 34: Western Europe Market Volume (Tons) Forecast by Grade, 2019 to 2034

Table 35: Western Europe Market Value (US$ Million) Forecast by Source, 2019 to 2034

Table 36: Western Europe Market Volume (Tons) Forecast by Source, 2019 to 2034

Table 37: Western Europe Market Value (US$ Million) Forecast by Application, 2019 to 2034

Table 38: Western Europe Market Volume (Tons) Forecast by Application, 2019 to 2034

Table 39: Western Europe Market Value (US$ Million) Forecast by Function, 2019 to 2034

Table 40: Western Europe Market Volume (Tons) Forecast by Function, 2019 to 2034

Table 41: Eastern Europe Market Value (US$ Million) Forecast by Country, 2019 to 2034

Table 42: Eastern Europe Market Volume (Tons) Forecast by Country, 2019 to 2034

Table 43: Eastern Europe Market Value (US$ Million) Forecast by Grade, 2019 to 2034

Table 44: Eastern Europe Market Volume (Tons) Forecast by Grade, 2019 to 2034

Table 45: Eastern Europe Market Value (US$ Million) Forecast by Source, 2019 to 2034

Table 46: Eastern Europe Market Volume (Tons) Forecast by Source, 2019 to 2034

Table 47: Eastern Europe Market Value (US$ Million) Forecast by Application, 2019 to 2034

Table 48: Eastern Europe Market Volume (Tons) Forecast by Application, 2019 to 2034

Table 49: Eastern Europe Market Value (US$ Million) Forecast by Function, 2019 to 2034

Table 50: Eastern Europe Market Volume (Tons) Forecast by Function, 2019 to 2034

Table 51: South Asia and Pacific Market Value (US$ Million) Forecast by Country, 2019 to 2034

Table 52: South Asia and Pacific Market Volume (Tons) Forecast by Country, 2019 to 2034

Table 53: South Asia and Pacific Market Value (US$ Million) Forecast by Grade, 2019 to 2034

Table 54: South Asia and Pacific Market Volume (Tons) Forecast by Grade, 2019 to 2034

Table 55: South Asia and Pacific Market Value (US$ Million) Forecast by Source, 2019 to 2034

Table 56: South Asia and Pacific Market Volume (Tons) Forecast by Source, 2019 to 2034

Table 57: South Asia and Pacific Market Value (US$ Million) Forecast by Application, 2019 to 2034

Table 58: South Asia and Pacific Market Volume (Tons) Forecast by Application, 2019 to 2034

Table 59: South Asia and Pacific Market Value (US$ Million) Forecast by Function, 2019 to 2034

Table 60: South Asia and Pacific Market Volume (Tons) Forecast by Function, 2019 to 2034

Table 61: East Asia Market Value (US$ Million) Forecast by Country, 2019 to 2034

Table 62: East Asia Market Volume (Tons) Forecast by Country, 2019 to 2034

Table 63: East Asia Market Value (US$ Million) Forecast by Grade, 2019 to 2034

Table 64: East Asia Market Volume (Tons) Forecast by Grade, 2019 to 2034

Table 65: East Asia Market Value (US$ Million) Forecast by Source, 2019 to 2034

Table 66: East Asia Market Volume (Tons) Forecast by Source, 2019 to 2034

Table 67: East Asia Market Value (US$ Million) Forecast by Application, 2019 to 2034

Table 68: East Asia Market Volume (Tons) Forecast by Application, 2019 to 2034

Table 69: East Asia Market Value (US$ Million) Forecast by Function, 2019 to 2034

Table 70: East Asia Market Volume (Tons) Forecast by Function, 2019 to 2034

Table 71: Middle East and Africa Market Value (US$ Million) Forecast by Country, 2019 to 2034

Table 72: Middle East and Africa Market Volume (Tons) Forecast by Country, 2019 to 2034

Table 73: Middle East and Africa Market Value (US$ Million) Forecast by Grade, 2019 to 2034

Table 74: Middle East and Africa Market Volume (Tons) Forecast by Grade, 2019 to 2034

Table 75: Middle East and Africa Market Value (US$ Million) Forecast by Source, 2019 to 2034

Table 76: Middle East and Africa Market Volume (Tons) Forecast by Source, 2019 to 2034

Table 77: Middle East and Africa Market Value (US$ Million) Forecast by Application, 2019 to 2034

Table 78: Middle East and Africa Market Volume (Tons) Forecast by Application, 2019 to 2034

Table 79: Middle East and Africa Market Value (US$ Million) Forecast by Function, 2019 to 2034

Table 80: Middle East and Africa Market Volume (Tons) Forecast by Function, 2019 to 2034
Nandini Roy Choudhury

Principal Consultant

Talk to Analyst

Find your sweet spots for generating winning opportunities in this market.

List of Charts

Figure 1: Global Market Value (US$ Million) by Grade, 2024 to 2034

Figure 2: Global Market Value (US$ Million) by Source, 2024 to 2034

Figure 3: Global Market Value (US$ Million) by Application, 2024 to 2034

Figure 4: Global Market Value (US$ Million) by Function, 2024 to 2034

Figure 5: Global Market Value (US$ Million) by Region, 2024 to 2034

Figure 6: Global Market Value (US$ Million) Analysis by Region, 2019 to 2034

Figure 7: Global Market Volume (Tons) Analysis by Region, 2019 to 2034

Figure 8: Global Market Value Share (%) and BPS Analysis by Region, 2024 to 2034

Figure 9: Global Market Y-o-Y Growth (%) Projections by Region, 2024 to 2034

Figure 10: Global Market Value (US$ Million) Analysis by Grade, 2019 to 2034

Figure 11: Global Market Volume (Tons) Analysis by Grade, 2019 to 2034

Figure 12: Global Market Value Share (%) and BPS Analysis by Grade, 2024 to 2034

Figure 13: Global Market Y-o-Y Growth (%) Projections by Grade, 2024 to 2034

Figure 14: Global Market Value (US$ Million) Analysis by Source, 2019 to 2034

Figure 15: Global Market Volume (Tons) Analysis by Source, 2019 to 2034

Figure 16: Global Market Value Share (%) and BPS Analysis by Source, 2024 to 2034

Figure 17: Global Market Y-o-Y Growth (%) Projections by Source, 2024 to 2034

Figure 18: Global Market Value (US$ Million) Analysis by Application, 2019 to 2034

Figure 19: Global Market Volume (Tons) Analysis by Application, 2019 to 2034

Figure 20: Global Market Value Share (%) and BPS Analysis by Application, 2024 to 2034

Figure 21: Global Market Y-o-Y Growth (%) Projections by Application, 2024 to 2034

Figure 22: Global Market Value (US$ Million) Analysis by Function, 2019 to 2034

Figure 23: Global Market Volume (Tons) Analysis by Function, 2019 to 2034

Figure 24: Global Market Value Share (%) and BPS Analysis by Function, 2024 to 2034

Figure 25: Global Market Y-o-Y Growth (%) Projections by Function, 2024 to 2034

Figure 26: Global Market Attractiveness by Grade, 2024 to 2034

Figure 27: Global Market Attractiveness by Source, 2024 to 2034

Figure 28: Global Market Attractiveness by Application, 2024 to 2034

Figure 29: Global Market Attractiveness by Function, 2024 to 2034

Figure 30: Global Market Attractiveness by Region, 2024 to 2034

Figure 31: North America Market Value (US$ Million) by Grade, 2024 to 2034

Figure 32: North America Market Value (US$ Million) by Source, 2024 to 2034

Figure 33: North America Market Value (US$ Million) by Application, 2024 to 2034

Figure 34: North America Market Value (US$ Million) by Function, 2024 to 2034

Figure 35: North America Market Value (US$ Million) by Country, 2024 to 2034

Figure 36: North America Market Value (US$ Million) Analysis by Country, 2019 to 2034

Figure 37: North America Market Volume (Tons) Analysis by Country, 2019 to 2034

Figure 38: North America Market Value Share (%) and BPS Analysis by Country, 2024 to 2034

Figure 39: North America Market Y-o-Y Growth (%) Projections by Country, 2024 to 2034

Figure 40: North America Market Value (US$ Million) Analysis by Grade, 2019 to 2034

Figure 41: North America Market Volume (Tons) Analysis by Grade, 2019 to 2034

Figure 42: North America Market Value Share (%) and BPS Analysis by Grade, 2024 to 2034

Figure 43: North America Market Y-o-Y Growth (%) Projections by Grade, 2024 to 2034

Figure 44: North America Market Value (US$ Million) Analysis by Source, 2019 to 2034

Figure 45: North America Market Volume (Tons) Analysis by Source, 2019 to 2034

Figure 46: North America Market Value Share (%) and BPS Analysis by Source, 2024 to 2034

Figure 47: North America Market Y-o-Y Growth (%) Projections by Source, 2024 to 2034

Figure 48: North America Market Value (US$ Million) Analysis by Application, 2019 to 2034

Figure 49: North America Market Volume (Tons) Analysis by Application, 2019 to 2034

Figure 50: North America Market Value Share (%) and BPS Analysis by Application, 2024 to 2034

Figure 51: North America Market Y-o-Y Growth (%) Projections by Application, 2024 to 2034

Figure 52: North America Market Value (US$ Million) Analysis by Function, 2019 to 2034

Figure 53: North America Market Volume (Tons) Analysis by Function, 2019 to 2034

Figure 54: North America Market Value Share (%) and BPS Analysis by Function, 2024 to 2034

Figure 55: North America Market Y-o-Y Growth (%) Projections by Function, 2024 to 2034

Figure 56: North America Market Attractiveness by Grade, 2024 to 2034

Figure 57: North America Market Attractiveness by Source, 2024 to 2034

Figure 58: North America Market Attractiveness by Application, 2024 to 2034

Figure 59: North America Market Attractiveness by Function, 2024 to 2034

Figure 60: North America Market Attractiveness by Country, 2024 to 2034

Figure 61: Latin America Market Value (US$ Million) by Grade, 2024 to 2034

Figure 62: Latin America Market Value (US$ Million) by Source, 2024 to 2034

Figure 63: Latin America Market Value (US$ Million) by Application, 2024 to 2034

Figure 64: Latin America Market Value (US$ Million) by Function, 2024 to 2034

Figure 65: Latin America Market Value (US$ Million) by Country, 2024 to 2034

Figure 66: Latin America Market Value (US$ Million) Analysis by Country, 2019 to 2034

Figure 67: Latin America Market Volume (Tons) Analysis by Country, 2019 to 2034

Figure 68: Latin America Market Value Share (%) and BPS Analysis by Country, 2024 to 2034

Figure 69: Latin America Market Y-o-Y Growth (%) Projections by Country, 2024 to 2034

Figure 70: Latin America Market Value (US$ Million) Analysis by Grade, 2019 to 2034

Figure 71: Latin America Market Volume (Tons) Analysis by Grade, 2019 to 2034

Figure 72: Latin America Market Value Share (%) and BPS Analysis by Grade, 2024 to 2034

Figure 73: Latin America Market Y-o-Y Growth (%) Projections by Grade, 2024 to 2034

Figure 74: Latin America Market Value (US$ Million) Analysis by Source, 2019 to 2034

Figure 75: Latin America Market Volume (Tons) Analysis by Source, 2019 to 2034

Figure 76: Latin America Market Value Share (%) and BPS Analysis by Source, 2024 to 2034

Figure 77: Latin America Market Y-o-Y Growth (%) Projections by Source, 2024 to 2034

Figure 78: Latin America Market Value (US$ Million) Analysis by Application, 2019 to 2034

Figure 79: Latin America Market Volume (Tons) Analysis by Application, 2019 to 2034

Figure 80: Latin America Market Value Share (%) and BPS Analysis by Application, 2024 to 2034

Figure 81: Latin America Market Y-o-Y Growth (%) Projections by Application, 2024 to 2034

Figure 82: Latin America Market Value (US$ Million) Analysis by Function, 2019 to 2034

Figure 83: Latin America Market Volume (Tons) Analysis by Function, 2019 to 2034

Figure 84: Latin America Market Value Share (%) and BPS Analysis by Function, 2024 to 2034

Figure 85: Latin America Market Y-o-Y Growth (%) Projections by Function, 2024 to 2034

Figure 86: Latin America Market Attractiveness by Grade, 2024 to 2034

Figure 87: Latin America Market Attractiveness by Source, 2024 to 2034

Figure 88: Latin America Market Attractiveness by Application, 2024 to 2034

Figure 89: Latin America Market Attractiveness by Function, 2024 to 2034

Figure 90: Latin America Market Attractiveness by Country, 2024 to 2034

Figure 91: Western Europe Market Value (US$ Million) by Grade, 2024 to 2034

Figure 92: Western Europe Market Value (US$ Million) by Source, 2024 to 2034

Figure 93: Western Europe Market Value (US$ Million) by Application, 2024 to 2034

Figure 94: Western Europe Market Value (US$ Million) by Function, 2024 to 2034

Figure 95: Western Europe Market Value (US$ Million) by Country, 2024 to 2034

Figure 96: Western Europe Market Value (US$ Million) Analysis by Country, 2019 to 2034

Figure 97: Western Europe Market Volume (Tons) Analysis by Country, 2019 to 2034

Figure 98: Western Europe Market Value Share (%) and BPS Analysis by Country, 2024 to 2034

Figure 99: Western Europe Market Y-o-Y Growth (%) Projections by Country, 2024 to 2034

Figure 100: Western Europe Market Value (US$ Million) Analysis by Grade, 2019 to 2034

Figure 101: Western Europe Market Volume (Tons) Analysis by Grade, 2019 to 2034

Figure 102: Western Europe Market Value Share (%) and BPS Analysis by Grade, 2024 to 2034

Figure 103: Western Europe Market Y-o-Y Growth (%) Projections by Grade, 2024 to 2034

Figure 104: Western Europe Market Value (US$ Million) Analysis by Source, 2019 to 2034

Figure 105: Western Europe Market Volume (Tons) Analysis by Source, 2019 to 2034

Figure 106: Western Europe Market Value Share (%) and BPS Analysis by Source, 2024 to 2034

Figure 107: Western Europe Market Y-o-Y Growth (%) Projections by Source, 2024 to 2034

Figure 108: Western Europe Market Value (US$ Million) Analysis by Application, 2019 to 2034

Figure 109: Western Europe Market Volume (Tons) Analysis by Application, 2019 to 2034

Figure 110: Western Europe Market Value Share (%) and BPS Analysis by Application, 2024 to 2034

Figure 111: Western Europe Market Y-o-Y Growth (%) Projections by Application, 2024 to 2034

Figure 112: Western Europe Market Value (US$ Million) Analysis by Function, 2019 to 2034

Figure 113: Western Europe Market Volume (Tons) Analysis by Function, 2019 to 2034

Figure 114: Western Europe Market Value Share (%) and BPS Analysis by Function, 2024 to 2034

Figure 115: Western Europe Market Y-o-Y Growth (%) Projections by Function, 2024 to 2034

Figure 116: Western Europe Market Attractiveness by Grade, 2024 to 2034

Figure 117: Western Europe Market Attractiveness by Source, 2024 to 2034

Figure 118: Western Europe Market Attractiveness by Application, 2024 to 2034

Figure 119: Western Europe Market Attractiveness by Function, 2024 to 2034

Figure 120: Western Europe Market Attractiveness by Country, 2024 to 2034

Figure 121: Eastern Europe Market Value (US$ Million) by Grade, 2024 to 2034

Figure 122: Eastern Europe Market Value (US$ Million) by Source, 2024 to 2034

Figure 123: Eastern Europe Market Value (US$ Million) by Application, 2024 to 2034

Figure 124: Eastern Europe Market Value (US$ Million) by Function, 2024 to 2034

Figure 125: Eastern Europe Market Value (US$ Million) by Country, 2024 to 2034

Figure 126: Eastern Europe Market Value (US$ Million) Analysis by Country, 2019 to 2034

Figure 127: Eastern Europe Market Volume (Tons) Analysis by Country, 2019 to 2034

Figure 128: Eastern Europe Market Value Share (%) and BPS Analysis by Country, 2024 to 2034

Figure 129: Eastern Europe Market Y-o-Y Growth (%) Projections by Country, 2024 to 2034

Figure 130: Eastern Europe Market Value (US$ Million) Analysis by Grade, 2019 to 2034

Figure 131: Eastern Europe Market Volume (Tons) Analysis by Grade, 2019 to 2034

Figure 132: Eastern Europe Market Value Share (%) and BPS Analysis by Grade, 2024 to 2034

Figure 133: Eastern Europe Market Y-o-Y Growth (%) Projections by Grade, 2024 to 2034

Figure 134: Eastern Europe Market Value (US$ Million) Analysis by Source, 2019 to 2034

Figure 135: Eastern Europe Market Volume (Tons) Analysis by Source, 2019 to 2034

Figure 136: Eastern Europe Market Value Share (%) and BPS Analysis by Source, 2024 to 2034

Figure 137: Eastern Europe Market Y-o-Y Growth (%) Projections by Source, 2024 to 2034

Figure 138: Eastern Europe Market Value (US$ Million) Analysis by Application, 2019 to 2034

Figure 139: Eastern Europe Market Volume (Tons) Analysis by Application, 2019 to 2034

Figure 140: Eastern Europe Market Value Share (%) and BPS Analysis by Application, 2024 to 2034

Figure 141: Eastern Europe Market Y-o-Y Growth (%) Projections by Application, 2024 to 2034

Figure 142: Eastern Europe Market Value (US$ Million) Analysis by Function, 2019 to 2034

Figure 143: Eastern Europe Market Volume (Tons) Analysis by Function, 2019 to 2034

Figure 144: Eastern Europe Market Value Share (%) and BPS Analysis by Function, 2024 to 2034

Figure 145: Eastern Europe Market Y-o-Y Growth (%) Projections by Function, 2024 to 2034

Figure 146: Eastern Europe Market Attractiveness by Grade, 2024 to 2034

Figure 147: Eastern Europe Market Attractiveness by Source, 2024 to 2034

Figure 148: Eastern Europe Market Attractiveness by Application, 2024 to 2034

Figure 149: Eastern Europe Market Attractiveness by Function, 2024 to 2034

Figure 150: Eastern Europe Market Attractiveness by Country, 2024 to 2034

Figure 151: South Asia and Pacific Market Value (US$ Million) by Grade, 2024 to 2034

Figure 152: South Asia and Pacific Market Value (US$ Million) by Source, 2024 to 2034

Figure 153: South Asia and Pacific Market Value (US$ Million) by Application, 2024 to 2034

Figure 154: South Asia and Pacific Market Value (US$ Million) by Function, 2024 to 2034

Figure 155: South Asia and Pacific Market Value (US$ Million) by Country, 2024 to 2034

Figure 156: South Asia and Pacific Market Value (US$ Million) Analysis by Country, 2019 to 2034

Figure 157: South Asia and Pacific Market Volume (Tons) Analysis by Country, 2019 to 2034

Figure 158: South Asia and Pacific Market Value Share (%) and BPS Analysis by Country, 2024 to 2034

Figure 159: South Asia and Pacific Market Y-o-Y Growth (%) Projections by Country, 2024 to 2034

Figure 160: South Asia and Pacific Market Value (US$ Million) Analysis by Grade, 2019 to 2034

Figure 161: South Asia and Pacific Market Volume (Tons) Analysis by Grade, 2019 to 2034

Figure 162: South Asia and Pacific Market Value Share (%) and BPS Analysis by Grade, 2024 to 2034

Figure 163: South Asia and Pacific Market Y-o-Y Growth (%) Projections by Grade, 2024 to 2034

Figure 164: South Asia and Pacific Market Value (US$ Million) Analysis by Source, 2019 to 2034

Figure 165: South Asia and Pacific Market Volume (Tons) Analysis by Source, 2019 to 2034

Figure 166: South Asia and Pacific Market Value Share (%) and BPS Analysis by Source, 2024 to 2034

Figure 167: South Asia and Pacific Market Y-o-Y Growth (%) Projections by Source, 2024 to 2034

Figure 168: South Asia and Pacific Market Value (US$ Million) Analysis by Application, 2019 to 2034

Figure 169: South Asia and Pacific Market Volume (Tons) Analysis by Application, 2019 to 2034

Figure 170: South Asia and Pacific Market Value Share (%) and BPS Analysis by Application, 2024 to 2034

Figure 171: South Asia and Pacific Market Y-o-Y Growth (%) Projections by Application, 2024 to 2034

Figure 172: South Asia and Pacific Market Value (US$ Million) Analysis by Function, 2019 to 2034

Figure 173: South Asia and Pacific Market Volume (Tons) Analysis by Function, 2019 to 2034

Figure 174: South Asia and Pacific Market Value Share (%) and BPS Analysis by Function, 2024 to 2034

Figure 175: South Asia and Pacific Market Y-o-Y Growth (%) Projections by Function, 2024 to 2034

Figure 176: South Asia and Pacific Market Attractiveness by Grade, 2024 to 2034

Figure 177: South Asia and Pacific Market Attractiveness by Source, 2024 to 2034

Figure 178: South Asia and Pacific Market Attractiveness by Application, 2024 to 2034

Figure 179: South Asia and Pacific Market Attractiveness by Function, 2024 to 2034

Figure 180: South Asia and Pacific Market Attractiveness by Country, 2024 to 2034

Figure 181: East Asia Market Value (US$ Million) by Grade, 2024 to 2034

Figure 182: East Asia Market Value (US$ Million) by Source, 2024 to 2034

Figure 183: East Asia Market Value (US$ Million) by Application, 2024 to 2034

Figure 184: East Asia Market Value (US$ Million) by Function, 2024 to 2034

Figure 185: East Asia Market Value (US$ Million) by Country, 2024 to 2034

Figure 186: East Asia Market Value (US$ Million) Analysis by Country, 2019 to 2034

Figure 187: East Asia Market Volume (Tons) Analysis by Country, 2019 to 2034

Figure 188: East Asia Market Value Share (%) and BPS Analysis by Country, 2024 to 2034

Figure 189: East Asia Market Y-o-Y Growth (%) Projections by Country, 2024 to 2034

Figure 190: East Asia Market Value (US$ Million) Analysis by Grade, 2019 to 2034

Figure 191: East Asia Market Volume (Tons) Analysis by Grade, 2019 to 2034

Figure 192: East Asia Market Value Share (%) and BPS Analysis by Grade, 2024 to 2034

Figure 193: East Asia Market Y-o-Y Growth (%) Projections by Grade, 2024 to 2034

Figure 194: East Asia Market Value (US$ Million) Analysis by Source, 2019 to 2034

Figure 195: East Asia Market Volume (Tons) Analysis by Source, 2019 to 2034

Figure 196: East Asia Market Value Share (%) and BPS Analysis by Source, 2024 to 2034

Figure 197: East Asia Market Y-o-Y Growth (%) Projections by Source, 2024 to 2034

Figure 198: East Asia Market Value (US$ Million) Analysis by Application, 2019 to 2034

Figure 199: East Asia Market Volume (Tons) Analysis by Application, 2019 to 2034

Figure 200: East Asia Market Value Share (%) and BPS Analysis by Application, 2024 to 2034

Figure 201: East Asia Market Y-o-Y Growth (%) Projections by Application, 2024 to 2034

Figure 202: East Asia Market Value (US$ Million) Analysis by Function, 2019 to 2034

Figure 203: East Asia Market Volume (Tons) Analysis by Function, 2019 to 2034

Figure 204: East Asia Market Value Share (%) and BPS Analysis by Function, 2024 to 2034

Figure 205: East Asia Market Y-o-Y Growth (%) Projections by Function, 2024 to 2034

Figure 206: East Asia Market Attractiveness by Grade, 2024 to 2034

Figure 207: East Asia Market Attractiveness by Source, 2024 to 2034

Figure 208: East Asia Market Attractiveness by Application, 2024 to 2034

Figure 209: East Asia Market Attractiveness by Function, 2024 to 2034

Figure 210: East Asia Market Attractiveness by Country, 2024 to 2034

Figure 211: Middle East and Africa Market Value (US$ Million) by Grade, 2024 to 2034

Figure 212: Middle East and Africa Market Value (US$ Million) by Source, 2024 to 2034

Figure 213: Middle East and Africa Market Value (US$ Million) by Application, 2024 to 2034

Figure 214: Middle East and Africa Market Value (US$ Million) by Function, 2024 to 2034

Figure 215: Middle East and Africa Market Value (US$ Million) by Country, 2024 to 2034

Figure 216: Middle East and Africa Market Value (US$ Million) Analysis by Country, 2019 to 2034

Figure 217: Middle East and Africa Market Volume (Tons) Analysis by Country, 2019 to 2034

Figure 218: Middle East and Africa Market Value Share (%) and BPS Analysis by Country, 2024 to 2034

Figure 219: Middle East and Africa Market Y-o-Y Growth (%) Projections by Country, 2024 to 2034

Figure 220: Middle East and Africa Market Value (US$ Million) Analysis by Grade, 2019 to 2034

Figure 221: Middle East and Africa Market Volume (Tons) Analysis by Grade, 2019 to 2034

Figure 222: Middle East and Africa Market Value Share (%) and BPS Analysis by Grade, 2024 to 2034

Figure 223: Middle East and Africa Market Y-o-Y Growth (%) Projections by Grade, 2024 to 2034

Figure 224: Middle East and Africa Market Value (US$ Million) Analysis by Source, 2019 to 2034

Figure 225: Middle East and Africa Market Volume (Tons) Analysis by Source, 2019 to 2034

Figure 226: Middle East and Africa Market Value Share (%) and BPS Analysis by Source, 2024 to 2034

Figure 227: Middle East and Africa Market Y-o-Y Growth (%) Projections by Source, 2024 to 2034

Figure 228: Middle East and Africa Market Value (US$ Million) Analysis by Application, 2019 to 2034

Figure 229: Middle East and Africa Market Volume (Tons) Analysis by Application, 2019 to 2034

Figure 230: Middle East and Africa Market Value Share (%) and BPS Analysis by Application, 2024 to 2034

Figure 231: Middle East and Africa Market Y-o-Y Growth (%) Projections by Application, 2024 to 2034

Figure 232: Middle East and Africa Market Value (US$ Million) Analysis by Function, 2019 to 2034

Figure 233: Middle East and Africa Market Volume (Tons) Analysis by Function, 2019 to 2034

Figure 234: Middle East and Africa Market Value Share (%) and BPS Analysis by Function, 2024 to 2034

Figure 235: Middle East and Africa Market Y-o-Y Growth (%) Projections by Function, 2024 to 2034

Figure 236: Middle East and Africa Market Attractiveness by Grade, 2024 to 2034

Figure 237: Middle East and Africa Market Attractiveness by Source, 2024 to 2034

Figure 238: Middle East and Africa Market Attractiveness by Application, 2024 to 2034

Figure 239: Middle East and Africa Market Attractiveness by Function, 2024 to 2034

Figure 240: Middle East and Africa Market Attractiveness by Country, 2024 to 2034

Recommendations

Food and Beverage

Citrus Oil Market

Published : April 2024

Food and Beverage

Citrus Pulp Fiber Market

Published : June 2023

Food and Beverage

Citrus Powder Market

Published : January 2020

Explore Food and Beverage Insights

View Reports