

- Market Size (2026)
- USD 14.2 Mn
- Forecast (2036)
- USD 70.0 Mn
- CAGR (2026 to 2036)
- 17.3%
Citrus Water Market Size, Market Forecast and Outlook By FMI
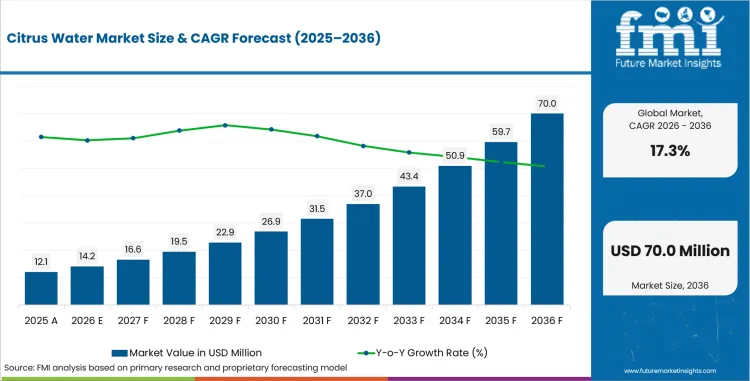
The citrus water market was valued at USD 12.1 million in 2025. The market is set to reach USD 14.2 million by 2026-end and grow at a CAGR of 17.3% between 2026-2036 to reach USD 70.0 million by 2036. Lemon Water will dominate with a 35.0% share, while Still Water will lead with a 45.0% share.
Key Takeaways, Market Size, and Forecast
- 2026 Market Size: USD 14.2 million
- 2036 Market Size: USD 70.0 million
- Compound Annual Growth Rate (CAGR): 17.3% from 2026 to 2036
- Absolute $ Opportunity: USD 55.8 million between 2026 and 2036
- Leading Product Segment: Lemon Water
- Lemon Water Share in 2026: 35.0%
- Fastest-growing Country: European Union (EU)
- European Union (EU) CAGR: 4.5% through 2036
Summary of the Citrus Water Market
| Parameter | Details |
|---|---|
| Market Size in 2026 (Value) | USD 14.2 million |
| Market Forecast in 2036 (Value) | USD 70.0 million |
| Compound Annual Growth Rate (CAGR) | 17.3% from 2026 to 2036 |
| Years Considered | 2021 to 2036 |
| Base Year | 2025 |
| Forecast Period | 2026 to 2036 |
| Units Considered | Value (USD Mn) |
| Leading Sub-Region | European Union (EU) |
- Demand and Growth Drivers
- Consumer preference for flavored hydration and low-calorie beverages is expected to sustain demand for citrus water as a mainstream alternative to carbonated soft drinks and plain water through 2036.
- Functional beverage trends, including vitamin-infused and electrolyte-enhanced water, are likely to support premiumization and higher per-unit pricing in the citrus water category during the forecast period.
- Retail channel expansion, including convenience stores and e-commerce platforms, is anticipated to increase product accessibility and impulse purchase frequency across urban consumer markets.
- Product and Segment View
- Lemon water is likely to account for 35.0% of the product segment in 2026, supported by established consumer recognition, broad flavor acceptance, and positioning as a daily hydration and wellness beverage.
- Still water form is expected to represent 45.0% of form demand, with non-carbonated citrus water as the dominant daily consumption format across retail and institutional channels.
- Retail consumers account for 75.0% of end-use demand, with individual and on-the-go consumption as the primary purchase occasions.
- Geography and Competitive Outlook
- The EU is projected to lead with a 4.5% CAGR through 2036, supported by strong consumer preference for flavored water, low-sugar beverage regulation, and established retail distribution infrastructure.
- The USA at 4.2% reflects sustained demand for flavored hydration alternatives in a market shifting away from sugary carbonated beverages toward functional and low-calorie water products.
- Companies with established brand recognition, retail distribution reach, and ability to launch functional citrus water variants are likely to capture share as the category matures beyond basic flavored water.
- Analyst Opinion
- Nandini Roy Choudhury, Principal Consultant at FMI says, 'Beverage companies that can combine citrus flavor authenticity with functional positioning such as immunity, hydration, and energy are likely to achieve premium pricing and stronger retail shelf placement over the forecast period.'
- The citrus water market is evolving from a basic flavored water category into a differentiated functional hydration platform with vitamin, electrolyte, and immunity-support positioning.
- Adoption is increasing due to consumer shift away from carbonated soft drinks, sugar reduction regulation, and growing preference for clean-label beverages with recognizable natural ingredients.
- E-commerce and direct-to-consumer channels are expanding market access beyond traditional retail, particularly for premium and functional citrus water brands.
- Sparkling citrus water variants are gaining share in social and on-premise consumption occasions, positioning citrus water as an alternative to alcoholic and sugary mixer beverages.
Citrus Water Market Definition
The citrus water market encompasses commercially produced flavored water beverages infused with citrus fruit extracts, including lemon water, orange water, lime water, and mixed citrus water. These products are sold as still, sparkling, and enhanced water variants for daily hydration, functional consumption, and sports and fitness applications.
Citrus Water Market Inclusions
Market scope covers all commercially traded citrus water products categorized by product (lemon water, orange water, lime water, mixed citrus water), form (still water, sparkling water, enhanced water), application (daily hydration, functional consumption, sports and fitness), end use (retail consumers, institutional buyers), nature (natural, organic, conventional), and distribution channel (distributor network, direct sales, retail channel, online channel). Revenue coverage spans 2026 to 2036.
Citrus Water Market Exclusions
The scope does not include citrus juice, citrus concentrate beverages with sugar content exceeding flavored water thresholds, energy drinks that do not use citrus water as a base, or homemade citrus-infused water.
Citrus Water Market Research Methodology
- Primary Research: FMI analysts conducted interviews with beverage manufacturers, retail category managers, flavored water brand owners, and distribution channel operators in key consumer markets.
- Desk Research: Combined data from beverage industry trade databases, retail scanner data, and consumer survey reports on flavored water purchase behavior.
- Market Sizing and Forecasting: Bottom-up aggregation from retail, institutional, and e-commerce channel volumes across regional consumer adoption curves and product pricing tiers.
- Data Validation: Cross-checked quarterly against beverage industry production data, retail distribution metrics, and manufacturer shipment reports.
Why is the Citrus Water Market Growing?
- Consumer shift toward flavored hydration and low-calorie beverages is generating sustained growth in citrus water, with the global market projected to reach USD 70.0 million by 2036.
- The EU leads with a 4.5% CAGR, supported by strong consumer demand for flavored water, EU sugar reduction guidelines, and established retail distribution for premium water brands.
- Functional variants, including vitamin-infused, electrolyte-enhanced, and immunity-support citrus water products, are commanding premium pricing and gaining shelf space in modern retail channels.
The citrus water market is estimated at USD 14.2 million in 2026 and is projected to reach USD 70.0 million by 2036, expanding at a CAGR of 17.3% over the forecast period. Demand is shaped by the structural consumer shift from carbonated soft drinks to flavored water and functional hydration beverages. Citrus water, with its broadly accepted flavor profile and clean-label positioning, is capturing share in the daily hydration and on-the-go consumption occasions that represent the largest volume opportunity in the beverages category.
Lemon water accounts for 35.0% of the product segment, supported by established consumer recognition and versatile positioning across daily hydration, detox, and wellness consumption occasions. Still water form represents 45.0% of form demand, while sparkling citrus water is the fastest-growing format driven by social consumption occasions and low-calorie mixer applications. Retail consumers account for 75.0% of end-use demand.
Growth reflects the convergence of health-conscious consumer behavior, sugar reduction policies, and the premiumization of the water category through functional ingredient additions. The natural product segment holds 50.0% share, while distributor networks account for 35.0% of sales as beverage distributors connect citrus water brands with supermarkets, convenience stores, and food service operators.
Market Segmentation Analysis
- Lemon water holds 35.0% of the product segment in 2026, reflecting broad consumer acceptance and its positioning across daily hydration, wellness, and detox consumption occasions.
- Still water form accounts for 45.0% of form demand, with non-carbonated citrus water as the primary daily consumption format across retail and institutional channels.
- Daily hydration represents 50.0% of application demand, followed by functional consumption and sports and fitness applications that command higher per-unit pricing.
The citrus water market is segmented by product (lemon water, orange water, lime water, mixed citrus water), form (still water, sparkling water, enhanced water), application (daily hydration, functional consumption, sports and fitness), end use (retail consumers, institutional buyers), nature (natural, organic, conventional), and distribution channel (distributor network, direct sales, retail channel, online channel).
Insights into the Lemon Water Product Segment
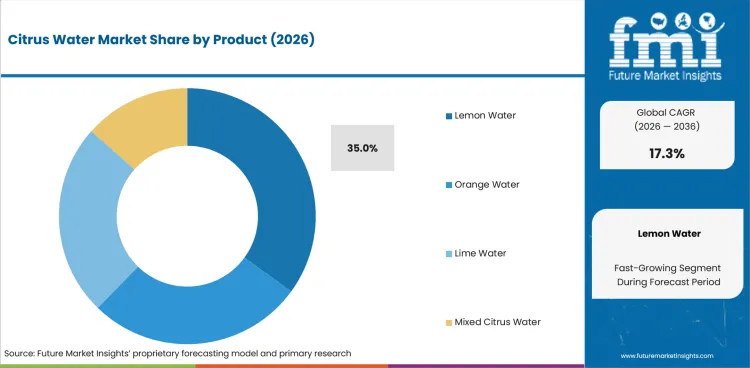
In 2026, lemon water is expected to account for 35.0% of the product segment. Still lemon water serves daily hydration and detox consumption occasions with natural and enhanced flavor variants. Sparkling lemon water is gaining share in social and on-premise consumption as a low-calorie alternative to carbonated beverages and alcoholic mixers.
Functional lemon water variants, including probiotic-enriched and low-fat options, represent a growing premium sub-segment that allows brands to achieve higher retail pricing and differentiated shelf positioning in supermarkets and specialty health food stores.
Insights into the Still Water Form Segment
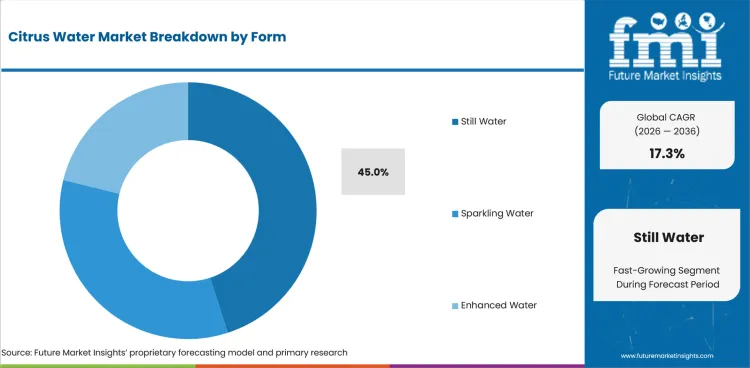
Still water form accounts for 45.0% of form demand in 2026. Non-carbonated citrus water in flat water formats serves the largest daily consumption volume, with single-serve and multi-pack formats as the primary retail configurations. Enhanced water variants, including vitamin-infused and electrolyte-infused citrus water, represent a higher-margin sub-segment.
Sparkling water form is the fastest-growing format, driven by consumer preference for carbonation in social and on-the-go consumption occasions. Flavored sparkling citrus water positions as a premium alternative to both still water and carbonated soft drinks.
Citrus Water Market Drivers, Restraints, and Opportunities
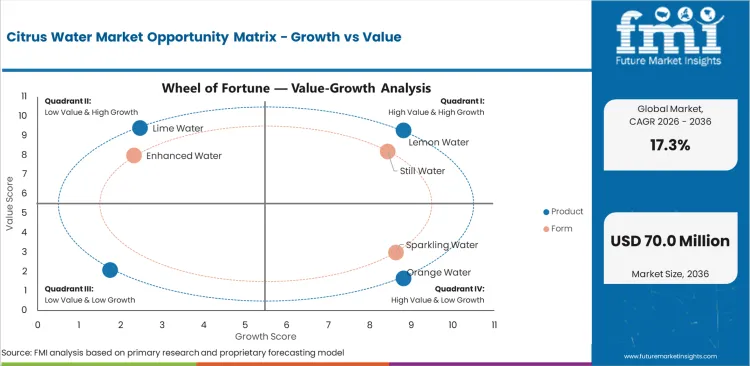
- Consumer shift from carbonated soft drinks and sugary beverages to flavored hydration products is creating structural volume growth for citrus water across retail and food service channels.
- Low brand loyalty and category fragmentation constrain individual brand market share, requiring sustained marketing investment and retail distribution effort to maintain shelf placement.
- Functional hydration positioning, including immunity, vitamin, and electrolyte enhancement, is opening premium pricing tiers and differentiated product lines beyond basic flavored water.
The citrus water market expands on the basis of consumer health-consciousness, sugar reduction trends, and functional beverage premiumization. Constraints include category fragmentation, low consumer brand loyalty, and competition from other flavored water and functional beverage categories.
Shift from Carbonated Soft Drinks
Demand is shaped by the ongoing consumer transition away from carbonated soft drinks toward lower-calorie, naturally flavored hydration alternatives. Citrus water benefits from a broadly recognized flavor profile and clean-label ingredient positioning that aligns with the preferences of health-conscious consumers across age groups.
Category Fragmentation and Brand Loyalty Challenges
Adoption is affected by the fragmented nature of the flavored water category, where low switching costs and frequent new product launches create challenges for brand differentiation and consumer retention. This requires sustained investment in marketing, retail placement, and product innovation to maintain competitive positioning.
Functional Hydration Premiumization
Growth is supported by the addition of functional ingredients, including vitamins, electrolytes, and botanical extracts, to citrus water formulations. These functional variants achieve premium retail pricing and stronger shelf placement in health food, convenience, and e-commerce channels.
Analysis of Citrus Water Market By Key Countries
.webp "Top Country Growth Comparison Citrus Water Market Cagr (2026 2036)")
| Country | CAGR |
|---|---|
| European Union (EU) | 4.5% |
| USA | 4.2% |
| South Korea | 4.1% |
| UK | 3.9% |
| Japan | 3.7% |
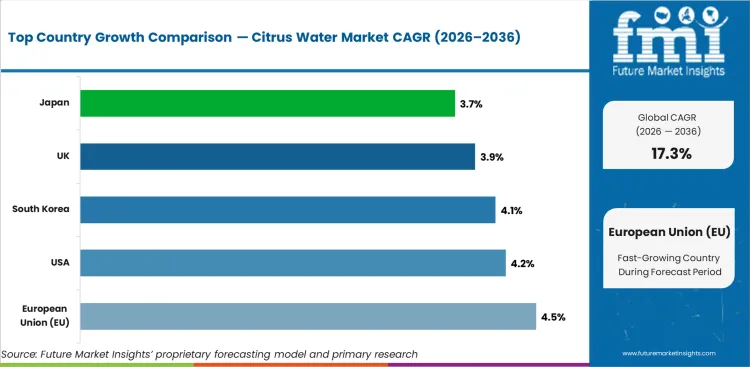
- The EU at 4.5% leads growth, supported by consumer preference for flavored water, EU sugar reduction initiatives, and mature retail distribution for premium water brands.
- The USA at 4.2% reflects sustained demand for flavored hydration alternatives as consumers continue shifting from sugary beverages to low-calorie water products.
- South Korea (4.1%) and UK (3.9%) sustain growth through premiumization of the flavored water category and expanding convenience store and e-commerce distribution.
- Japan at 3.7% maintains steady growth through quality-driven consumer preferences and established functional beverage retail infrastructure.
The global citrus water market is projected to expand at a CAGR of 17.3% from 2026 to 2036. The study covers more than 30 countries, and the primary markets are analyzed below.
Demand Outlook for Citrus Water Market in the European Union
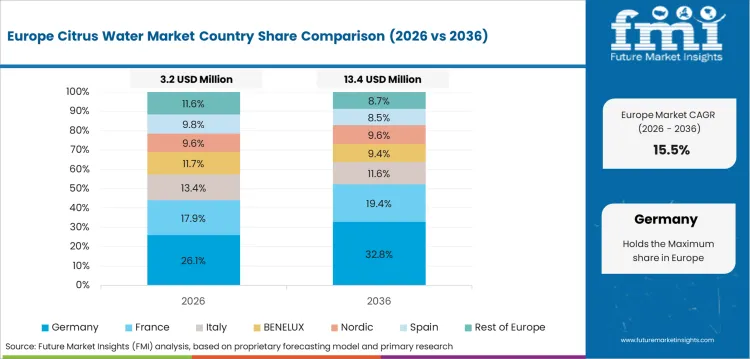
The EU is projected to lead with a 4.5% CAGR through 2036. Consumer preference for flavored water, EU sugar reduction guidelines, and established retail distribution infrastructure for premium water brands provide structural demand support.
- EU sugar reduction policies and front-of-pack labeling regulations encourage consumer migration from sugary beverages to flavored water categories including citrus water.
- Retail distribution through supermarkets, convenience stores, and food service channels provides broad consumer access across Western and Northern European markets.
- Premium and organic citrus water brands benefit from established willingness to pay for natural and functional beverages among European consumers.
Future Outlook for Citrus Water Market in the United States
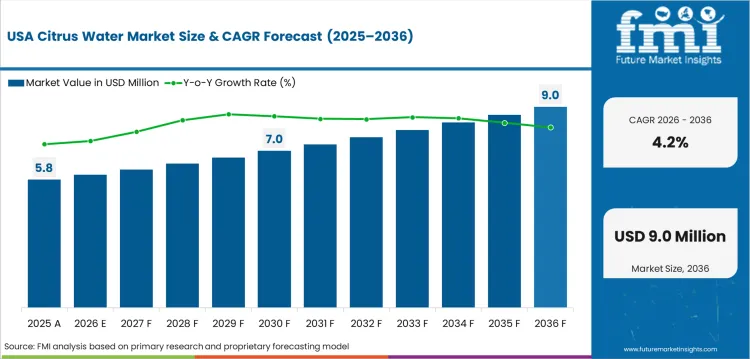
The USA is expected to grow at 4.2% through 2036. The ongoing shift from carbonated soft drinks to flavored water and functional hydration products generates consistent demand growth across retail, convenience, and e-commerce channels.
- Large beverage companies including PepsiCo and The Coca-Cola Company invest in citrus water brands and product line extensions to capture flavored hydration demand.
- Convenience store and gas station retail channels provide high-frequency impulse purchase opportunities for single-serve citrus water formats.
- Direct-to-consumer subscription models and e-commerce distribution are expanding access to premium and functional citrus water products beyond traditional retail.
Opportunity Analysis of Citrus Water Market in South Korea
South Korea is projected to expand at 4.1% through 2036. Health-conscious consumer behavior, convenience store density, and premiumization of the beverage category support citrus water adoption.
- High convenience store density across South Korean cities provides strong impulse purchase distribution for single-serve citrus water products.
- Consumer preference for functional and beauty-from-within beverages supports premium citrus water variants with added vitamins and botanical ingredients.
- K-beauty and wellness trends create cross-category awareness that benefits citrus water positioning as a daily hydration and skin health product.
In-depth Analysis of Citrus Water Market in the United Kingdom
The UK is projected to grow at 3.9% through 2036. UK Soft Drinks Industry Levy and retailer health-focused product placement support the transition to low-calorie flavored water categories.
- The UK Soft Drinks Industry Levy encourages beverage manufacturers to develop and promote low-sugar alternatives including citrus water products.
- Retailer health-aisle placement and meal-deal inclusion support consistent citrus water purchase frequency in UK supermarkets and convenience stores.
- Sparkling citrus water gains share in social and on-premise consumption as a low-calorie alternative to alcoholic and sugary mixer beverages.
Sales Analysis of Citrus Water Market in Japan
Japan is projected to grow at 3.7% through 2036. Quality-driven consumer preferences and an established functional beverage retail infrastructure support steady adoption of citrus water products.
- Japanese vending machine and convenience store networks provide high-frequency distribution points for single-serve citrus water products.
- Consumer preference for FOSHU (Foods for Specified Health Uses) designated beverages creates an opportunity for functional citrus water variants with health benefit documentation.
- Seasonal limited-edition citrus water flavors align with Japanese consumer purchasing behavior and support brand engagement and trial.
Competitive Landscape and Strategic Positioning
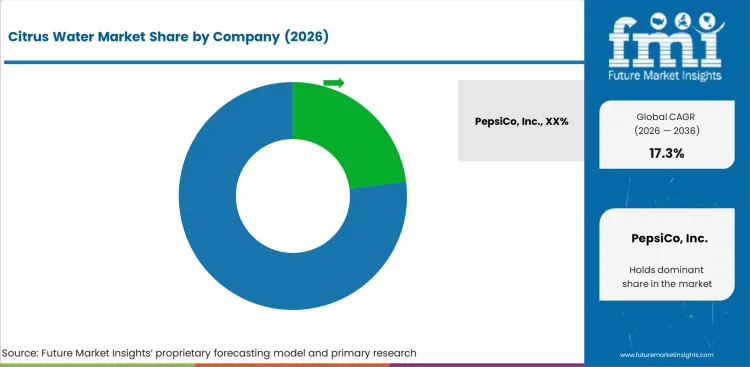
- PepsiCo, Inc. leads with a 23.0% share, supported by its global beverage distribution network and brand portfolio that includes multiple flavored water and functional hydration products.
- The Coca-Cola Company and Nestle S.A. compete on the breadth of their water and flavored beverage portfolios and established retail placement in key consumer markets.
- Emerging brands like Spindrift Beverage Co. are gaining share in the premium and clean-label citrus water segment through differentiated positioning and direct-to-consumer distribution.
PepsiCo, Inc. holds the leading position with a 23.0% share, leveraging its global beverage distribution infrastructure and brand portfolio that spans multiple flavored water and functional hydration products. The Coca-Cola Company competes through its water brand portfolio and retail distribution reach across North America, Europe, and Asia.
Nestle S.A. and Danone S.A. maintain positions in the premium and functional water segment through established brand recognition and retail relationships. Spindrift Beverage Co. has gained share in the natural and real-ingredient citrus water sub-segment through differentiated clean-label positioning.
Barriers to entry include the marketing investment required to achieve brand awareness and retail shelf placement, the capital cost of beverage production and packaging infrastructure, and the need for distribution agreements with major retail chains. Strategic priorities center on functional ingredient innovation, packaging format diversification, and e-commerce channel development.
Key Companies in the Citrus Water Market
Key global companies leading the citrus water market include:
- PepsiCo, Inc. (USA), The Coca-Cola Company (USA), and Nestle S.A. (Switzerland) maintain global beverage distribution networks, established retail relationships, and diversified water and flavored beverage portfolios that include citrus water products and line extensions.
- Danone S.A. (France) holds a strong position in the premium and functional water segment through its established water brand portfolio and distribution capabilities in European and North American markets.
- Spindrift Beverage Co. (USA) and other emerging players have gained share in the natural and clean-label citrus water sub-segment through differentiated ingredient positioning and direct-to-consumer distribution models.
Competitive Benchmarking: Citrus Water Market
| Company | Brand Portfolio | Distribution Reach | Functional Innovation | Geographic Footprint |
|---|---|---|---|---|
| PepsiCo, Inc. | High | Strong | Medium | Global |
| The Coca-Cola Company | High | Strong | Medium | Global |
| Nestle S.A. | High | Strong | Medium | Global |
| Danone S.A. | Medium | Strong | Medium | Europe, N. America |
| Spindrift Beverage Co. | Low | Moderate | High | N. America |
Source: Future Market Insights competitive analysis, 2026.
Key Developments in Citrus Water Market
- In 2025, PepsiCo launched a new functional citrus water line with added electrolytes and vitamins for the health-conscious daily hydration segment in North American retail.
- In 2025, Spindrift Beverage Co. expanded its sparkling citrus water product range with lime and mixed citrus variants for convenience store and e-commerce distribution.
Key Players in the Citrus Water Market
Major Global Players
- PepsiCo, Inc.
- The Coca-Cola Company
- Nestle S.A.
- Danone S.A.
- Spindrift Beverage Co.
Emerging Players/Startups
- Lemon Perfect
- Sanzo
Report Scope and Coverage
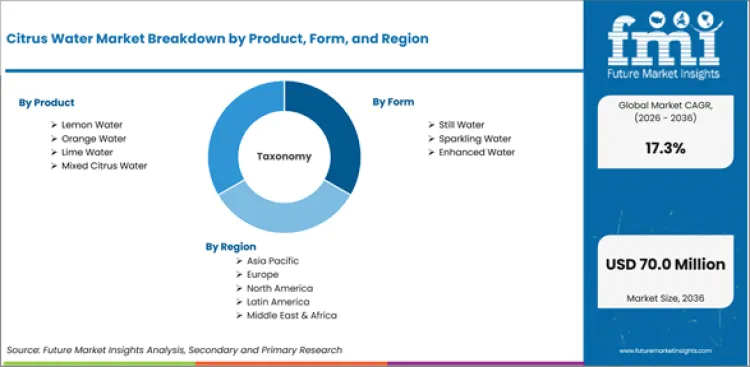
| Parameter | Details |
|---|---|
| Market size by 2036 | USD 70.0 million |
| Growth rate | 17.3% CAGR (2026 to 2036) |
| Forecast period | 2026 to 2036 |
| Base year value (2025) | USD 12.1 million |
| Key Segment Covered | Product, Form, Application, End Use, Nature, Distribution Channel |
| Regions covered | North America, Latin America, Europe, East Asia, South Asia and Pacific, Middle East and Africa |
| Countries covered | European Union (EU), USA, South Korea, UK, Japan, 30 plus countries |
| Key companies profiled | PepsiCo Inc., The Coca-Cola Company, Nestle S.A., Danone S.A., Spindrift Beverage Co. |
| Approach | Hybrid bottom-up and top-down methodology starting with verified retail and production data, projecting adoption velocity across beverage formats, channels, and regions. |
Market Segmentation Analysis
Citrus Water Market Segmented by Product:
- Lemon Water
- Still Lemon Water
- Natural Flavor
- Enhanced Flavor
- Sparkling Lemon Water
- Carbonated
- Low Calorie
- Still Lemon Water
- Orange Water
- Still Orange Water
- Natural Orange Flavor
- Fortified Orange Water
- Sparkling Orange Water
- Carbonated
- Flavored Variants
- Still Orange Water
- Lime Water
- Still Lime Water
- Classic Lime Flavor
- Herbal Infused
- Sparkling Lime Water
- Carbonated
- Low Sugar Variants
- Still Lime Water
- Mixed Citrus Water
- Blend Formulations
- Lemon Orange Blend
- Multi Citrus Blend
- Functional Blends
- Vitamin Enriched
- Electrolyte Added
- Blend Formulations
Citrus Water Market Segmented by Form:
- Still Water
- Non Carbonated
- Flat Water
- Sparkling Water
- Carbonated
- Flavored Sparkling
- Enhanced Water
- Vitamin Infused
- Electrolyte Infused
Citrus Water Market Segmented by Application:
- Daily Hydration
- Regular Consumption
- Home Use
- Office Use
- Regular Consumption
- Functional Consumption
- Health and Wellness
- Detox Drinks
- Immunity Support
- Health and Wellness
- Sports and Fitness
- Workout Hydration
- Electrolyte Drinks
- Energy Drinks
- Workout Hydration
Citrus Water Market Segmented by End Use:
- Retail Consumers
- Individual Consumers
- Personal Use
- On the Go Consumption
- Individual Consumers
- Institutional Buyers
- Corporate Offices
- Pantry Supply
- Employee Wellness
- Hospitality Sector
- Hotels
- Restaurants
- Corporate Offices
Citrus Water Market Segmented by Nature:
- Natural
- Citrus Extract Based
- No Artificial Additives
- Clean Label Products
- Citrus Extract Based
- Organic
- Certified Organic Citrus Water
- Organic Lemon Water
- Organic Orange Water
- Certified Organic Citrus Water
- Conventional
- Standard Formulations
- Artificial Flavor Added
- Cost Optimized Products
- Standard Formulations
Citrus Water Market Segmented by Distribution Channel:
- Distributor Network
- Beverage Distributors
- Regional Distributors
- Global Distributors
- Beverage Distributors
- Direct Sales
- Brand Owned Channels
- Subscription Models
- Brand Owned Channels
- Retail Channel
- Supermarkets and Hypermarkets
- Large Format Retail
- Convenience Stores
- On the Go Sales
- Supermarkets and Hypermarkets
- Online Channel
- E-commerce Platforms
- Direct to Consumer
- E-commerce Platforms
Citrus Water Market by Region:
- North America
- USA
- Canada
- Mexico
- Latin America
- Brazil
- Chile
- Rest of Latin America
- Western Europe
- Germany
- UK
- Italy
- Spain
- France
- Nordic
- BENELUX
- Rest of Western Europe
- Eastern Europe
- Russia
- Poland
- Hungary
- Balkan & Baltic
- Rest of Eastern Europe
- East Asia
- China
- Japan
- South Korea
- South Asia and Pacific
- India
- ASEAN
- Australia & New Zealand
- Rest of South Asia and Pacific
- Middle East & Africa
- Kingdom of Saudi Arabia
- Other GCC Countries
- Türkiye
- South Africa
- Other African Union
- Rest of Middle East & Africa
Research Sources and Bibliography
- 1. European Commission. (2025). EU Action Plan on Sugar Reduction: Guidelines for Beverage Manufacturers. EC.
- 2. USA Food and Drug Administration. (2025). FDA Flavored Water Labeling Requirements and Nutrition Claim Guidelines. FDA.
- 3. International Bottled Water Association. (2025). IBWA Annual Report: Flavored and Functional Water Market Statistics. IBWA.
- 4. World Health Organization. (2025). WHO Guideline on Sugars Intake for Adults and Children: Beverage Reformulation Implications. WHO.
- 5. European Federation of Bottled Waters. (2025). EFBW Annual Report: Flavored Water Consumption Trends in Europe. EFBW.
This bibliography is provided for reader reference.
This Report Answers
- Estimating the size of the citrus water market and projected revenue from 2026 to 2036.
- Segmenting by product, form, application, end use, nature, and distribution channel.
- Regional and country-level insights across more than 30 markets.
- Analysis of still, sparkling, and enhanced water formats and consumer preferences.
- Assessment of the competitive landscape and company benchmarking.
- Identifying investment opportunities in functional hydration, premium citrus water, and e-commerce distribution.
- Tracking supply chain dynamics from beverage production to retail and food service distribution.
- Delivery of data in PDF and Excel formats.
Frequently Asked Questions
How big is the citrus water market in 2026?
The global citrus water market is estimated to be valued at USD 14.2 million in 2026.
What will be the size of citrus water market in 2036?
The market size for the citrus water market is projected to reach USD 70.0 million by 2036.
How much will be the citrus water market growth between 2026 and 2036?
The citrus water market is expected to grow at a 17.3% CAGR between 2026 and 2036.
What are the key products in the citrus water market?
The key products in the citrus water market are Lemon Water, Orange Water, Lime Water and Mixed Citrus Water.
Which form segment is expected to contribute significant share in the citrus water market in 2026?
In terms of form, still water segment is expected to command 45.0% share in the citrus water market in 2026.
Preview the report firsthand - request a free sample
Get SampleGet the brochure for pricing and purchase details.
Get PDFTable of Content
- Key Takeaways
- Market Size and CAGR
- Top Growth Driver
- Fastest Growing Segment
- Leading Region
- Key Companies
- Emerging Opportunities
- Executive Summary
- Global Market Outlook
- Demand-side Trends
- Supply-side Trends
- Technology Roadmap Analysis
- Analysis and Recommendations
- Analyst Perspective (What is happening? Why now? What should investors know?)
- Key Questions Answered
- How large is the market?
- What is the CAGR?
- What are key trends?
- Which region dominates?
- Who are the leaders?
- Market Overview
- Market Coverage / Taxonomy
- Market Definition / Scope / Limitations
- Research Methodology
- Chapter Orientation
- Analytical Lens and Working Hypotheses
- Market Structure, Signals, and Trend Drivers
- Benchmarking and Cross-market Comparability
- Market Sizing, Forecasting, and Opportunity Mapping
- Research Design and Evidence Framework
- Desk Research Programme (Secondary Evidence)
- Expert Input and Fieldwork (Primary Evidence)
- Tooling, Models, and Reference Databases
- Data Engineering and Model Build
- Quality Assurance and Audit Trail
- Market Background
- Market Dynamics (Drivers, Restraints, Opportunity, Trends)
- Scenario Forecast (Optimistic, Likely, Conservative)
- Impact Analysis
- AI Impact
- Sustainability Impact
- Regulatory Impact
- Technology Impact
- Consumer / Buyer Analysis
- Purchase Drivers
- Adoption Barriers
- Buyer Journey
- Opportunity Map Analysis
- Product Life Cycle Analysis
- Supply Chain Analysis
- Investment Feasibility Matrix
- Value Chain Analysis
- PESTLE and Porter's Analysis
- Regulatory Landscape
- Regional Parent Market Outlook
- Production and Consumption Statistics
- Import and Export Statistics
- Global Market Analysis and Forecast, 2021 to 2036
- Historical Market Size Value (USD Million) Analysis, 2021 to 2025
- Current and Future Market Size Value (USD Million) Projections, 2026 to 2036
- Y-o-Y Growth Trend Analysis
- Absolute $ Opportunity Analysis
- Global Market Pricing Analysis, 2021 to 2036
- Global Market Analysis and Forecast, By Product, 2021 to 2036
- Introduction / Key Findings
- Historical Market Size Value (USD Million) Analysis By Product, 2021 to 2025
- Current and Future Market Size Value (USD Million) Analysis and Forecast By Product, 2026 to 2036
- Lemon Water
- Still Lemon Water
- Sparkling Lemon Water
- Orange Water
- Still Orange Water
- Sparkling Orange Water
- Lime Water
- Still Lime Water
- Sparkling Lime Water
- Mixed Citrus Water
- Blend Formulations
- Functional Blends
- Lemon Water
- Y-o-Y Growth Trend Analysis By Product, 2021 to 2025
- Absolute $ Opportunity Analysis By Product, 2026 to 2036
- Global Market Analysis and Forecast, By Form, 2021 to 2036
- Introduction / Key Findings
- Historical Market Size Value (USD Million) Analysis By Form, 2021 to 2025
- Current and Future Market Size Value (USD Million) Analysis and Forecast By Form, 2026 to 2036
- Still Water
- Non Carbonated
- Flat Water
- Sparkling Water
- Carbonated
- Flavored Sparkling
- Enhanced Water
- Vitamin Infused
- Electrolyte Infused
- Still Water
- Y-o-Y Growth Trend Analysis By Form, 2021 to 2025
- Absolute $ Opportunity Analysis By Form, 2026 to 2036
- Global Market Analysis and Forecast, By Application, 2021 to 2036
- Introduction / Key Findings
- Historical Market Size Value (USD Million) Analysis By Application, 2021 to 2025
- Current and Future Market Size Value (USD Million) Analysis and Forecast By Application, 2026 to 2036
- Daily Hydration
- Regular Consumption
- Functional Consumption
- Health and Wellness
- Sports and Fitness
- Workout Hydration
- Daily Hydration
- Y-o-Y Growth Trend Analysis By Application, 2021 to 2025
- Absolute $ Opportunity Analysis By Application, 2026 to 2036
- Global Market Analysis and Forecast, By End Use, 2021 to 2036
- Introduction / Key Findings
- Historical Market Size Value (USD Million) Analysis By End Use, 2021 to 2025
- Current and Future Market Size Value (USD Million) Analysis and Forecast By End Use, 2026 to 2036
- Retail Consumers
- Individual Consumers
- Institutional Buyers
- Corporate Offices
- Hospitality Sector
- Retail Consumers
- Y-o-Y Growth Trend Analysis By End Use, 2021 to 2025
- Absolute $ Opportunity Analysis By End Use, 2026 to 2036
- Global Market Analysis and Forecast, By Nature, 2021 to 2036
- Introduction / Key Findings
- Historical Market Size Value (USD Million) Analysis By Nature, 2021 to 2025
- Current and Future Market Size Value (USD Million) Analysis and Forecast By Nature, 2026 to 2036
- Natural
- Citrus Extract Based
- Organic
- Certified Organic Citrus Water
- Conventional
- Standard Formulations
- Natural
- Y-o-Y Growth Trend Analysis By Nature, 2021 to 2025
- Absolute $ Opportunity Analysis By Nature, 2026 to 2036
- Global Market Analysis and Forecast, By Distribution Channel
- Introduction / Key Findings
- Historical Market Size Value (USD Million) Analysis By Distribution Channel, 2021 to 2025
- Current and Future Market Size Value (USD Million) Analysis and Forecast By Distribution Channel, 2026 to 2036
- Distributor Network
- Beverage Distributors
- Direct Sales
- Brand Owned Channels
- Retail Channel
- Supermarkets and Hypermarkets
- Convenience Stores
- Online Channel
- E-commerce Platforms
- Distributor Network
- Y-o-Y Growth Trend Analysis By Distribution Channel, 2021 to 2025
- Absolute $ Opportunity Analysis By Distribution Channel, 2026 to 2036
- Global Market Analysis and Forecast, By Region, 2021 to 2036
- Introduction
- Historical Market Size Value (USD Million) Analysis By Region, 2021 to 2025
- Current Market Size Value (USD Million) Analysis and Forecast By Region, 2026 to 2036
- North America
- Latin America
- Western Europe
- Eastern Europe
- East Asia
- South Asia and Pacific
- Middle East & Africa
- Market Attractiveness Analysis By Region
- North America Market Analysis and Forecast, By Country, 2021 to 2036
- Historical Market Size Value (USD Million) Trend Analysis By Market Taxonomy, 2021 to 2025
- Market Size Value (USD Million) Forecast By Market Taxonomy, 2026 to 2036
- By Country
- USA
- Canada
- Mexico
- By Product
- By Form
- By Application
- By End Use
- By Nature
- By Distribution Channel
- By Country
- Market Attractiveness Analysis
- By Country
- By Product
- By Form
- By Application
- By End Use
- By Nature
- By Distribution Channel
- Key Takeaways
- Latin America Market Analysis and Forecast, By Country
- Historical Market Size Value (USD Million) Trend Analysis By Market Taxonomy, 2021 to 2025
- Market Size Value (USD Million) Forecast By Market Taxonomy, 2026 to 2036
- By Country
- Brazil
- Chile
- Rest of Latin America
- By Product
- By Form
- By Application
- By End Use
- By Nature
- By Distribution Channel
- By Country
- Market Attractiveness Analysis
- By Country
- By Product
- By Form
- By Application
- By End Use
- By Nature
- By Distribution Channel
- Key Takeaways
- Western Europe Market Analysis and Forecast, By Country
- Historical Market Size Value (USD Million) Trend Analysis By Market Taxonomy, 2021 to 2025
- Market Size Value (USD Million) Forecast By Market Taxonomy, 2026 to 2036
- By Country
- Germany
- UK
- Italy
- Spain
- France
- Nordic
- BENELUX
- Rest of Western Europe
- By Product
- By Form
- By Application
- By End Use
- By Nature
- By Distribution Channel
- By Country
- Market Attractiveness Analysis
- By Country
- By Product
- By Form
- By Application
- By End Use
- By Nature
- By Distribution Channel
- Key Takeaways
- Eastern Europe Market Analysis and Forecast, By Country
- Historical Market Size Value (USD Million) Trend Analysis By Market Taxonomy, 2021 to 2025
- Market Size Value (USD Million) Forecast By Market Taxonomy, 2026 to 2036
- By Country
- Russia
- Poland
- Hungary
- Balkan & Baltic
- Rest of Eastern Europe
- By Product
- By Form
- By Application
- By End Use
- By Nature
- By Distribution Channel
- By Country
- Market Attractiveness Analysis
- By Country
- By Product
- By Form
- By Application
- By End Use
- By Nature
- By Distribution Channel
- Key Takeaways
- East Asia Market Analysis and Forecast, By Country
- Historical Market Size Value (USD Million) Trend Analysis By Market Taxonomy, 2021 to 2025
- Market Size Value (USD Million) Forecast By Market Taxonomy, 2026 to 2036
- By Country
- China
- Japan
- South Korea
- By Product
- By Form
- By Application
- By End Use
- By Nature
- By Distribution Channel
- By Country
- Market Attractiveness Analysis
- By Country
- By Product
- By Form
- By Application
- By End Use
- By Nature
- By Distribution Channel
- Key Takeaways
- South Asia and Pacific Market Analysis and Forecast, By Country
- Historical Market Size Value (USD Million) Trend Analysis By Market Taxonomy, 2021 to 2025
- Market Size Value (USD Million) Forecast By Market Taxonomy, 2026 to 2036
- By Country
- India
- ASEAN
- Australia & New Zealand
- Rest of South Asia and Pacific
- By Product
- By Form
- By Application
- By End Use
- By Nature
- By Distribution Channel
- By Country
- Market Attractiveness Analysis
- By Country
- By Product
- By Form
- By Application
- By End Use
- By Nature
- By Distribution Channel
- Key Takeaways
- Middle East & Africa Market Analysis and Forecast, By Country
- Historical Market Size Value (USD Million) Trend Analysis By Market Taxonomy, 2021 to 2025
- Market Size Value (USD Million) Forecast By Market Taxonomy, 2026 to 2036
- By Country
- Kingdom of Saudi Arabia
- Other GCC Countries
- Türkiye
- South Africa
- Other African Union
- Rest of Middle East & Africa
- By Product
- By Form
- By Application
- By End Use
- By Nature
- By Distribution Channel
- By Country
- Market Attractiveness Analysis
- By Country
- By Product
- By Form
- By Application
- By End Use
- By Nature
- By Distribution Channel
- Key Takeaways
- Key Countries Market Analysis
- USA
- Pricing Analysis
- Market Share Analysis, 2025
- By Product
- By Form
- By Application
- By End Use
- By Nature
- By Distribution Channel
- Canada
- Pricing Analysis
- Market Share Analysis, 2025
- By Product
- By Form
- By Application
- By End Use
- By Nature
- By Distribution Channel
- Mexico
- Pricing Analysis
- Market Share Analysis, 2025
- By Product
- By Form
- By Application
- By End Use
- By Nature
- By Distribution Channel
- Brazil
- Pricing Analysis
- Market Share Analysis, 2025
- By Product
- By Form
- By Application
- By End Use
- By Nature
- By Distribution Channel
- Chile
- Pricing Analysis
- Market Share Analysis, 2025
- By Product
- By Form
- By Application
- By End Use
- By Nature
- By Distribution Channel
- Germany
- Pricing Analysis
- Market Share Analysis, 2025
- By Product
- By Form
- By Application
- By End Use
- By Nature
- By Distribution Channel
- UK
- Pricing Analysis
- Market Share Analysis, 2025
- By Product
- By Form
- By Application
- By End Use
- By Nature
- By Distribution Channel
- Italy
- Pricing Analysis
- Market Share Analysis, 2025
- By Product
- By Form
- By Application
- By End Use
- By Nature
- By Distribution Channel
- Spain
- Pricing Analysis
- Market Share Analysis, 2025
- By Product
- By Form
- By Application
- By End Use
- By Nature
- By Distribution Channel
- France
- Pricing Analysis
- Market Share Analysis, 2025
- By Product
- By Form
- By Application
- By End Use
- By Nature
- By Distribution Channel
- India
- Pricing Analysis
- Market Share Analysis, 2025
- By Product
- By Form
- By Application
- By End Use
- By Nature
- By Distribution Channel
- ASEAN
- Pricing Analysis
- Market Share Analysis, 2025
- By Product
- By Form
- By Application
- By End Use
- By Nature
- By Distribution Channel
- Australia & New Zealand
- Pricing Analysis
- Market Share Analysis, 2025
- By Product
- By Form
- By Application
- By End Use
- By Nature
- By Distribution Channel
- China
- Pricing Analysis
- Market Share Analysis, 2025
- By Product
- By Form
- By Application
- By End Use
- By Nature
- By Distribution Channel
- Japan
- Pricing Analysis
- Market Share Analysis, 2025
- By Product
- By Form
- By Application
- By End Use
- By Nature
- By Distribution Channel
- South Korea
- Pricing Analysis
- Market Share Analysis, 2025
- By Product
- By Form
- By Application
- By End Use
- By Nature
- By Distribution Channel
- Russia
- Pricing Analysis
- Market Share Analysis, 2025
- By Product
- By Form
- By Application
- By End Use
- By Nature
- By Distribution Channel
- Poland
- Pricing Analysis
- Market Share Analysis, 2025
- By Product
- By Form
- By Application
- By End Use
- By Nature
- By Distribution Channel
- Hungary
- Pricing Analysis
- Market Share Analysis, 2025
- By Product
- By Form
- By Application
- By End Use
- By Nature
- By Distribution Channel
- Kingdom of Saudi Arabia
- Pricing Analysis
- Market Share Analysis, 2025
- By Product
- By Form
- By Application
- By End Use
- By Nature
- By Distribution Channel
- Türkiye
- Pricing Analysis
- Market Share Analysis, 2025
- By Product
- By Form
- By Application
- By End Use
- By Nature
- By Distribution Channel
- South Africa
- Pricing Analysis
- Market Share Analysis, 2025
- By Product
- By Form
- By Application
- By End Use
- By Nature
- By Distribution Channel
- USA
- Market Structure Analysis
- Competition Dashboard
- Competition Benchmarking
- Market Share Analysis of Top Players
- By Regional
- By Product
- By Form
- By Application
- By End Use
- By Nature
- By Distribution Channel
- Emerging Startups
- Innovation Benchmarking
- Competition Analysis
- Competition Deep Dive
- PepsiCo, Inc.
- Overview
- Product Portfolio
- Profitability by Market Segments (Product/Region/Sales Channel)
- Sales Footprint
- Strategy Overview
- Marketing Strategy
- Product Strategy
- Channel Strategy
- The Coca-Cola Company
- Nestlé S.A.
- Danone S.A.
- Spindrift Beverage Co.
- Other Companies (combined)
- PepsiCo, Inc.
- Case Studies
- Success Stories
- Recent Developments
- Competition Deep Dive
- Assumptions & Acronyms Used


