The water leak sensors market, valued at USD 2.2 billion in 2025, is projected to reach USD 4.1 billion by 2035, growing at a CAGR of 6.5%. The market growth curve is expected to follow a steady upward slope, reflecting consistent adoption across residential, commercial, and industrial applications. Early in the forecast period, growth will be gradual as awareness of leak detection technologies expands and smart home integration gains traction. Consumers and facility managers are increasingly adopting these systems to minimize water damage, reduce maintenance costs, and improve energy efficiency, supporting early-stage expansion.
The mid-phase of the curve, between 2028 and 2031, is expected to display sharper growth due to the wider implementation of connected sensor networks and IoT-enabled monitoring solutions. The integration of real-time data analytics and wireless communication technologies will enhance product functionality and reliability, prompting higher adoption across smart infrastructure projects and large-scale commercial facilities.
In the later phase, growth is projected to stabilize as the market matures, with focus shifting toward performance optimization, cost reduction, and compliance with building safety standards. Manufacturers emphasizing innovation in battery life, miniaturization, and predictive maintenance will drive continued expansion.
Smart water sensors targeting residential applications face deployment challenges distinct from traditional industrial leak detection systems. Homeowners struggle with false alarm management when sensitivity levels trigger notifications for minor drips or humidity fluctuations. Installation complexity creates friction between property managers who want centralized monitoring and residents who resist sensor placement near personal spaces. Water damage insurance providers push automated shutoff integration, but plumbing contractors encounter liability concerns when sensors malfunction and fail to prevent flooding incidents.
Industrial leak detection markets experience regulatory compliance pressures that differ significantly from consumer applications. Chemical processing facilities must balance EPA leak detection requirements with production uptime demands, leading to tensions between environmental compliance officers and plant operations managers. Maintenance supervisors prefer redundant sensor arrays for critical equipment, but capital expenditure committees resist overlapping detection systems. Quality assurance departments require detailed calibration records that conflict with maintenance teams' focus on rapid leak response and repair workflows.
Manufacturing environments present sensor deployment challenges related to production continuity and worker safety protocols. Plant engineers specify sensors based on harsh environment tolerances and integration with existing monitoring systems, but production managers resist installation downtime required for sensor network implementation. Safety coordinators require sensors that comply with hazardous area classifications, while maintenance teams prefer standardized components that reduce inventory complexity. Quality control departments need sensor data for documentation purposes, but production supervisors prioritize immediate leak response over data collection requirements.
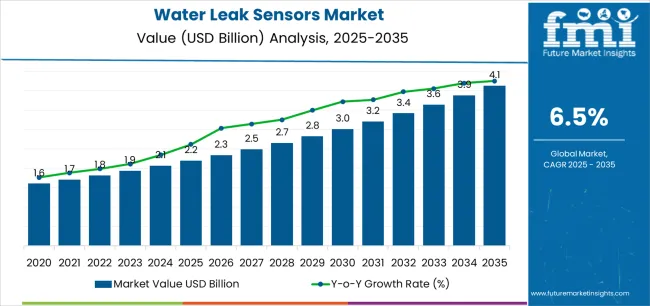
The water leak sensors market demonstrates distinct growth phases with varying market characteristics and competitive dynamics. Between 2025 and 2030, the market progresses through its smart home integration phase, expanding from USD 2.2 billion to USD 3.0 billion with steady annual increments averaging 6.5% growth. This period showcases the transition from basic alarm-only devices to advanced IoT-connected systems with enhanced predictive analytics and automated shut-off capabilities becoming mainstream features.
The 2025-2030 phase adds USD 0.8 billion to market value, representing 45% of total decade expansion. Market maturation factors include standardization of wireless connectivity protocols, declining component costs for smart leak sensors, and increasing property owner awareness of insurance premium benefits reaching 15-20% cost reduction in water damage claims. Competitive landscape evolution during this period features established building technology manufacturers like Honeywell and Resideo expanding their connected sensor portfolios while specialty manufacturers focus on AI-driven leak prediction development and enhanced water flow monitoring capabilities.
From 2030 to 2035, market dynamics shift toward advanced predictive maintenance and global infrastructure integration, with growth continuing from USD 3.0 billion to USD 4.1 billion, adding USD 1.1 billion or 55% of total expansion. This phase transition centers on fully integrated building management systems, compatibility with comprehensive property management networks, and deployment across diverse residential and commercial scenarios, becoming standard rather than specialized applications. The competitive environment matures with focus shifting from basic leak detection capability to comprehensive water management systems and integration with utility monitoring platforms.
| Metric | Value |
|---|---|
| Market Value (2025) | USD 2.2 billion |
| Market Forecast (2035) | USD 4.1 billion |
| Growth Rate | 6.5% CAGR |
| Leading Technology | Passive Spot Sensors Type |
| Primary End Use | Residential Segment |
The market demonstrates strong fundamentals with passive spot sensor systems capturing a dominant share through advanced affordability and deployment simplicity capabilities. Residential applications drive primary demand, supported by increasing property insurance requirements and smart home technology adoption needs. Geographic expansion remains concentrated in developed markets with established smart home infrastructure, while emerging economies show accelerating adoption rates driven by urban construction development and rising water conservation standards.
Market expansion rests on three fundamental shifts driving adoption across the residential, commercial real estate, and infrastructure sectors.
The insurance claims escalation creates compelling prevention advantages through leak sensors that provide early detection and automated shut-off without requiring constant monitoring, enabling property owners to avoid catastrophic water damage while reducing insurance premiums and maintaining asset protection standards.
The smart home integration acceleration worldwide as homeowners and building managers seek IoT-connected monitoring systems that replace manual inspection, enabling proactive maintenance and real-time alerts that align with property management efficiency and occupant safety objectives.
The water conservation mandates drive adoption from municipalities and commercial properties requiring effective non-revenue water reduction solutions that minimize waste while maintaining supply reliability during infrastructure modernization and sustainability compliance operations. The growth faces headwinds from initial cost barriers that vary across residential segments regarding the procurement of premium smart shut-off systems and whole-home monitoring, which may limit adoption in price-sensitive housing markets. Connectivity reliability also persists regarding battery life limitations and wireless network dependencies that may reduce effectiveness in remote properties and areas with inconsistent internet connectivity, which affect system reliability and user confidence.
The water leak sensors market represents a specialized yet critical technology opportunity driven by expanding property insurance requirements, smart building infrastructure modernization, and the need for superior water damage prevention in diverse applications. As property owners worldwide seek to achieve 80-90% claims reduction effectiveness, prevent water damage losses averaging USD 10,000-15,000 per incident, and integrate advanced monitoring systems with smart home platforms, water leak sensors are evolving from basic alarm devices to sophisticated property protection solutions ensuring asset preservation and operational continuity.
The market's growth trajectory from USD 2.2 billion in 2025 to USD 4.1 billion by 2035 at a 6.5% CAGR reflects fundamental shifts in property risk management requirements and preventive maintenance optimization. Geographic expansion opportunities are particularly pronounced in North American and Asia Pacific markets, while the dominance of passive spot sensor systems (54.6% market share) and residential applications (63.8% share) provides clear strategic focus areas.
Strengthening the dominant passive spot sensors segment (54.6% market share) through enhanced detection reliability, superior battery longevity, and simplified installation systems. This pathway focuses on optimizing sensor probe design, improving wireless range, extending battery life to 3-5 year operation cycles, and developing specialized sensors for diverse installation locations. Market leadership consolidation through cost engineering and multi-pack bundling enables competitive positioning while defending advantages against professional-grade alternatives. Expected revenue pool: USD 115-150 million
Rapid urbanization growth and smart city infrastructure development across Asia Pacific creates substantial opportunities through regional manufacturing partnerships and building code integration. Growing middle-class homeownership and commercial property construction drive sustained demand for water damage prevention systems. Regional market strategies reduce import costs, enable faster distribution, and position companies advantageously for new construction programs while accessing growing property markets. Expected revenue pool: USD 100-130 million
Expansion within the dominant residential segment (63.8% market share) through specialized products addressing homeowner insurance requirements and smart home ecosystem compatibility. This pathway encompasses whole-home monitoring systems, multi-zone coverage solutions, and compatibility with major smart home platforms including Alexa, Google Home, and Apple HomeKit. Premium positioning reflects superior user experience and comprehensive property protection supporting modern connected home expectations. Expected revenue pool: USD 90-115 million
Strategic advancement in Wi-Fi connected sensors (37.2% market share) requires enhanced mobile app experiences and specialized cloud analytics addressing predictive maintenance requirements. This pathway addresses remote monitoring capability, automated alert escalation, and AI-driven leak prediction with advanced machine learning for consumption pattern analysis. Premium pricing reflects convenience and early warning benefits through comprehensive water usage intelligence. Expected revenue pool: USD 80-105 million
Development of specialized valve-integrated systems with automatic water shut-off addressing catastrophic leak prevention and unattended property protection requirements. This pathway encompasses whole-home protection, vacation mode automation, and comprehensive flow monitoring integration. Technology differentiation through mechanical reliability enables premium revenue streams while addressing high-value property segment and second-home market requirements. Expected revenue pool: USD 70-90 million
Expansion targeting commercial buildings, data centers, and industrial facilities through specialized sensing cables and building management system compatibility for enterprise-scale deployments. This pathway encompasses zone monitoring for mechanical rooms, continuous linear detection for critical facilities, and integration with facility management platforms. Market development through ROI validation enables differentiated positioning while accessing institutional procurement requiring comprehensive water risk management. Expected revenue pool: USD 60-80 million
Development of comprehensive insurance-led deployment programs addressing claims reduction and premium discount initiatives across residential and commercial properties. This pathway encompasses insurer subsidy programs, bundled monitoring services, and comprehensive claims data integration. Premium positioning reflects risk reduction value and actuarial benefits while enabling access to insurance distribution channels and policyholder incentive programs. Expected revenue pool: USD 50-65 million
Primary Classification: The market segments by sensor type into Passive Spot Sensors, Sensing Cables/Ropes, Smart Shut-Off/Flow-Based Systems, and Inline/Ultrasonic & Others categories, representing the evolution from basic point detection to comprehensive whole-property monitoring solutions for complete water damage prevention.
Secondary Classification: Connectivity segmentation divides the market into Wi-Fi, Zigbee/Thread, LoRa/LPWAN, Cellular/NB-IoT, and Wired/BMS Bus protocols, reflecting distinct requirements for smart home integration, commercial deployments, and building management system compatibility standards.
Tertiary Classification: End use segmentation encompasses Residential, Commercial Real Estate, Industrial facilities, and Municipal/Utility Networks, representing diverse property protection requirements for leak detection and water management.
Quaternary Classification: Modality segmentation includes Standalone Battery Sensors, BMS-Integrated Gateways, Valve-Integrated systems, and Portable/Temporary Deployment Kits, representing different installation approaches and system architectures.
Quinary Classification: Sales channel segmentation covers Retail & E-Commerce, Professional Installers, OEM/BMS & Construction Spec, and Insurance-Led Programs, reflecting diverse go-to-market strategies and customer acquisition pathways.
Regional Classification: Geographic distribution covers North America, Europe, Asia Pacific, Latin America, Africa, and the Middle East, with developed property markets leading technology adoption while emerging economies show accelerating growth patterns driven by construction modernization programs.
The segmentation structure reveals technology progression from basic battery-powered alarm sensors toward cloud-connected intelligent monitoring systems with predictive analytics and automated response capabilities, while application diversity spans from single-family homes to specialized data center installations requiring comprehensive water intrusion protection.
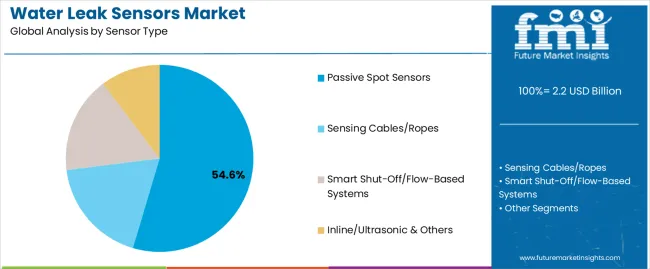
Market Position: Passive spot sensor systems command the leading position in the Water Leak Sensors market with approximately 54.6% market share through advanced affordability features, including simple installation, reliable detection capability, and deployment flexibility that enable property owners to achieve comprehensive monitoring coverage across multiple vulnerable locations.
Value Drivers: The segment benefits from homeowner preference for cost-effective protection systems that provide reliable water detection, audible local alarms, and smartphone alerts without requiring professional installation. Advanced sensor features enable moisture detection at floor level, wireless connectivity to central hubs, and battery operation lasting 2-3 years, where affordability and ease of deployment represent critical adoption requirements.
Competitive Advantages: Passive spot sensor systems differentiate through proven detection reliability, optimal cost-per-location ratios, and integration with popular smart home platforms that enhance property protection while maintaining price points suitable for multi-room deployments and DIY installation preferences.
Key market characteristics:
Sensing cables and rope systems maintain 21.3% market share due to their essential continuous linear detection capabilities for commercial applications and mechanical room installations. Smart shut-off and flow-based systems capture 15.8% share through whole-home protection, automatic water supply isolation, and comprehensive flow monitoring for high-value properties. Inline/ultrasonic and specialty sensors demonstrate 8.3% adoption in industrial facilities, utility infrastructure, and specialized monitoring requiring advanced detection technologies.
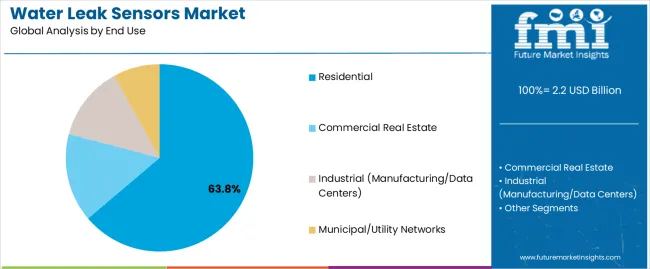
Market Context: Residential applications dominate the Water Leak Sensors market with approximately 63.8% market share due to widespread homeownership patterns and increasing focus on property damage prevention, insurance premium reduction, and smart home integration applications that maximize asset protection while maintaining peace of mind for property owners.
Appeal Factors: Homeowners prioritize affordable protection, simple installation, and integration with existing smart home infrastructure that enables proactive leak detection without requiring professional monitoring services. The segment benefits from substantial insurance company incentive programs and property protection awareness that emphasize sensor adoption for water heaters, washing machines, sinks, and other vulnerable locations reducing catastrophic damage risk.
Growth Drivers: Smart home platform expansion programs incorporate leak sensors as essential devices for connected property management, while insurance company partnerships increase adoption through premium discounts, free sensor programs, and claims prevention initiatives that comply with risk reduction standards and optimize policyholder protection.
Market Challenges: Varying property layouts and sensor placement requirements may necessitate multiple units increasing total system costs for comprehensive coverage scenarios.
Application dynamics include:
Commercial real estate maintains 23.7% market share through office buildings, hotels, data centers, and retail facilities requiring building management system integration and zone-based monitoring. Industrial applications capture 8.6% share via manufacturing facilities, cleanrooms, and data centers with mission-critical leak prevention requirements. Municipal and utility networks account for 3.9% share through water distribution infrastructure, pump stations, and treatment facilities requiring non-revenue water reduction and asset protection monitoring.
Growth Accelerators: Insurance claims escalation drives primary adoption as water leak sensors provide early detection and damage prevention that enable property owners to avoid losses averaging USD 10,000-15,000 per incident, supporting premium reduction opportunities and claims history protection that align with insurance company risk mitigation and policyholder retention objectives. Smart home ecosystem expansion demand accelerates market growth as homeowners seek integrated monitoring systems that complement security, HVAC, and lighting automation while maintaining comprehensive property protection during occupied and unattended periods. Water conservation regulatory spending increases worldwide, creating sustained demand for leak detection systems that complement municipal non-revenue water reduction, building efficiency mandates, and sustainability certification processes providing compliance effectiveness in green building programs.
Growth Inhibitors: Upfront cost barriers vary across homeowner segments regarding the procurement of premium whole-home monitoring systems and automatic shut-off valves, which may limit market penetration in price-sensitive housing markets or regions with lower property values. Connectivity dependency persists regarding Wi-Fi network reliability and cellular coverage that may reduce system effectiveness in rural properties, older construction with poor wireless penetration, or areas with inconsistent internet service, affecting real-time alerting and remote monitoring capabilities. Market fragmentation across multiple wireless protocols and platform ecosystems creates compatibility concerns between different smart home systems and existing property automation infrastructure.
Market Evolution Patterns: Adoption accelerates in high-value properties and insurance-conscious homeowners where damage prevention benefits justify sensor investments, with geographic concentration in flood-prone and freeze-susceptible regions transitioning toward mainstream adoption in all climates driven by insurance incentives and smart home normalization. Technology development focuses on enhanced AI algorithms for usage pattern analysis, improved battery technology extending replacement cycles, and integration with utility smart meters enabling comprehensive water management. The market could face disruption if alternative water management technologies or advanced plumbing materials significantly reduce leak frequency in new construction, though the installed base of aging infrastructure and appliances continues to make leak detection essential in property risk management.
The water leak sensors market demonstrates varied regional dynamics with Growth Leaders including India (8.1% CAGR) and China (7.4% CAGR) driving expansion through urban housing development and smart city infrastructure investment. Technology Adopters encompass the United States (7.0% CAGR), South Korea (6.9% CAGR), benefiting from insurance partnerships and green building mandates. Mature Markets feature the United Kingdom (6.4% CAGR) and Japan (6.3% CAGR), where property resilience requirements and aging infrastructure support consistent growth patterns.
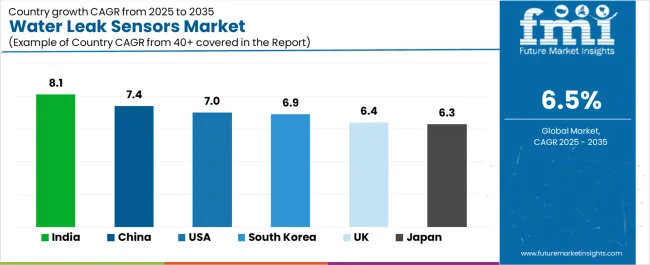
| Country/Region | CAGR (2025-2035) |
|---|---|
| India | 8.1% |
| China | 7.4% |
| United States | 7.0% |
| South Korea | 6.9% |
| United Kingdom | 6.4% |
| Japan | 6.3% |
Regional synthesis reveals Asia Pacific markets leading adoption through rapid urbanization and data center construction, while North American countries maintain robust growth supported by insurance industry partnerships and smart home penetration. European markets show steady expansion driven by green building directives and municipal leak reduction programs.
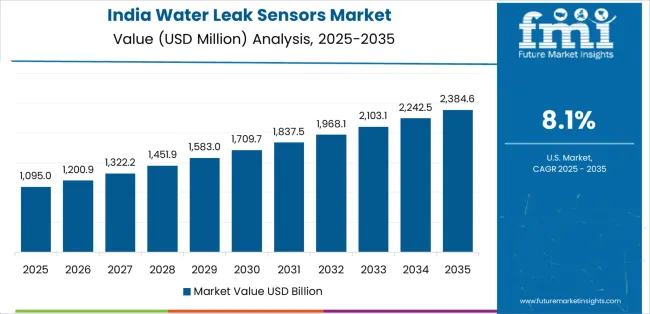
India leads growth momentum with an 8.1% CAGR, driven by rapid urban housing development, expanding data center infrastructure, and building code modernization across metropolitan areas including Delhi NCR, Mumbai, Bangalore, Hyderabad, and Pune. Government Smart Cities Mission programs and water efficiency mandates drive sensor adoption in new residential and commercial construction, while growing middle-class homeownership creates retrofit opportunities. Data center expansion supporting digital economy growth requires comprehensive leak detection for cooling infrastructure and electrical protection, while expanding smart home retail through e-commerce and electronics chains improves product accessibility.
The convergence of urban construction boom requiring water efficiency compliance, insurance industry development introducing claims prevention programs, and smart home technology awareness positions India as a key growth market for leak sensors. Real estate developers in premium housing segments incorporate leak detection as standard amenity, while commercial property managers adopt sensors for tenant protection and facility maintenance optimization addressing water scarcity and infrastructure reliability challenges.
Performance Metrics:
The Chinese market emphasizes extensive smart city pilot programs with documented adoption effectiveness in non-revenue water reduction and multi-family construction through integration with digital infrastructure and IoT platforms. The country leverages domestic manufacturing scale and construction volume to maintain strong market presence at 7.4% CAGR. Major cities including Shanghai, Beijing, Shenzhen, Guangzhou, and Chengdu showcase smart water management installations where leak sensors integrate with comprehensive municipal monitoring systems and residential property management platforms to optimize water conservation and infrastructure maintenance. Chinese property developers prioritize smart building features, integrated monitoring systems, and competitive pricing that create demand for domestically produced sensors meeting national construction standards. The market benefits from government water conservation initiatives, smart city development programs, and real estate digitalization that emphasize sensor adoption supporting resource efficiency objectives.
Municipal water utilities implement smart metering and leak detection programs reducing non-revenue water losses in aging distribution infrastructure. Multi-family residential construction integrates centralized monitoring systems with individual unit sensors enabling property management oversight and maintenance optimization.
Market Intelligence Brief:
The USA market demonstrates sophisticated adoption with documented effectiveness in insurer incentive programs, smart home penetration, and multi-family code compliance through integration with property insurance and home automation ecosystems at 7.0% CAGR. American homeowners benefit from insurance company partnerships offering premium discounts, free sensor programs, and claims prevention incentives that reduce water damage insurance costs averaging 5-15% annually. Smart home platform maturity including Amazon Alexa, Google Home, and Apple HomeKit creates seamless sensor integration with existing home automation infrastructure. Multi-family building codes in states including California, Washington, and Florida mandate leak detection in new construction and renovations addressing water conservation and tenant protection requirements.
Property insurance carriers including State Farm, Liberty Mutual, and USAA offer sensor subsidy programs and premium discounts for policyholders installing whole-home monitoring systems. Smart home adoption exceeding 30% household penetration creates substantial installed base for sensor integration and ecosystem expansion.
Strategic Market Indicators:
South Korea demonstrates advanced adoption at 6.9% CAGR characterized by Digital New Deal IoT deployments, smart apartment platform integration, and electronics manufacturing facility requirements that emphasize connectivity and automation. The Korean market focuses on comprehensive smart home infrastructure in new residential developments where leak sensors integrate with building-wide automation systems, energy management platforms, and resident mobile applications. Smart apartment complexes from major developers including Samsung C&T and Hyundai Engineering incorporate centralized leak monitoring with individual unit sensors enabling property management oversight and maintenance optimization. Electronics manufacturing and semiconductor fabrication facilities require stringent cleanroom protection with comprehensive leak detection for process water systems and facility infrastructure.
Government Digital New Deal initiatives supporting IoT infrastructure deployment and smart city development accelerate sensor adoption in residential and commercial applications. Technology-forward consumer base drives premium smart home product adoption including whole-home monitoring systems with AI-powered analytics.
Performance Metrics:
The UK market focuses on Future Homes Standard implementation with documented effectiveness in build-to-rent developments, data centers, and insurer partnerships at 6.4% CAGR. British housing policy emphasizes water efficiency in new construction through updated building regulations requiring water consumption monitoring and leak detection in residential developments. Build-to-rent sector growth creates institutional property management demand for centralized leak monitoring protecting landlord assets and tenant satisfaction. Data center expansion supporting digital economy requires comprehensive leak detection for cooling infrastructure and electrical systems ensuring operational continuity.
Future Homes Standard regulations effective 2025 establish baseline water efficiency requirements including leak detection provisions for new residential construction. Insurance industry partnerships with major providers offering sensor subsidy programs and premium discounts accelerate residential retrofit adoption.
Strategic Development Indicators:
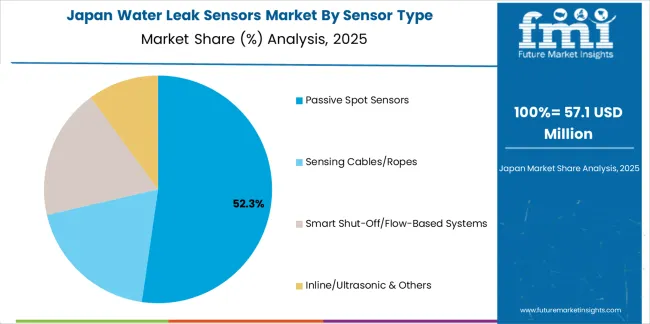
Japan demonstrates specialized market presence at 6.3% CAGR through seismic resilience requirements, senior living facility deployments, and transport infrastructure protection that emphasize reliability and automated monitoring. The Japanese market focuses on earthquake preparedness where leak sensors complement seismic shutoff valves protecting properties from water damage following infrastructure disruption. Senior living facilities and assisted housing incorporate leak sensors with remote monitoring enabling caregiver oversight and resident safety assurance. Metropolitan transport infrastructure including subway systems and underground facilities require comprehensive leak detection protecting electrical systems and structural integrity.
Government disaster preparedness programs and building resilience initiatives support sensor adoption in residential and commercial applications. Aging population demographics drive senior housing development with integrated monitoring systems including leak detection for safety and property protection.
Market Development Factors:
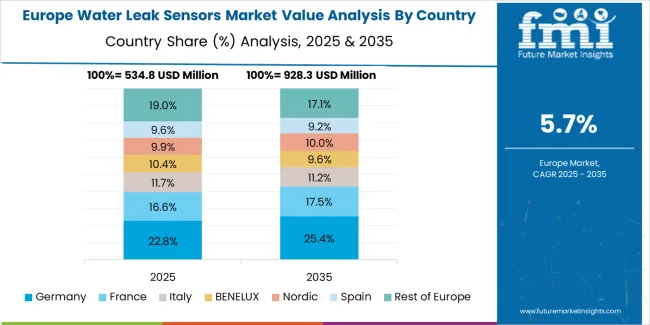
The water leak sensors market in Europe is projected to grow from USD 0.7 billion in 2025 to USD 1.3 billion by 2035, registering a CAGR of approximately 6.6% over the forecast period. Western Europe accounts for 49.0% of European water leak sensor revenues in 2025, led by Germany with 11.6% share supported by energy efficiency retrofits and commercial building management system integration, United Kingdom with 10.8% share driven by Future Homes Standard and build-to-rent sector adoption, France with 9.5% share reflecting green building initiatives and residential retrofit programs, Italy with 7.9% share addressing aging infrastructure and hospitality property protection, and Netherlands with 5.0% share emphasizing water management leadership and smart building deployment.
Northern Europe including Nordic and Benelux countries (excluding Netherlands) contributes 18.2% in 2025 with high adoption rates in green buildings, district energy facilities, and comprehensive building automation reflecting advanced sustainability standards and technology integration. Southern Europe represents 16.7% share driven by hospitality sector retrofits, tourism property protection, and municipal water network upgrades addressing seasonal demand and infrastructure modernization. Eastern Europe holds 16.1% share supported by EU-funded infrastructure improvement programs, new construction in growth markets, and building standards harmonization driving adoption in Poland, Czech Republic, and Baltic states.
Japan demonstrates advanced market development characterized by seismic resilience integration, senior living facility deployments, and infrastructure protection requirements that emphasize automated monitoring and system reliability. The Japanese market focuses on earthquake preparedness infrastructure where leak sensors complement seismic gas and water shutoff systems providing comprehensive property protection following infrastructure disruption from seismic events. Equipment procurement emphasizes manufacturing quality, long-term reliability, and integration with building automation systems that align with Japanese construction standards and technology expectations. The market benefits from domestic electronics manufacturers including Fujitsu and Mitsubishi Electric maintaining sensor product lines and comprehensive service networks, while international smart home brands adapt products for Japanese market requirements including local connectivity protocols and language support.
Market Development Factors:
South Korea demonstrates sophisticated market characteristics focused on smart apartment platforms, Digital New Deal IoT deployments, and electronics manufacturing facility requirements reflecting technology leadership and comprehensive building automation. The Korean market emphasizes integrated smart home systems in new residential developments where leak sensors connect to building-wide platforms enabling property management oversight, resident mobile access, and predictive maintenance analytics. Korean property developers and technology companies prioritize advanced connectivity, cloud platforms, and mobile application excellence that reflect the country's leadership in consumer electronics and digital infrastructure. The market benefits from government smart city initiatives, IoT infrastructure investment, and high-technology manufacturing sectors requiring stringent facility protection and process continuity assurance.
Strategic Development Indicators:
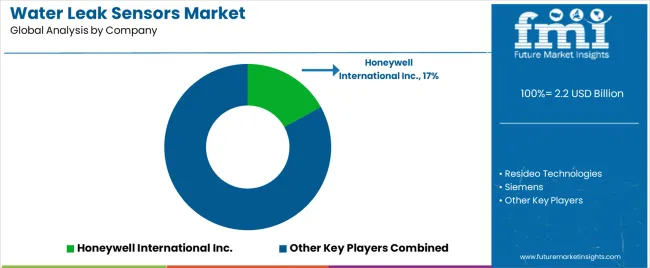
The Water Leak Sensors Market is expanding as residential, commercial, and industrial buildings adopt smarter water management to prevent costly damage and reduce wastage. Increasing insurance claims from flooding, aging plumbing infrastructure in urban areas, and rising awareness of water conservation are major forces driving adoption. Leak sensors are now being integrated with Wi-Fi, smart home hubs, and building automation systems, allowing users to receive real-time alerts and trigger automatic shutoff valves when leaks are detected.
Honeywell International Inc., Resideo Technologies, Siemens, and Johnson Controls offer building-grade monitoring solutions that integrate leak detection into broader HVAC, security, and facility management platforms. Their systems often support multi-zone coverage, making them suitable for large commercial buildings and smart residential developments.
Consumer-focused brands like Moen (Flo by Moen), Phyn, and LeakSmart (Waxman Industries) lead in connected home leak prevention, combining flow analytics with auto-shutoff capabilities to stop leaks before major damage occurs. D-Link Corporation and YoLink (YoSmart) provide cost-accessible, app-controlled sensors that target mass-market smart home adoption.
At the industrial and commercial end, WINT Water Intelligence focuses on AI-based leak detection and real-time usage analytics for hotels, campuses, data centers, and manufacturing facilities. As sustainability regulations and insurance incentives continue to strengthen, leak detection systems are becoming a standard component in proactive water management strategies.
| Item | Value |
|---|---|
| Quantitative Units | USD 2.2 billion |
| Sensor Type | Passive Spot Sensors, Sensing Cables/Ropes, Smart Shut-Off/Flow-Based Systems, Inline/Ultrasonic & Others |
| Connectivity | Wi-Fi, Zigbee/Thread, LoRa/LPWAN, Cellular/NB-IoT, Wired/BMS Bus |
| End Use | Residential, Commercial Real Estate, Industrial, Municipal/Utility Networks |
| Modality | Standalone Battery Sensors, BMS-Integrated Gateways, Valve-Integrated, Portable/Temporary Deployment Kits |
| Sales Channel | Retail & E-Commerce, Professional Installers, OEM/BMS & Construction Spec, Insurance-Led Programs |
| Regions Covered | North America, Europe, Asia Pacific, Latin America, Africa, Middle East |
| Countries Covered | India, China, United States, South Korea, European Union, United Kingdom, Japan, and 25+ additional countries |
| Key Companies Profiled | Honeywell International Inc., Resideo Technologies, Siemens, Johnson Controls, Moen (Flo by Moen), Phyn, LeakSmart (Waxman Industries), D-Link Corporation, YoLink (YoSmart), and WINT Water Intelligence |
| Additional Attributes | Dollar sales by sensor type, connectivity, end use, modality, and sales channel categories, regional adoption trends across North America, Europe, and Asia Pacific, competitive landscape with building technology manufacturers and IoT platform providers, property owner preferences for detection reliability and smart home integration, compatibility with insurance programs and building management systems, innovations in AI-powered prediction and automated shut-off capabilities, and development of affordable solutions with enhanced property protection and water conservation optimization capabilities. |
The global water leak sensors market is estimated to be valued at USD 2.2 billion in 2025.
The market size for the water leak sensors market is projected to reach USD 4.1 billion by 2035.
The water leak sensors market is expected to grow at a 6.5% CAGR between 2025 and 2035.
The key product types in water leak sensors market are passive spot sensors, sensing cables/ropes, smart shut-off/flow-based systems and inline/ultrasonic & others.
In terms of end use, residential segment to command 63.8% share in the water leak sensors market in 2025.


Our Research Products

The "Full Research Suite" delivers actionable market intel, deep dives on markets or technologies, so clients act faster, cut risk, and unlock growth.

The Leaderboard benchmarks and ranks top vendors, classifying them as Established Leaders, Leading Challengers, or Disruptors & Challengers.

Locates where complements amplify value and substitutes erode it, forecasting net impact by horizon

We deliver granular, decision-grade intel: market sizing, 5-year forecasts, pricing, adoption, usage, revenue, and operational KPIs—plus competitor tracking, regulation, and value chains—across 60 countries broadly.

Spot the shifts before they hit your P&L. We track inflection points, adoption curves, pricing moves, and ecosystem plays to show where demand is heading, why it is changing, and what to do next across high-growth markets and disruptive tech

Real-time reads of user behavior. We track shifting priorities, perceptions of today’s and next-gen services, and provider experience, then pace how fast tech moves from trial to adoption, blending buyer, consumer, and channel inputs with social signals (#WhySwitch, #UX).

Partner with our analyst team to build a custom report designed around your business priorities. From analysing market trends to assessing competitors or crafting bespoke datasets, we tailor insights to your needs.
Supplier Intelligence
Discovery & Profiling
Capacity & Footprint
Performance & Risk
Compliance & Governance
Commercial Readiness
Who Supplies Whom
Scorecards & Shortlists
Playbooks & Docs
Category Intelligence
Definition & Scope
Demand & Use Cases
Cost Drivers
Market Structure
Supply Chain Map
Trade & Policy
Operating Norms
Deliverables
Buyer Intelligence
Account Basics
Spend & Scope
Procurement Model
Vendor Requirements
Terms & Policies
Entry Strategy
Pain Points & Triggers
Outputs
Pricing Analysis
Benchmarks
Trends
Should-Cost
Indexation
Landed Cost
Commercial Terms
Deliverables
Brand Analysis
Positioning & Value Prop
Share & Presence
Customer Evidence
Go-to-Market
Digital & Reputation
Compliance & Trust
KPIs & Gaps
Outputs
Full Research Suite comprises of:
Market outlook & trends analysis
Interviews & case studies
Strategic recommendations
Vendor profiles & capabilities analysis
5-year forecasts
8 regions and 60+ country-level data splits
Market segment data splits
12 months of continuous data updates
DELIVERED AS:
PDF EXCEL ONLINE
Water Leak Detection System for Server Rooms and Data Centers Market Size and Share Forecast Outlook 2025 to 2035
Water Leakage Tester Market Size and Share Forecast Outlook 2025 to 2035
Roof Water Leak Detector Market Size and Share Forecast Outlook 2025 to 2035
Smart Home Water Sensors & Controllers Market Trends & Forecast 2025 to 2035
Automotive Hydrogen Leak Detection Sensors Market Size and Share Forecast Outlook 2025 to 2035
Water Vapor Permeability Analyzers Market Size and Share Forecast Outlook 2025 to 2035
Water and Waste Water Treatment Chemical Market Size and Share Forecast Outlook 2025 to 2035
Water-cooled Walk-in Temperature & Humidity Chamber Market Size and Share Forecast Outlook 2025 to 2035
Waterless Bathing Solution Market Size and Share Forecast Outlook 2025 to 2035
Water Treatment System Market Size and Share Forecast Outlook 2025 to 2035
Waterborne UV Curable Resin Market Size and Share Forecast Outlook 2025 to 2035
Water Treatment Chemical Market Size and Share Forecast Outlook 2025 to 2035
Water Adventure Tourism Market Forecast and Outlook 2025 to 2035
Water Packaging Market Forecast and Outlook 2025 to 2035
Water Soluble Bag Market Size and Share Forecast Outlook 2025 to 2035
Water-soluble Packaging Market Size and Share Forecast Outlook 2025 to 2035
Leak Detection Equipment Market Size and Share Forecast Outlook 2025 to 2035
Water and Wastewater Treatment Equipment Market Size and Share Forecast Outlook 2025 to 2035
Water Treatment Market Size and Share Forecast Outlook 2025 to 2035
Water Underfloor Heating Thermostat Market Size and Share Forecast Outlook 2025 to 2035

Thank you!
You will receive an email from our Business Development Manager. Please be sure to check your SPAM/JUNK folder too.
Chat With
MaRIA