Watertight Doors Market
An Analysis of the Watertight Doors Market by Hinged and Sliding Doors
In its latest study, FMI provides in-depth analysis of prominent trends driving growth of the Watertight Doors Market. Read on to Know More.
Watertight Doors Market Snapshot (2023 to 2033)
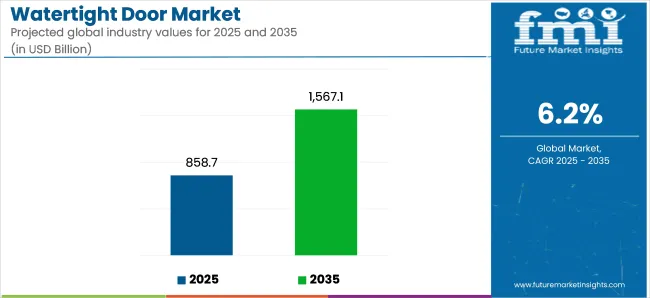
The global watertight doors market is expected to attain a valuation of US$ 380 million in 2023 and is projected to reach US$ 730 million by 2033, projected to increase at a CAGR of 6.7% during the forecast period.
The demand for watertight doors is expected to be driven by several factors, including the increased demand for offshore substations. The growing importance and criticality of marine surveillance through maritime naval patrol vessels also contribute to the high demand for watertight doors. Furthermore, buyers' inclination towards advanced doors and hatches further accelerates the market's growth.
Increased investment in the re-development of blast-proof and watertight doors, aimed at delivering high-quality products to consumers, coupled with the rising demand for marine doors and hatches equipped with hydraulic and pneumatic operation, significantly impacts the market.
The market is positively influenced by ongoing commercialization, increasing trade practices among economies, growing awareness of crew member safety in ships and vessels, and the rise in offshore renewable energy trends. Additionally, the adoption of advanced technologies for manufacturing carbon-friendly and fuel-efficient ships presents profitable opportunities for market players in the forecast period.
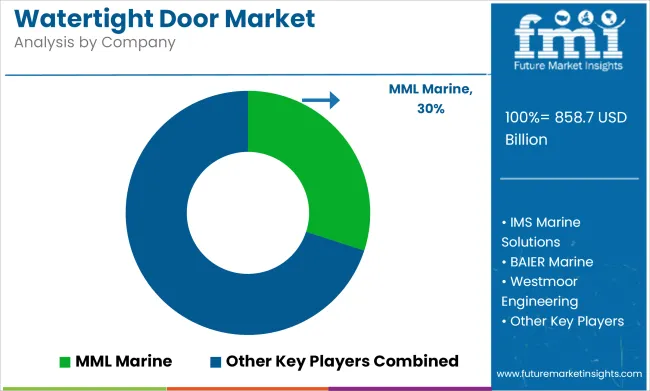
Amid soaring competition, the top five players comprising, MML Marine Limited, REMONTOWA HYDRAULIC SYSTEMS Sp. z o.o., AdvanTec Marine, Westmoor Engineering Ltd., SeaNetGroup are expected to account for over 10% of watertight doors market in 2023.
Report Attribute | Details |
---|---|
Expected Market Value (2023) | US$ 380 million |
Anticipated Forecast Value (2033) | US$ 730 million |
Projected Growth Rate (2023 to 2033) | CAGR of 6.7% |
Don't pay for what you don't need
Customize your report by selecting specific countries or regions and save 30%!
2018 to 2022 Watertight doors Demand Analysis vs. Forecast 2023 to 2033
The watertight doors market was worth US$ 274.89 million in 2018. It accumulated a market value of US$ 325 million in 2022 while growing at a CAGR of 4.2% during the historical period.
The watertight doors market is expected to grow at a CAGR of nearly 6.7% during the forecast period 2023-2033. Increasing demand in offshore substations, growing inclination of buyers towards newly advanced doors and hatches will stimulate growth of the watertight doors market.
Investment towards the re-development of blast proof and watertight doors to offer consumers with high quality products will drive watertight door sales in the coming years. As per FMI, the market will register increasing demand for marine doors and hatches equipped with hydraulic and pneumatic operation.
Steered by dynamic consumer preference, market players in the market are focusing on innovations and development through gaining affiliations and partnerships. For instance, in 2018, IMTRA, a leading supplier, producer and importer of quality marine products, announced its affiliation with Libra, a Norwegian-based producer of hatches, vessel doors and storage. IMTRA will assist as an agent for Libra-brand products all across the U.S. The collaboration will foster lucrative growth opportunities for Libra by aggrandizing market share for hatches, doors and storage solutions.
In 2019, AdvanTec USA Manufacturing, announced the acquisition of USA Sliding Doors Inc. The acquisition of Sliding Doors aligns with the developmental strategy concentrated on AdvanTec’s aim of being exhibited as a full-scale marine solutions provider and serve end consumers to the best of their capabilities.
Comparative View of Adjacent Markets
Watertight Doors Market:
Attributes | Watertight Doors Market |
---|---|
CAGR (2023 to 2033) | 6.7% |
Market Value (2033) | US$ 730 million |
Growth Factor | Increasing demand for offshore substations are expected to drive market growth during the forecast period. |
Opportunity | Innovations in new technology to integrate more and more automated functions in the door locking and unlocking systems is expected to generate new opportunities for market growth. |
Locomotive Doors Market:
Attributes | Locomotive Doors Market |
---|---|
CAGR (2023 to 2033) | 5% |
Market Value (2033) | US$ 519 million |
Growth Factor | Increasing train passenger traffic and ensuing railway connectivity projects are expected to drive market growth. |
Opportunity | The expansion of railway networks and a rise of rolling stock such as light rail cars is anticipated to offer new opportunities for market expansion. |
Yacht Shell Doors Market:
Attributes | Yacht Shell Doors Market |
---|---|
CAGR (2023 to 2033) | 6.5% |
Market Value (2033) | US$ 555 million |
Growth Factor | Growing inclination of customers towards new advanced hatches and doors is expected to fuel market growth. |
Opportunity | Increasing number of high-net-worth individuals (HNWI) and rising inclination towards recreational & leisure activities, owing to rapids expansion of the tourism industry is expected to provide opportunities for market growth. |
High Demand for Offshore Vessels and Construction of New Ships to Propel Demand
Watertight doors minimize flooding during the grounding or collision of a ship or when a ship undergoes structural damage and thus, minimize the risk of sinking as in the event of severe structural damage, the ship might be flooded with water.
Watertight doors are crucial for all marine vessels including commercial, yachts, cruiser, coastal military patrol vessels and combat ships as they restrict the entry of water. Increasing significance and criticality of marine surveillance through maritime naval patrol vessels has positively impacted demand for watertight doors.
Growth of Coastal and Marine Tourism Driving Watertight Doors Sales
Coastal tourism can be defined land and sea based travel for pleasure taking place along the coast and within proximity to the sea. Marine tourism is similar to coastal tourism, but is more focused on sea-based activities. The tourism industry, from a global perspective, has witnessed healthy growth post the recession era, recording more than 1 Million tourists for the first time in 2012 and growing at around 4% annually.
This has positively impacted coastal and marine tourism as well with Europe pegged as the worlds’ most visited tourist region. The number of tourists arriving in Europe has been growing 6% annually, according to estimates published by WTO, with a large percentage of tourists (an average of 200 Million visitors yearly) concentrating on the Mediterranean Coastal region.
This trend of tourists taking part in marine tourism has led to an increase in the sales of marine vessels such as farriers, boats and cruise ships and thus, has been indirectly contributing to the sales of watertight doors. According to a study published by E.C. 2011, more than 60% of tourists prefer to visit coastal areas over inner lands.
Get the data you need at a Fraction of the cost
Personalize your report by choosing insights you need
and save 40%!
Increasing Exploration & Production of Natural Gas to Create Sales Opportunities
Global natural gas production grew by approximately 2.2% in 2015 as compared to the preceding year, whereas the consumption of natural gas increased by 1.7% in the same time frame. Countries such as Australia, Qatar and Norway have been contributing to the increasing export of natural gas significantly.
The demand for LNG is expected to witness significant growth over the forecast period. Global trade of LNG was pegged at around 244.8 MT in 2015, with an increase of nearly 4.7 MT as compared to 2014. Numerous new liquefaction and regasification terminals that will accommodate processing facilities and bulk storing are under construction in Asia Pacific, Europe, and the Americas and are expected to start operating during the forecast period.
According to reports, over 410 liquid bulk carrier fleets were active in 2015, which could meet over 30% of the global LNG demand. Also, around 416 ships were reported under construction, which are estimated to join the supply chain during the forecast period. The new construction of ships is expected to positively impact the sales of watertight doors during the forecast period.
Increasing emphasis on the use of natural gas by large economies as well as developing nations in Southeast Asia and increasing exploration activities are expected to boost the demand for offshore vessels, which in turn is estimated to propel the demand for services in the SEA market throughout the forecast period.
Asia Pacific to Remain a Prominent Region in Watertight Doors Market
The Asia Pacific watertight doors market accounts for a major value share and the region is projected to remain prominent in the global watertight doors market over the forecast period.
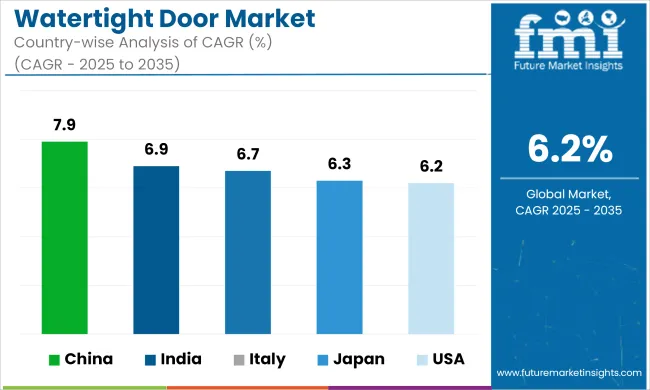
The China watertight doors market is expected to account for a 35% market share in the Asia Pacific watertight doors market, in terms of value, by the end of 2023, projecting a CAGR of 6.6% between 2023 and 2033. The watertight doors market in South Korea is expected to represent an incremental opportunity of US$ 55 million between 2023 and 2033.
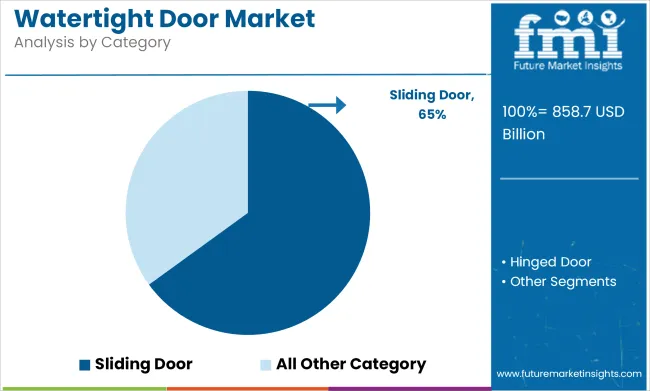
On the basis of product type, the watertight doors market has been segmented into sliding watertight doors and hinged watertight doors. Hinged watertight doors are expected to account for a high share of the global watertight doors market during the forecast period.
North America to Account for a Significant Market Share in Watertight Doors Market
The demand for watertight doors in North America is expected to grow with a CAGR of 6.5% during the forecast period. The region is expected to accumulate over 40% market share by end of the forecast period.
The demand for watertight doors in the United States is projected to grow with a CAGR of 6.7% during the forecast period. The marine and offshore industry, including shipbuilding and offshore oil and gas exploration, requires water tight doors for enhanced safety and protection. The growing activities in this industry contribute to the regional market growth.
The implementation of strict safety regulations and standards by regulatory bodies in North America is expected to drive the demand for water tight doors. These regulations aim to ensure the safety of personnel and assets in marine and offshore operations. Advancements in door manufacturing technologies, such as improved sealing mechanisms and materials, enhance the performance and durability of watertight doors. These technological advancements attract customers and drive market growth.
Watertight doors play a crucial role in maintaining the energy efficiency of vessels and offshore structures by preventing water ingress. The increasing focus on energy efficiency and sustainability in the marine industry further boosts the demand for watertight doors in the region. The expansion of the oil and gas industry in North America, especially offshore drilling activities, drives the demand for watertight doors. These doors are essential for maintaining the integrity of offshore platforms and ensuring safety during operations.
Category-wise Insights
Which Product Type is Expected to Generate High Demand?
Sliding Water Doors Driving Growth with a Leading Share
Sliding watertight doors held the leading share in 2022 and are expected to grow at a significant CAGR of 7.1% during the forecast period. The growth is attributed to growing adoption of sliding watertight doors in emerging economies in Asia Pacific region.
Start-ups in the Watertight Doors Market
Start-ups are crucial in identifying growth opportunities, including the watertight doors market. They effectively translate inputs to outputs and adapt to market uncertainties, contributing to the industry's expansion. Some start-ups are expected to drive growth in the watertight doors market.
- Go-Tec, a new company under Navim Group, specializes in the production, sale, maintenance, and after-sales assistance of watertight doors, splash doors, cardecks, rolling doors, ramps (internal and external), hatches, and various special projects. It focuses on designing and manufacturing marine equipment for cruise ships, ferries, naval ships, mega yachts, research vessels, and offshore structures.
- Door Guard is a leading provider of smart lock systems utilizing cutting-edge technology. Their innovative solution allows users to control their doors remotely without the need for internet or WiFi connectivity. Additionally, Door Guard offers the TTLOCK application, an open platform smart lock application that enables convenient control of the locks.
- Winel specializes in providing an extensive range of doors, hatches, platforms, venting systems, and specialized engineering services. Their unique strength lies in offering clients a comprehensive in-house service package that includes design, engineering, manufacturing, assembly, and after-sales support.
Competitive Landscape
The market for watertight doors is highly competitive, with numerous prominent industry players making substantial investments in increasing their manufacturing capabilities. The key industry players MML Marine Limited, IMS Groups, REMONTOWA HYDRAULIC SYSTEMS Sp. z o.o., Baier Marine Company Inc. Westmoor Engineering Ltd., Ocean Group, Van Dam B.V., AdvanTec Marine, SeaNet SA and Winel B.V.
Some key developments in the watertight doors market are:
- In 2021, Survitec, a global safety solutions provider, collaborated with Viking Life-Saving Equipment to offer a comprehensive range of watertight doors and other safety equipment for the marine industry.
- In 2020, Van Dam, a Dutch company specializing in shipbuilding and marine equipment, launched a new line of watertight doors featuring advanced sealing technology and improved durability.
- In 2019, AdvanTec USA Manufacturing successfully acquired USA Sliding Doors Inc. This acquisition aligns with AdvanTec's strategic goal of becoming a comprehensive marine solutions provider and delivering the best possible service to end consumers.
- In 2018, IMTRA partnered with Libra, a Norwegian producer of hatches, vessel doors, and storage solutions. IMTRA acts as the agent for Libra-brand products across the United States, creating growth opportunities and expanding market share in the hatches, doors, and storage solutions segment.
Report Scope
Report Attribute | Details |
---|---|
Market Value in 2023 | US$ 380 million |
Market Value in 2033 | US$ 730 million |
Growth Rate | CAGR of 6.7% from 2023 to 2033 |
Base Year for Estimation | 2022 |
Historical Data | 2018 to 2022 |
Forecast Period | 2023 to 2033 |
Quantitative Units | Revenue in US$ million and CAGR from 2023 to 2033 |
Report Coverage | Revenue Forecast, Volume Forecast, Company Ranking, Competitive Landscape, Growth Factors, Trends, and Pricing Analysis |
Segments Covered |
|
Regions Covered |
|
Key Countries Profiled |
|
Key Companies Profiled |
|
Customization & Pricing | Available Upon Request |
Key Segments Profiled in the Watertight doors Market Industry Survey
By Type:
- Hinged
- Sliding
By Source:
- Hydraulic
- Electric
By Type of Vessel:
- Commercial
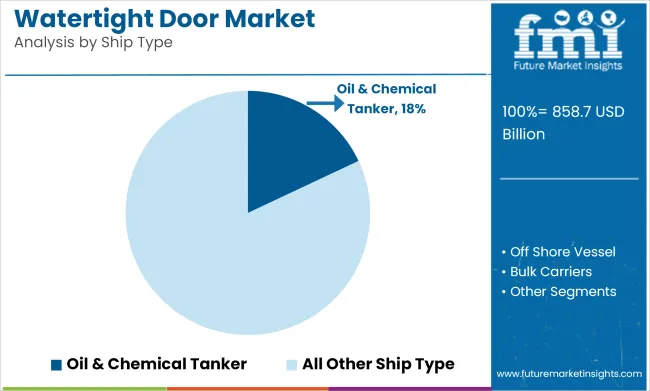
- Oil & Chemical Tankers
- Bulk Carriers
- General Cargo
- Container Ships
- Gas Carriers
- Offshore Vessels
- Passenger Ships & Ferries
- Mega Yachts and Other Vessels
- Military
By Region:
- North America
- Latin America
- Europe
- Asia Pacific
- Middle East and Africa
Frequently Asked Questions
What was the Market value in 2022?
The market was valued at US$ 325 million in 2022.
What is the Current Market Valuation?
The market is estimated to secure a valuation of US$ 380 million in 2023.
What is the Growth Forecast for the Watertight Doors Market?
The market is forecast to register a CAGR of 6.7% through 2033.
Which Product Type is expected to generate High Demand?
Sliding water doors to drive growth with a leading share.
What is North America's Expected Share from 2023 to 2033?
North America is estimated to accumulate over 40% market share from 2023 to 2033.
Table of Content
1. Executive Summary 1.1. Global Market Outlook 1.2. Demand-side Trends 1.3. Supply-side Trends 1.4. Technology Roadmap Analysis 1.5. Analysis and Recommendations 2. Market Overview 2.1. Market Coverage / Taxonomy 2.2. Market Definition / Scope / Limitations 3. Market Background 3.1. Market Dynamics 3.1.1. Drivers 3.1.2. Restraints 3.1.3. Opportunity 3.1.4. Trends 3.2. Scenario Forecast 3.2.1. Demand in Optimistic Scenario 3.2.2. Demand in Likely Scenario 3.2.3. Demand in Conservative Scenario 3.3. Opportunity Map Analysis 3.4. Product Life Cycle Analysis 3.5. Supply Chain Analysis 3.5.1. Supply Side Participants and their Roles 3.5.1.1. Producers 3.5.1.2. Mid-Level Participants (Traders/ Agents/ Brokers) 3.5.1.3. Wholesalers and Distributors 3.5.2. Value Added and Value Created at Node in the Supply Chain 3.5.3. List of Raw Material Suppliers 3.5.4. List of Existing and Potential Buyers 3.6. Investment Feasibility Matrix 3.7. Value Chain Analysis 3.7.1. Profit Margin Analysis 3.7.2. Wholesalers and Distributors 3.7.3. Retailers 3.8. PESTLE and Porter’s Analysis 3.9. Regulatory Landscape 3.9.1. By Key Regions 3.9.2. By Key Countries 3.10. Regional Parent Market Outlook 3.11. Production and Consumption Statistics 3.12. Import and Export Statistics 4. Global Market Analysis 2018 to 2022 and Forecast, 2023 to 2033 4.1. Historical Market Size Value (US$ Million) & Volume (Units) Analysis, 2018 to 2022 4.2. Current and Future Market Size Value (US$ Million) & Volume (Units) Projections, 2023 to 2033 4.2.1. Y-o-Y Growth Trend Analysis 4.2.2. Absolute $ Opportunity Analysis 5. Global Market Analysis 2018 to 2022 and Forecast 2023 to 2033, By Type 5.1. Introduction / Key Findings 5.2. Historical Market Size Value (US$ Million) & Volume (Units) Analysis By Type, 2018 to 2022 5.3. Current and Future Market Size Value (US$ Million) & Volume (Units) Analysis and Forecast By Type, 2023 to 2033 5.3.1. Hinged 5.3.2. Sliding 5.4. Y-o-Y Growth Trend Analysis By Type, 2018 to 2022 5.5. Absolute $ Opportunity Analysis By Type, 2023 to 2033 6. Global Market Analysis 2018 to 2022 and Forecast 2023 to 2033, By Source 6.1. Introduction / Key Findings 6.2. Historical Market Size Value (US$ Million) & Volume (Units) Analysis By Source, 2018 to 2022 6.3. Current and Future Market Size Value (US$ Million) & Volume (Units) Analysis and Forecast By Source, 2023 to 2033 6.3.1. Hydraulic 6.3.2. Electric 6.4. Y-o-Y Growth Trend Analysis By Source, 2018 to 2022 6.5. Absolute $ Opportunity Analysis By Source, 2023 to 2033 7. Global Market Analysis 2018 to 2022 and Forecast 2023 to 2033, By Type of Vessel 7.1. Introduction / Key Findings 7.2. Historical Market Size Value (US$ Million) & Volume (Units) Analysis By Type of Vessel, 2018 to 2022 7.3. Current and Future Market Size Value (US$ Million) & Volume (Units) Analysis and Forecast By Type of Vessel, 2023 to 2033 7.3.1. Commercial 7.3.2. Oil & Chemical Tankers 7.3.3. Bulk Carriers 7.3.4. General Cargo 7.3.5. Container Ships 7.3.6. Gas Carriers 7.3.7. Offshore Vessels 7.3.8. Passenger Ships & Ferries 7.3.9. Mega Yachts and Other Vessels 7.3.10. Military 7.4. Y-o-Y Growth Trend Analysis By Type of Vessel, 2018 to 2022 7.5. Absolute $ Opportunity Analysis By Type of Vessel, 2023 to 2033 8. Global Market Analysis 2018 to 2022 and Forecast 2023 to 2033, By Region 8.1. Introduction 8.2. Historical Market Size Value (US$ Million) & Volume (Units) Analysis By Region, 2018 to 2022 8.3. Current Market Size Value (US$ Million) & Volume (Units) Analysis and Forecast By Region, 2023 to 2033 8.3.1. North America 8.3.2. Latin America 8.3.3. Europe 8.3.4. Asia Pacific 8.3.5. MEA 8.4. Market Attractiveness Analysis By Region 9. North America Market Analysis 2018 to 2022 and Forecast 2023 to 2033, By Country 9.1. Historical Market Size Value (US$ Million) & Volume (Units) Trend Analysis By Market Taxonomy, 2018 to 2022 9.2. Market Size Value (US$ Million) & Volume (Units) Forecast By Market Taxonomy, 2023 to 2033 9.2.1. By Country 9.2.1.1. USA 9.2.1.2. Canada 9.2.2. By Type 9.2.3. By Source 9.2.4. By Type of Vessel 9.3. Market Attractiveness Analysis 9.3.1. By Country 9.3.2. By Type 9.3.3. By Source 9.3.4. By Type of Vessel 9.4. Key Takeaways 10. Latin America Market Analysis 2018 to 2022 and Forecast 2023 to 2033, By Country 10.1. Historical Market Size Value (US$ Million) & Volume (Units) Trend Analysis By Market Taxonomy, 2018 to 2022 10.2. Market Size Value (US$ Million) & Volume (Units) Forecast By Market Taxonomy, 2023 to 2033 10.2.1. By Country 10.2.1.1. Brazil 10.2.1.2. Mexico 10.2.1.3. Rest of Latin America 10.2.2. By Type 10.2.3. By Source 10.2.4. By Type of Vessel 10.3. Market Attractiveness Analysis 10.3.1. By Country 10.3.2. By Type 10.3.3. By Source 10.3.4. By Type of Vessel 10.4. Key Takeaways 11. Europe Market Analysis 2018 to 2022 and Forecast 2023 to 2033, By Country 11.1. Historical Market Size Value (US$ Million) & Volume (Units) Trend Analysis By Market Taxonomy, 2018 to 2022 11.2. Market Size Value (US$ Million) & Volume (Units) Forecast By Market Taxonomy, 2023 to 2033 11.2.1. By Country 11.2.1.1. Germany 11.2.1.2. UK 11.2.1.3. France 11.2.1.4. Spain 11.2.1.5. Italy 11.2.1.6. Rest of Europe 11.2.2. By Type 11.2.3. By Source 11.2.4. By Type of Vessel 11.3. Market Attractiveness Analysis 11.3.1. By Country 11.3.2. By Type 11.3.3. By Source 11.3.4. By Type of Vessel 11.4. Key Takeaways 12. Asia Pacific Market Analysis 2018 to 2022 and Forecast 2023 to 2033, By Country 12.1. Historical Market Size Value (US$ Million) & Volume (Units) Trend Analysis By Market Taxonomy, 2018 to 2022 12.2. Market Size Value (US$ Million) & Volume (Units) Forecast By Market Taxonomy, 2023 to 2033 12.2.1. By Country 12.2.1.1. China 12.2.1.2. Japan 12.2.1.3. South Korea 12.2.1.4. Singapore 12.2.1.5. Thailand 12.2.1.6. Indonesia 12.2.1.7. Australia 12.2.1.8. New Zealand 12.2.1.9. Rest of Asia Pacific 12.2.2. By Type 12.2.3. By Source 12.2.4. By Type of Vessel 12.3. Market Attractiveness Analysis 12.3.1. By Country 12.3.2. By Type 12.3.3. By Source 12.3.4. By Type of Vessel 12.4. Key Takeaways 13. MEA Market Analysis 2018 to 2022 and Forecast 2023 to 2033, By Country 13.1. Historical Market Size Value (US$ Million) & Volume (Units) Trend Analysis By Market Taxonomy, 2018 to 2022 13.2. Market Size Value (US$ Million) & Volume (Units) Forecast By Market Taxonomy, 2023 to 2033 13.2.1. By Country 13.2.1.1. GCC Countries 13.2.1.2. South Africa 13.2.1.3. Israel 13.2.1.4. Rest of MEA 13.2.2. By Type 13.2.3. By Source 13.2.4. By Type of Vessel 13.3. Market Attractiveness Analysis 13.3.1. By Country 13.3.2. By Type 13.3.3. By Source 13.3.4. By Type of Vessel 13.4. Key Takeaways 14. Key Countries Market Analysis 14.1. USA 14.1.1. Pricing Analysis 14.1.2. Market Share Analysis, 2022 14.1.2.1. By Type 14.1.2.2. By Source 14.1.2.3. By Type of Vessel 14.2. Canada 14.2.1. Pricing Analysis 14.2.2. Market Share Analysis, 2022 14.2.2.1. By Type 14.2.2.2. By Source 14.2.2.3. By Type of Vessel 14.3. Brazil 14.3.1. Pricing Analysis 14.3.2. Market Share Analysis, 2022 14.3.2.1. By Type 14.3.2.2. By Source 14.3.2.3. By Type of Vessel 14.4. Mexico 14.4.1. Pricing Analysis 14.4.2. Market Share Analysis, 2022 14.4.2.1. By Type 14.4.2.2. By Source 14.4.2.3. By Type of Vessel 14.5. Germany 14.5.1. Pricing Analysis 14.5.2. Market Share Analysis, 2022 14.5.2.1. By Type 14.5.2.2. By Source 14.5.2.3. By Type of Vessel 14.6. UK 14.6.1. Pricing Analysis 14.6.2. Market Share Analysis, 2022 14.6.2.1. By Type 14.6.2.2. By Source 14.6.2.3. By Type of Vessel 14.7. France 14.7.1. Pricing Analysis 14.7.2. Market Share Analysis, 2022 14.7.2.1. By Type 14.7.2.2. By Source 14.7.2.3. By Type of Vessel 14.8. Spain 14.8.1. Pricing Analysis 14.8.2. Market Share Analysis, 2022 14.8.2.1. By Type 14.8.2.2. By Source 14.8.2.3. By Type of Vessel 14.9. Italy 14.9.1. Pricing Analysis 14.9.2. Market Share Analysis, 2022 14.9.2.1. By Type 14.9.2.2. By Source 14.9.2.3. By Type of Vessel 14.10. China 14.10.1. Pricing Analysis 14.10.2. Market Share Analysis, 2022 14.10.2.1. By Type 14.10.2.2. By Source 14.10.2.3. By Type of Vessel 14.11. Japan 14.11.1. Pricing Analysis 14.11.2. Market Share Analysis, 2022 14.11.2.1. By Type 14.11.2.2. By Source 14.11.2.3. By Type of Vessel 14.12. South Korea 14.12.1. Pricing Analysis 14.12.2. Market Share Analysis, 2022 14.12.2.1. By Type 14.12.2.2. By Source 14.12.2.3. By Type of Vessel 14.13. Singapore 14.13.1. Pricing Analysis 14.13.2. Market Share Analysis, 2022 14.13.2.1. By Type 14.13.2.2. By Source 14.13.2.3. By Type of Vessel 14.14. Thailand 14.14.1. Pricing Analysis 14.14.2. Market Share Analysis, 2022 14.14.2.1. By Type 14.14.2.2. By Source 14.14.2.3. By Type of Vessel 14.15. Indonesia 14.15.1. Pricing Analysis 14.15.2. Market Share Analysis, 2022 14.15.2.1. By Type 14.15.2.2. By Source 14.15.2.3. By Type of Vessel 14.16. Australia 14.16.1. Pricing Analysis 14.16.2. Market Share Analysis, 2022 14.16.2.1. By Type 14.16.2.2. By Source 14.16.2.3. By Type of Vessel 14.17. New Zealand 14.17.1. Pricing Analysis 14.17.2. Market Share Analysis, 2022 14.17.2.1. By Type 14.17.2.2. By Source 14.17.2.3. By Type of Vessel 14.18. GCC Countries 14.18.1. Pricing Analysis 14.18.2. Market Share Analysis, 2022 14.18.2.1. By Type 14.18.2.2. By Source 14.18.2.3. By Type of Vessel 14.19. South Africa 14.19.1. Pricing Analysis 14.19.2. Market Share Analysis, 2022 14.19.2.1. By Type 14.19.2.2. By Source 14.19.2.3. By Type of Vessel 14.20. Israel 14.20.1. Pricing Analysis 14.20.2. Market Share Analysis, 2022 14.20.2.1. By Type 14.20.2.2. By Source 14.20.2.3. By Type of Vessel 15. Market Structure Analysis 15.1. Competition Dashboard 15.2. Competition Benchmarking 15.3. Market Share Analysis of Top Players 15.3.1. By Regional 15.3.2. By Type 15.3.3. By Source 15.3.4. By Type of Vessel 16. Competition Analysis 16.1. Competition Deep Dive 16.1.1. MML Marine Limited 16.1.1.1. Overview 16.1.1.2. Product Portfolio 16.1.1.3. Profitability by Market Segments 16.1.1.4. Sales Footprint 16.1.1.5. Strategy Overview 16.1.1.5.1. Marketing Strategy 16.1.1.5.2. Product Strategy 16.1.1.5.3. Channel Strategy 16.1.2. IMS Groups 16.1.2.1. Overview 16.1.2.2. Product Portfolio 16.1.2.3. Profitability by Market Segments 16.1.2.4. Sales Footprint 16.1.2.5. Strategy Overview 16.1.2.5.1. Marketing Strategy 16.1.2.5.2. Product Strategy 16.1.2.5.3. Channel Strategy 16.1.3. REMONTOWA HYDRAULIC SYSTEMS Sp. z o.o 16.1.3.1. Overview 16.1.3.2. Product Portfolio 16.1.3.3. Profitability by Market Segments 16.1.3.4. Sales Footprint 16.1.3.5. Strategy Overview 16.1.3.5.1. Marketing Strategy 16.1.3.5.2. Product Strategy 16.1.3.5.3. Channel Strategy 16.1.4. Baier Marine Company Inc 16.1.4.1. Overview 16.1.4.2. Product Portfolio 16.1.4.3. Profitability by Market Segments 16.1.4.4. Sales Footprint 16.1.4.5. Strategy Overview 16.1.4.5.1. Marketing Strategy 16.1.4.5.2. Product Strategy 16.1.4.5.3. Channel Strategy 16.1.5. Westmoor Engineering Ltd. 16.1.5.1. Overview 16.1.5.2. Product Portfolio 16.1.5.3. Profitability by Market Segments 16.1.5.4. Sales Footprint 16.1.5.5. Strategy Overview 16.1.5.5.1. Marketing Strategy 16.1.5.5.2. Product Strategy 16.1.5.5.3. Channel Strategy 16.1.6. Ocean Group 16.1.6.1. Overview 16.1.6.2. Product Portfolio 16.1.6.3. Profitability by Market Segments 16.1.6.4. Sales Footprint 16.1.6.5. Strategy Overview 16.1.6.5.1. Marketing Strategy 16.1.6.5.2. Product Strategy 16.1.6.5.3. Channel Strategy 16.1.7. Van Dam B.V 16.1.7.1. Overview 16.1.7.2. Product Portfolio 16.1.7.3. Profitability by Market Segments 16.1.7.4. Sales Footprint 16.1.7.5. Strategy Overview 16.1.7.5.1. Marketing Strategy 16.1.7.5.2. Product Strategy 16.1.7.5.3. Channel Strategy 16.1.8. AdvanTec Marine 16.1.8.1. Overview 16.1.8.2. Product Portfolio 16.1.8.3. Profitability by Market Segments 16.1.8.4. Sales Footprint 16.1.8.5. Strategy Overview 16.1.8.5.1. Marketing Strategy 16.1.8.5.2. Product Strategy 16.1.8.5.3. Channel Strategy 16.1.9. SeaNet SA 16.1.9.1. Overview 16.1.9.2. Product Portfolio 16.1.9.3. Profitability by Market Segments 16.1.9.4. Sales Footprint 16.1.9.5. Strategy Overview 16.1.9.5.1. Marketing Strategy 16.1.9.5.2. Product Strategy 16.1.9.5.3. Channel Strategy 16.1.10. Winel B.V 16.1.10.1. Overview 16.1.10.2. Product Portfolio 16.1.10.3. Profitability by Market Segments 16.1.10.4. Sales Footprint 16.1.10.5. Strategy Overview 16.1.10.5.1. Marketing Strategy 16.1.10.5.2. Product Strategy 16.1.10.5.3. Channel Strategy 17. Assumptions & Acronyms Used 18. Research Methodology
Don't pay for what you don't need
Customize your report by selecting specific countries or regions and save 30%!
List of Tables
Table 1: Global Market Value (US$ Million) Forecast by Region, 2018 to 2033 Table 2: Global Market Volume (Units) Forecast by Region, 2018 to 2033 Table 3: Global Market Value (US$ Million) Forecast by Type, 2018 to 2033 Table 4: Global Market Volume (Units) Forecast by Type, 2018 to 2033 Table 5: Global Market Value (US$ Million) Forecast by Source, 2018 to 2033 Table 6: Global Market Volume (Units) Forecast by Source, 2018 to 2033 Table 7: Global Market Value (US$ Million) Forecast by Type of Vessel, 2018 to 2033 Table 8: Global Market Volume (Units) Forecast by Type of Vessel, 2018 to 2033 Table 9: North America Market Value (US$ Million) Forecast by Country, 2018 to 2033 Table 10: North America Market Volume (Units) Forecast by Country, 2018 to 2033 Table 11: North America Market Value (US$ Million) Forecast by Type, 2018 to 2033 Table 12: North America Market Volume (Units) Forecast by Type, 2018 to 2033 Table 13: North America Market Value (US$ Million) Forecast by Source, 2018 to 2033 Table 14: North America Market Volume (Units) Forecast by Source, 2018 to 2033 Table 15: North America Market Value (US$ Million) Forecast by Type of Vessel, 2018 to 2033 Table 16: North America Market Volume (Units) Forecast by Type of Vessel, 2018 to 2033 Table 17: Latin America Market Value (US$ Million) Forecast by Country, 2018 to 2033 Table 18: Latin America Market Volume (Units) Forecast by Country, 2018 to 2033 Table 19: Latin America Market Value (US$ Million) Forecast by Type, 2018 to 2033 Table 20: Latin America Market Volume (Units) Forecast by Type, 2018 to 2033 Table 21: Latin America Market Value (US$ Million) Forecast by Source, 2018 to 2033 Table 22: Latin America Market Volume (Units) Forecast by Source, 2018 to 2033 Table 23: Latin America Market Value (US$ Million) Forecast by Type of Vessel, 2018 to 2033 Table 24: Latin America Market Volume (Units) Forecast by Type of Vessel, 2018 to 2033 Table 25: Europe Market Value (US$ Million) Forecast by Country, 2018 to 2033 Table 26: Europe Market Volume (Units) Forecast by Country, 2018 to 2033 Table 27: Europe Market Value (US$ Million) Forecast by Type, 2018 to 2033 Table 28: Europe Market Volume (Units) Forecast by Type, 2018 to 2033 Table 29: Europe Market Value (US$ Million) Forecast by Source, 2018 to 2033 Table 30: Europe Market Volume (Units) Forecast by Source, 2018 to 2033 Table 31: Europe Market Value (US$ Million) Forecast by Type of Vessel, 2018 to 2033 Table 32: Europe Market Volume (Units) Forecast by Type of Vessel, 2018 to 2033 Table 33: Asia Pacific Market Value (US$ Million) Forecast by Country, 2018 to 2033 Table 34: Asia Pacific Market Volume (Units) Forecast by Country, 2018 to 2033 Table 35: Asia Pacific Market Value (US$ Million) Forecast by Type, 2018 to 2033 Table 36: Asia Pacific Market Volume (Units) Forecast by Type, 2018 to 2033 Table 37: Asia Pacific Market Value (US$ Million) Forecast by Source, 2018 to 2033 Table 38: Asia Pacific Market Volume (Units) Forecast by Source, 2018 to 2033 Table 39: Asia Pacific Market Value (US$ Million) Forecast by Type of Vessel, 2018 to 2033 Table 40: Asia Pacific Market Volume (Units) Forecast by Type of Vessel, 2018 to 2033 Table 41: MEA Market Value (US$ Million) Forecast by Country, 2018 to 2033 Table 42: MEA Market Volume (Units) Forecast by Country, 2018 to 2033 Table 43: MEA Market Value (US$ Million) Forecast by Type, 2018 to 2033 Table 44: MEA Market Volume (Units) Forecast by Type, 2018 to 2033 Table 45: MEA Market Value (US$ Million) Forecast by Source, 2018 to 2033 Table 46: MEA Market Volume (Units) Forecast by Source, 2018 to 2033 Table 47: MEA Market Value (US$ Million) Forecast by Type of Vessel, 2018 to 2033 Table 48: MEA Market Volume (Units) Forecast by Type of Vessel, 2018 to 2033
List of Charts
Figure 1: Global Market Value (US$ Million) by Type, 2023 to 2033 Figure 2: Global Market Value (US$ Million) by Source, 2023 to 2033 Figure 3: Global Market Value (US$ Million) by Type of Vessel, 2023 to 2033 Figure 4: Global Market Value (US$ Million) by Region, 2023 to 2033 Figure 5: Global Market Value (US$ Million) Analysis by Region, 2018 to 2033 Figure 6: Global Market Volume (Units) Analysis by Region, 2018 to 2033 Figure 7: Global Market Value Share (%) and BPS Analysis by Region, 2023 to 2033 Figure 8: Global Market Y-o-Y Growth (%) Projections by Region, 2023 to 2033 Figure 9: Global Market Value (US$ Million) Analysis by Type, 2018 to 2033 Figure 10: Global Market Volume (Units) Analysis by Type, 2018 to 2033 Figure 11: Global Market Value Share (%) and BPS Analysis by Type, 2023 to 2033 Figure 12: Global Market Y-o-Y Growth (%) Projections by Type, 2023 to 2033 Figure 13: Global Market Value (US$ Million) Analysis by Source, 2018 to 2033 Figure 14: Global Market Volume (Units) Analysis by Source, 2018 to 2033 Figure 15: Global Market Value Share (%) and BPS Analysis by Source, 2023 to 2033 Figure 16: Global Market Y-o-Y Growth (%) Projections by Source, 2023 to 2033 Figure 17: Global Market Value (US$ Million) Analysis by Type of Vessel, 2018 to 2033 Figure 18: Global Market Volume (Units) Analysis by Type of Vessel, 2018 to 2033 Figure 19: Global Market Value Share (%) and BPS Analysis by Type of Vessel, 2023 to 2033 Figure 20: Global Market Y-o-Y Growth (%) Projections by Type of Vessel, 2023 to 2033 Figure 21: Global Market Attractiveness by Type, 2023 to 2033 Figure 22: Global Market Attractiveness by Source, 2023 to 2033 Figure 23: Global Market Attractiveness by Type of Vessel, 2023 to 2033 Figure 24: Global Market Attractiveness by Region, 2023 to 2033 Figure 25: North America Market Value (US$ Million) by Type, 2023 to 2033 Figure 26: North America Market Value (US$ Million) by Source, 2023 to 2033 Figure 27: North America Market Value (US$ Million) by Type of Vessel, 2023 to 2033 Figure 28: North America Market Value (US$ Million) by Country, 2023 to 2033 Figure 29: North America Market Value (US$ Million) Analysis by Country, 2018 to 2033 Figure 30: North America Market Volume (Units) Analysis by Country, 2018 to 2033 Figure 31: North America Market Value Share (%) and BPS Analysis by Country, 2023 to 2033 Figure 32: North America Market Y-o-Y Growth (%) Projections by Country, 2023 to 2033 Figure 33: North America Market Value (US$ Million) Analysis by Type, 2018 to 2033 Figure 34: North America Market Volume (Units) Analysis by Type, 2018 to 2033 Figure 35: North America Market Value Share (%) and BPS Analysis by Type, 2023 to 2033 Figure 36: North America Market Y-o-Y Growth (%) Projections by Type, 2023 to 2033 Figure 37: North America Market Value (US$ Million) Analysis by Source, 2018 to 2033 Figure 38: North America Market Volume (Units) Analysis by Source, 2018 to 2033 Figure 39: North America Market Value Share (%) and BPS Analysis by Source, 2023 to 2033 Figure 40: North America Market Y-o-Y Growth (%) Projections by Source, 2023 to 2033 Figure 41: North America Market Value (US$ Million) Analysis by Type of Vessel, 2018 to 2033 Figure 42: North America Market Volume (Units) Analysis by Type of Vessel, 2018 to 2033 Figure 43: North America Market Value Share (%) and BPS Analysis by Type of Vessel, 2023 to 2033 Figure 44: North America Market Y-o-Y Growth (%) Projections by Type of Vessel, 2023 to 2033 Figure 45: North America Market Attractiveness by Type, 2023 to 2033 Figure 46: North America Market Attractiveness by Source, 2023 to 2033 Figure 47: North America Market Attractiveness by Type of Vessel, 2023 to 2033 Figure 48: North America Market Attractiveness by Country, 2023 to 2033 Figure 49: Latin America Market Value (US$ Million) by Type, 2023 to 2033 Figure 50: Latin America Market Value (US$ Million) by Source, 2023 to 2033 Figure 51: Latin America Market Value (US$ Million) by Type of Vessel, 2023 to 2033 Figure 52: Latin America Market Value (US$ Million) by Country, 2023 to 2033 Figure 53: Latin America Market Value (US$ Million) Analysis by Country, 2018 to 2033 Figure 54: Latin America Market Volume (Units) Analysis by Country, 2018 to 2033 Figure 55: Latin America Market Value Share (%) and BPS Analysis by Country, 2023 to 2033 Figure 56: Latin America Market Y-o-Y Growth (%) Projections by Country, 2023 to 2033 Figure 57: Latin America Market Value (US$ Million) Analysis by Type, 2018 to 2033 Figure 58: Latin America Market Volume (Units) Analysis by Type, 2018 to 2033 Figure 59: Latin America Market Value Share (%) and BPS Analysis by Type, 2023 to 2033 Figure 60: Latin America Market Y-o-Y Growth (%) Projections by Type, 2023 to 2033 Figure 61: Latin America Market Value (US$ Million) Analysis by Source, 2018 to 2033 Figure 62: Latin America Market Volume (Units) Analysis by Source, 2018 to 2033 Figure 63: Latin America Market Value Share (%) and BPS Analysis by Source, 2023 to 2033 Figure 64: Latin America Market Y-o-Y Growth (%) Projections by Source, 2023 to 2033 Figure 65: Latin America Market Value (US$ Million) Analysis by Type of Vessel, 2018 to 2033 Figure 66: Latin America Market Volume (Units) Analysis by Type of Vessel, 2018 to 2033 Figure 67: Latin America Market Value Share (%) and BPS Analysis by Type of Vessel, 2023 to 2033 Figure 68: Latin America Market Y-o-Y Growth (%) Projections by Type of Vessel, 2023 to 2033 Figure 69: Latin America Market Attractiveness by Type, 2023 to 2033 Figure 70: Latin America Market Attractiveness by Source, 2023 to 2033 Figure 71: Latin America Market Attractiveness by Type of Vessel, 2023 to 2033 Figure 72: Latin America Market Attractiveness by Country, 2023 to 2033 Figure 73: Europe Market Value (US$ Million) by Type, 2023 to 2033 Figure 74: Europe Market Value (US$ Million) by Source, 2023 to 2033 Figure 75: Europe Market Value (US$ Million) by Type of Vessel, 2023 to 2033 Figure 76: Europe Market Value (US$ Million) by Country, 2023 to 2033 Figure 77: Europe Market Value (US$ Million) Analysis by Country, 2018 to 2033 Figure 78: Europe Market Volume (Units) Analysis by Country, 2018 to 2033 Figure 79: Europe Market Value Share (%) and BPS Analysis by Country, 2023 to 2033 Figure 80: Europe Market Y-o-Y Growth (%) Projections by Country, 2023 to 2033 Figure 81: Europe Market Value (US$ Million) Analysis by Type, 2018 to 2033 Figure 82: Europe Market Volume (Units) Analysis by Type, 2018 to 2033 Figure 83: Europe Market Value Share (%) and BPS Analysis by Type, 2023 to 2033 Figure 84: Europe Market Y-o-Y Growth (%) Projections by Type, 2023 to 2033 Figure 85: Europe Market Value (US$ Million) Analysis by Source, 2018 to 2033 Figure 86: Europe Market Volume (Units) Analysis by Source, 2018 to 2033 Figure 87: Europe Market Value Share (%) and BPS Analysis by Source, 2023 to 2033 Figure 88: Europe Market Y-o-Y Growth (%) Projections by Source, 2023 to 2033 Figure 89: Europe Market Value (US$ Million) Analysis by Type of Vessel, 2018 to 2033 Figure 90: Europe Market Volume (Units) Analysis by Type of Vessel, 2018 to 2033 Figure 91: Europe Market Value Share (%) and BPS Analysis by Type of Vessel, 2023 to 2033 Figure 92: Europe Market Y-o-Y Growth (%) Projections by Type of Vessel, 2023 to 2033 Figure 93: Europe Market Attractiveness by Type, 2023 to 2033 Figure 94: Europe Market Attractiveness by Source, 2023 to 2033 Figure 95: Europe Market Attractiveness by Type of Vessel, 2023 to 2033 Figure 96: Europe Market Attractiveness by Country, 2023 to 2033 Figure 97: Asia Pacific Market Value (US$ Million) by Type, 2023 to 2033 Figure 98: Asia Pacific Market Value (US$ Million) by Source, 2023 to 2033 Figure 99: Asia Pacific Market Value (US$ Million) by Type of Vessel, 2023 to 2033 Figure 100: Asia Pacific Market Value (US$ Million) by Country, 2023 to 2033 Figure 101: Asia Pacific Market Value (US$ Million) Analysis by Country, 2018 to 2033 Figure 102: Asia Pacific Market Volume (Units) Analysis by Country, 2018 to 2033 Figure 103: Asia Pacific Market Value Share (%) and BPS Analysis by Country, 2023 to 2033 Figure 104: Asia Pacific Market Y-o-Y Growth (%) Projections by Country, 2023 to 2033 Figure 105: Asia Pacific Market Value (US$ Million) Analysis by Type, 2018 to 2033 Figure 106: Asia Pacific Market Volume (Units) Analysis by Type, 2018 to 2033 Figure 107: Asia Pacific Market Value Share (%) and BPS Analysis by Type, 2023 to 2033 Figure 108: Asia Pacific Market Y-o-Y Growth (%) Projections by Type, 2023 to 2033 Figure 109: Asia Pacific Market Value (US$ Million) Analysis by Source, 2018 to 2033 Figure 110: Asia Pacific Market Volume (Units) Analysis by Source, 2018 to 2033 Figure 111: Asia Pacific Market Value Share (%) and BPS Analysis by Source, 2023 to 2033 Figure 112: Asia Pacific Market Y-o-Y Growth (%) Projections by Source, 2023 to 2033 Figure 113: Asia Pacific Market Value (US$ Million) Analysis by Type of Vessel, 2018 to 2033 Figure 114: Asia Pacific Market Volume (Units) Analysis by Type of Vessel, 2018 to 2033 Figure 115: Asia Pacific Market Value Share (%) and BPS Analysis by Type of Vessel, 2023 to 2033 Figure 116: Asia Pacific Market Y-o-Y Growth (%) Projections by Type of Vessel, 2023 to 2033 Figure 117: Asia Pacific Market Attractiveness by Type, 2023 to 2033 Figure 118: Asia Pacific Market Attractiveness by Source, 2023 to 2033 Figure 119: Asia Pacific Market Attractiveness by Type of Vessel, 2023 to 2033 Figure 120: Asia Pacific Market Attractiveness by Country, 2023 to 2033 Figure 121: MEA Market Value (US$ Million) by Type, 2023 to 2033 Figure 122: MEA Market Value (US$ Million) by Source, 2023 to 2033 Figure 123: MEA Market Value (US$ Million) by Type of Vessel, 2023 to 2033 Figure 124: MEA Market Value (US$ Million) by Country, 2023 to 2033 Figure 125: MEA Market Value (US$ Million) Analysis by Country, 2018 to 2033 Figure 126: MEA Market Volume (Units) Analysis by Country, 2018 to 2033 Figure 127: MEA Market Value Share (%) and BPS Analysis by Country, 2023 to 2033 Figure 128: MEA Market Y-o-Y Growth (%) Projections by Country, 2023 to 2033 Figure 129: MEA Market Value (US$ Million) Analysis by Type, 2018 to 2033 Figure 130: MEA Market Volume (Units) Analysis by Type, 2018 to 2033 Figure 131: MEA Market Value Share (%) and BPS Analysis by Type, 2023 to 2033 Figure 132: MEA Market Y-o-Y Growth (%) Projections by Type, 2023 to 2033 Figure 133: MEA Market Value (US$ Million) Analysis by Source, 2018 to 2033 Figure 134: MEA Market Volume (Units) Analysis by Source, 2018 to 2033 Figure 135: MEA Market Value Share (%) and BPS Analysis by Source, 2023 to 2033 Figure 136: MEA Market Y-o-Y Growth (%) Projections by Source, 2023 to 2033 Figure 137: MEA Market Value (US$ Million) Analysis by Type of Vessel, 2018 to 2033 Figure 138: MEA Market Volume (Units) Analysis by Type of Vessel, 2018 to 2033 Figure 139: MEA Market Value Share (%) and BPS Analysis by Type of Vessel, 2023 to 2033 Figure 140: MEA Market Y-o-Y Growth (%) Projections by Type of Vessel, 2023 to 2033 Figure 141: MEA Market Attractiveness by Type, 2023 to 2033 Figure 142: MEA Market Attractiveness by Source, 2023 to 2033 Figure 143: MEA Market Attractiveness by Type of Vessel, 2023 to 2033 Figure 144: MEA Market Attractiveness by Country, 2023 to 2033
Recommendations
Explore Automotive Insights
View Reports