Indoor Air Quality Monitor Market Size and Share Forecast Outlook 2025 to 2035

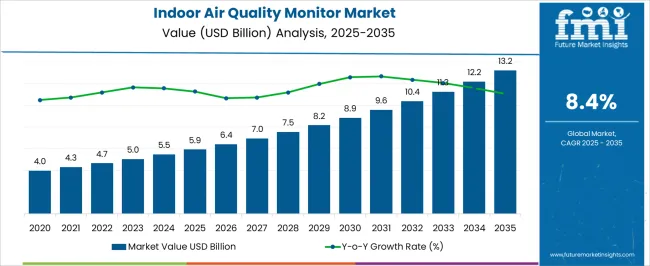
The Indoor Air Quality Monitor Market is estimated to be valued at USD 5.9 billion in 2025 and is projected to reach USD 13.2 billion by 2035, registering a compound annual growth rate (CAGR) of 8.4% over the forecast period.
Quick Stats for Indoor Air Quality Monitor Market

  • Indoor Air Quality Monitor Market Industry Value (2025): USD 5.9 billion
  • Indoor Air Quality Monitor Market Forecast Value (2035): USD 13.2 billion
  • Indoor Air Quality Monitor Market Forecast CAGR: 8.4%
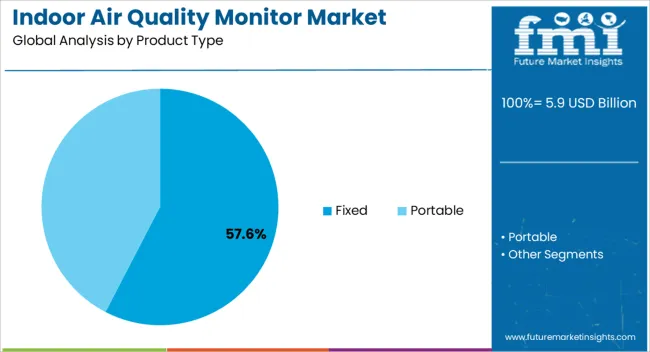
  • Leading Segment in Indoor Air Quality Monitor Market in 2025: Fixed (57.6%)
  • Key Growth Region in Indoor Air Quality Monitor Market: North America, Asia-Pacific, Europe
  • Top Key Players in Indoor Air Quality Monitor Market: Aeroqual Ltd., TSI Inc., Ingersoll Rand Plc., Panasonic Corp., Daikin North America LLC, Trane Technologies plc, Lennox International Inc., Zigma Global Environ Solutions, Teledyne Technologies Inc., Horiba Ltd.

Indoor Air Quality Monitor Market Market Value Analysis

Metric Value
Indoor Air Quality Monitor Market Estimated Value in (2025 E) USD 5.9 billion
Indoor Air Quality Monitor Market Forecast Value in (2035 F) USD 13.2 billion
Forecast CAGR (2025 to 2035) 8.4%

Rationale for Segmental Growth in the Indoor Air Quality Monitor Market

The indoor air quality (IAQ) monitor market is advancing steadily, supported by heightened awareness of air pollution’s impact on health and regulatory emphasis on safe indoor environments. Industry publications and corporate disclosures have underlined growing concerns about volatile organic compounds, particulate matter, and toxic gases within enclosed spaces, which has prompted widespread adoption of monitoring systems.

Rapid urbanization, coupled with stricter occupational safety standards, has driven demand in industrial, commercial, and residential settings. Technological progress, including integration with IoT platforms and advanced sensor miniaturization, has enhanced the accuracy and real-time monitoring capabilities of IAQ devices.

Additionally, governments and health agencies are increasingly mandating compliance with air quality standards, strengthening the market outlook. Investments in smart building solutions have further broadened the application scope of these monitors, particularly in energy-efficient infrastructures. Looking ahead, sustained growth is anticipated as industries, healthcare facilities, and households prioritize healthier environments, with segmental momentum led by fixed devices, chemical pollutant monitoring, and industrial end users.
Segmental Analysis

Insights into the Product Type Segment: Fixed

Indoor Air Quality Monitor Market Analysis By Product Type

The Fixed segment is projected to contribute 57.60% of the indoor air quality monitor market revenue in 2025, maintaining its lead among product categories. This dominance has been reinforced by the reliability and precision of fixed monitoring systems, which are permanently installed in environments where continuous air quality assessment is required.

Industrial plants, laboratories, and large commercial facilities have favored fixed devices due to their ability to provide uninterrupted data and support compliance reporting with regulatory standards. Manufacturers have advanced fixed monitors with multi-sensor arrays and wireless connectivity, enabling integration with centralized monitoring networks.

Their durability and suitability for long-term deployment have made them indispensable for locations with persistent air quality risks. As organizations prioritize accurate, real-time environmental monitoring to safeguard workforce health and operational efficiency, the Fixed segment is expected to retain its strong market position.
Insights into the Pollutant Type Segment: Chemical

Indoor Air Quality Monitor Market Analysis By Pollutant Type

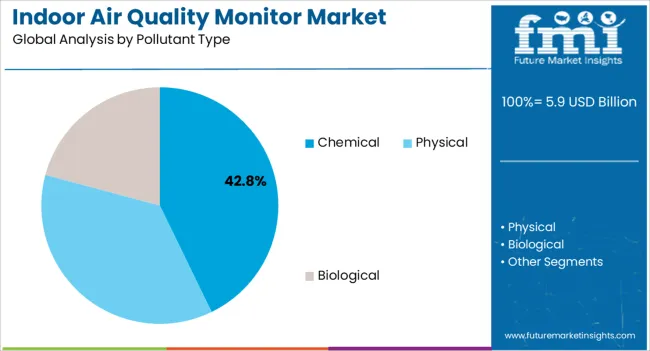
The Chemical segment is projected to account for 42.80% of the indoor air quality monitor market revenue in 2025, establishing it as the largest pollutant monitoring category. Growth in this segment has been driven by the significant health risks associated with exposure to volatile organic compounds, carbon monoxide, and formaldehyde, which are common in industrial, residential, and office settings.

Regulatory bodies and occupational safety agencies have underscored the necessity of chemical pollutant detection to prevent long-term respiratory illnesses and workplace hazards. Technological advancements in electrochemical and infrared sensors have enhanced the sensitivity and selectivity of chemical pollutant monitoring, allowing more precise detection at lower concentrations.

Furthermore, the increasing use of synthetic materials and chemicals in building construction and manufacturing has amplified the need for continuous chemical monitoring. With heightened awareness of indoor chemical exposure and its link to chronic health conditions, the Chemical segment is anticipated to remain the most critical pollutant monitoring category.
Insights into the End User Segment: Industrial

Indoor Air Quality Monitor Market Analysis By End User

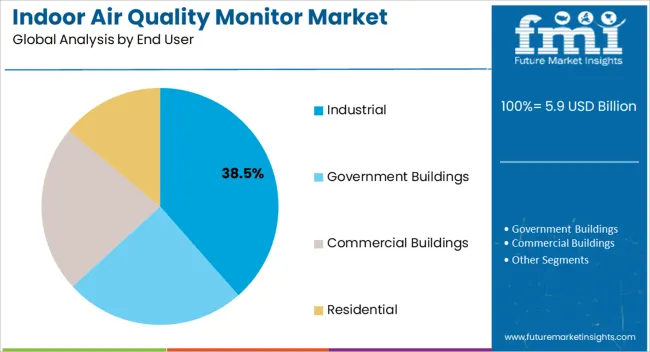
The Industrial segment is projected to capture 38.50% of the indoor air quality monitor market revenue in 2025, holding the leading share among end users. This leadership has been driven by stringent workplace safety standards and the elevated risks of exposure to hazardous gases, fumes, and particulates in industrial operations.

Industries such as manufacturing, mining, and chemical processing have prioritized the installation of IAQ monitors to comply with occupational health regulations and reduce liability risks. Press releases and annual reports from industrial firms have emphasized investments in environmental monitoring systems to enhance workforce protection and ensure regulatory compliance.

Industrial facilities also demand fixed, ruggedized monitoring solutions capable of operating in challenging environments, further boosting adoption. As industrialization expands in emerging economies and safety standards become increasingly stringent worldwide, the Industrial segment is expected to sustain its market leadership, anchored by regulatory enforcement and corporate health and safety commitments.

The Popularity of Smart Homes Surging Demand for Indoor Air Quality Monitors

Particles and contaminants are constantly mixed in with the indoor air, which may affect the overall air quality. These include mold, viruses, bacteria, allergens, and sometimes lint. These require an indoor air quality monitor to detect when thorough cleaning is required indoors.

Smart homes are growing in popularity, along with the concept of ambient assisted living. This is because chemicals such as formaldehyde and particulate matter in the air can lead to lung cancer, systematic hypertension, etc., in people inhaling this air.

A common cause of indoor pollution in residential spaces is fumes from stoves and other fuel-burning combustion appliances, tobacco products, building materials and furnishings, products for cleaning and maintenance, etc. Moreover, high temperatures and moisture from extreme humidity can develop mold growth and enable viruses to linger in the air. These factors are expected to propel the demand for indoor air quality monitors.

It is nearly impossible to prevent the sources of indoor air pollution as these contaminants originate from daily, regular activities. Hence, deploying indoor air quality monitors is crucial as it informs the consumer when harmful air contaminants have reached unsafe levels in certain building areas and require urgent ventilation or cleaning.

Deployment of Renewable Energy Sources and other Challenging Factors and Future Scopes of IAQ

The increasing consumption of energy globally surges the issue of pollution and its harmful aftereffects. Hence, people are switching to deploying renewable or green energy, which has become vital. These naturally replenishing renewable energy sources, such as biomass and hydropower, are preferred over indoor air quality monitors, which is expected to hinder the global indoor air quality monitor market growth.

Conversely, businesses are investing in air quality devices that can monitor indoor air quality across a wide range of important parameters to address pressing air quality concerns, such as the inability to manage their HVAC systems by temperature. Moreover, vendors are offering advanced technologies with accurate monitoring capabilities, which aids in enhancing delivery efficiency.

Indoor Air Quality Monitor Market Regional Overview

The Growth of the Market in North America Attributed to the Adoption of Advanced Technology

North America, with a global share of 25.6%, is dominating the indoor air quality market. This is attributed to rising public-private funding and increasing adoption of new advanced indoor air quality monitoring technologies.

There have been ongoing technological advancements in particulate sensors and gas analyzers. Furthermore, investments in promoting indoor air pollution monitoring, as well as the presence of supportive government regulations, are expected to drive global market growth.

Rising Air Pollution in the Asia Pacific Region Provides Foundation for Market Growth

The Asia Pacific region is set to witness significant growth in the indoor air quality monitor market in the forecast period. The increasing population, and eventually the rapid urbanization and industrial advancement, exposes several regions in the Asia Pacific to increased pollution and raises health concerns associated with poor air quality index not just in an external environment but also in an indoor location. This builds the foundation for the region's indoor air quality monitor market.

With technological advancements in sensor technology, data analytics, and IoT devices, countries in the region can easily access the benefits of indoor air quality monitor technology. Therefore, India is expected to progress at a CAGR of 13.2% by 2035 and China at 10.1%.

Start-up Companies Advocating for the Indoor Air Quality Monitor Market

Various respiratory illnesses can arise from the prolonged inhalation of fine dust, mold, viruses, or harmful emissions from household appliances. These issues need to be curbed. Hence, start-up companies are adopting smart technologies to promote the sales of indoor air quality monitors.
  • Room- A mobile app helps users explore, analyze, and compare a city's air quality. It uses sensor-based technologies to capture air quality from various pockets in the city. The devices are equipped with GPRS, Wi-Fi, and Bluetooth and are connected to the cloud. The company provides multiple products - Polludron, a solar-powered outdoor air quality monitor, Breath-i Pro, an indoor air quality monitor, Breath-i Pocket, a personal air quality device, and products for industrial air quality monitoring. Its product transmits the data using the available network to Oizom-Cloud Servers, where the data is analyzed and served as a user-friendly infographic on the mobile application in real-time.
  • RUBIX Senses & Instrumentation - It provides an Internet of Things-based solution for environmental monitoring of both indoor and outdoor locations. The product line includes Watch Tower 1, Rubix POD, and Rubix Home. Watch Tower 1 measure parameters such as odor, air quality, pollutant gases (H2S, NH3, VOC, etc.), and noise. Rubix POD monitors humidity, temperature, light, noise, and air quality. It is ideal for hotel rooms, shopping malls, department stores, subways, airports, and restaurants.
  • Sunscreen- It provides indoor air quality monitoring solutions for enterprises. It is a battery-powered sensors (SensNODE) and transmits the real-time data to the cloud (SensCLOUD). Therefore makes the prediction and analysis of data and displays the result on the mobile app. It uses reinforced learning algorithms to make predictions. It provides solutions for shopping malls, hospitality businesses, education, and workspaces.
  • Nova - It provides an Internet of Things-enabled solution for monitoring indoor workplace pollution. The solution consists of a sensor that monitors up to 26 environmental parameters such as methane, carbon monoxide, smoke, particulate matter, noise pollution, humidity, temperature, ionizing radiation, water quality, etc. The sensor collects data in real-time and sends it to the cloud.
  • Plume Labs - It is an air pollution data collection and analysis company. It develops a small portable air quality sensor called Flow, which it sells to consumers to help them understand the pollution levels at various places (home, workplace, etc.). The data collected from all the Flow sensors in a specific area/city is also incorporated into weather maps sold to governments, businesses, and researchers/planners.
  • Whitelabel - It is a provider of connected air quality monitors. It develops a smart sensor that monitors the air quality for allergens like dust mites, pollen, mold, and pet danger to help users identify sources of allergies and asthma indoors. It can also monitor environmental parameters and detect harmful gases and irritants.

Top 5 Market Players of the Indoor Air Quality Monitor Market to Look Out For

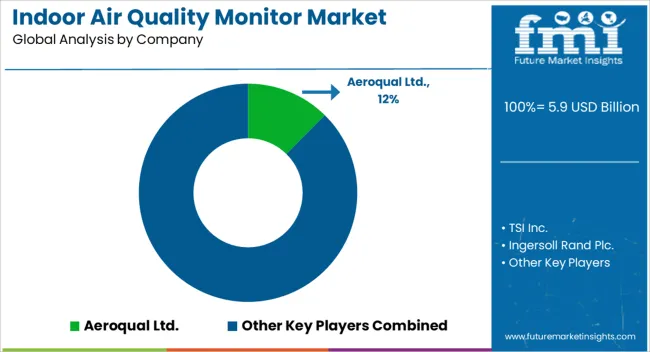
Indoor Air Quality Monitor Market Analysis By Company

The indoor air quality monitor market share is highly competitive for many participants. Mergers and acquisitions are likely to aid in market growth and provide significant opportunities for the market players to obtain profit. The growing awareness about the importance of purifying our air is anticipated to accelerate product sales.

Key Market Participants of The Indoor Air Quality Monitor Market:

  • Siemens AG is a German multinational conglomerate corporation and the leading industrial manufacturing company in Europe. The corporation is a prominent maker of medical diagnostics equipment, and its medical healthcare division, which generates about 12 percent of the corporation's total sales, is its second-most profitable unit after the industrial automation division. The corporation is a component of the Euro Stoxx 50 stock market index.
  • Emerson Electric Co. - It is an American multinational corporation headquartered in Ferguson, Missouri. The Fortune 500 company manufactures products and provides engineering services for industrial, commercial, and consumer markets. Emerson has around 86,700 employees and 170 manufacturing locations.
  • Thermo Fisher Scientific Inc. is an American supplier of scientific instrumentation, reagents and consumables, and software services. Based in Waltham, Massachusetts, Thermo Fisher was formed through the merger of Thermo Electron and Fisher Scientific in 2006.
  • Google Nest Labs Inc. is a line of smart home products, including smart speakers, displays, streaming devices, thermostats, smoke detectors, routers and security systems, smart doorbells, cameras, and smart locks.
  • 3M - It is an American multinational conglomerate operating in the industry, worker safety, United States health care, and consumer goods. The company produces over 60,000 products under several brands, including adhesives, abrasives, laminates, passive fire protection, personal protective equipment, window films, paint protection films, dental and orthodontic products, healthcare software, and optical films.

Other Market Players in the Indoor Air Quality Monitor Market

  • Aeroqual Ltd.
  • TSI Inc.
  • Ingersoll Rand Plc.
  • Panasonic Corp.
  • Daikin North America LLC
  • Trane Technologies plc
  • Lennox International Inc.
  • Zigma Global Environ Solutions
  • Teledyne Technologies Inc.
  • Horiba Ltd.

Recent Developments in the Market:

  • In April 2025, Delta Electronics (Thailand) PCL announced the opening of the Delta Thailand Net Zero Container Showroom at Amata City Chonburi. The Thailand government is leading the country towards a low-carbon society, hence the contribution of Delta in renewable energy and energy storage to reduce their carbon footprint and be part of a smarter grid. This may help the company to achieve its mission to provide innovative, clean, and energy-efficient solutions and develop global R&D solutions that make factories smarter, buildings greener, and businesses more integrated in Thailand and Southeast Asia.
  • In April 2025, a start-up, ActiveBuildings, announced that the company and Balvi Fund signed an MoU to establish 5,000 indoor air quality monitors and 10,000 air cleaners in Karnataka and Maharashtra. With concerns over worsening air quality in Karnataka, the tech startup has received USD 1 million in funding for the monitoring and filtration of air in the state as well as Maharashtra. This public-private deal shall help the company establish a significant market share in the Indian market.
  • In July 2024, BreezoMeter announced cooperation with Siemens Smart Infrastructure, the companies are working on a use case to determine the optimal time to refresh indoor air quality in a building based on external air quality data. The combined offering can be available at a far lower cost than developing solutions in-house. Thus, a low-cost solution in a market with costly set-ups can help both companies make profits.
  • In October 2020, Emerson, a leader in the heating, ventilation, and air conditioning (HVAC) controlled industry, created highly rated smart thermostat solutions. The company announced that its ENERGY STAR-certified Sensi Smart thermostats are now compatible with Awair's indoor air quality monitoring platform. This certification shall help boost the sales of this product in the market and help the company with its revenue.
  • In February 2025, TSI Incorporated, a global manufacturer of filter testing equipment, launched its product, the Production Line Stimulator (PLS) 8150-PLS. The PLS Improves the functionality of TSI's Automated Filter Tester 8150 by adding several key features to it and making it an efficient solution for operation outside of a production line environment.
  • In May 2025, 3M, a global team that works on the motto of applying science to life, announced a joint venture with Savante, a fast-growing manufacturer of solid sorbent-based filters. This partnership is in view to develop Direct Air Capture (DAC) products for the carbon dioxide removal (CDR) industry to trap carbon dioxide found in the atmosphere and permanently remove it.

Report Scope

Report Attribute Details
Growth Rate CAGR of 8.8% from 2025 to 2035
Base year for estimation 2025
Historical data 2020 to 2025
Forecast period 2025 to 2035
Quantitative units Revenue in USD million and CAGR from 2025 to 2035
Report Coverage Revenue forecast, volume forecast, company ranking, competitive landscape, growth factors and trends, Pricing Analysis,
Segments Covered Product Type, Pollutant Type, End User, and Region
Regional scope North America, Western Europe, Eastern Europe, the Middle East and Africa, ASEAN, South Asia, Rest of Asia, Australia, and New Zealand
Country scope United States, Canada, Mexico, Germany, United Kingdom, France, Italy, Spain, Russia, Belgium, Poland, Czech Republic, China, India, Japan, Australia, Brazil, Argentina, Colombia, Saudi Arabia, UAE, Iran, South Africa
Key companies profiled Siemens AG, Emerson Electric Co., Thermo Fisher Scientific Inc., Google Nest Labs Inc., 3M, Aeroqual Ltd., TSI Inc., Ingersoll Rand plc, Panasonic Corp., Daikin North America LLC, Trane Technologies plc, Lennox International Inc., Zigma Global Environ Solutions, Teledyne Technologies Inc., Horiba Ltd., etc.
Customization scope Free report customization (equivalent to 8 analysts' working days) with purchase. Addition or alteration to country, regional & segment scope.
Pricing and purchase options Avail customized purchase options to meet your exact research needs.

Key Segments Profiled in the Market

By Product Type:

  • Fixed
  • Portable

By Pollutant Type:

  • Chemical
  • Physical
  • Biological

By End User:

  • Government Buildings
  • Industrial
  • Commercial Buildings
  • Residential

By Region:

  • North America
  • Latin America
  • Asia Pacific
  • The Middle East and Africa
  • Europe

Frequently Asked Questions

How big is the indoor air quality monitor market in 2025?

The global indoor air quality monitor market is estimated to be valued at USD 5.9 billion in 2025.

What will be the size of indoor air quality monitor market in 2035?

The market size for the indoor air quality monitor market is projected to reach USD 13.2 billion by 2035.

How much will be the indoor air quality monitor market growth between 2025 and 2035?

The indoor air quality monitor market is expected to grow at a 8.4% CAGR between 2025 and 2035.

What are the key product types in the indoor air quality monitor market?

The key product types in indoor air quality monitor market are fixed and portable.

Which pollutant type segment to contribute significant share in the indoor air quality monitor market in 2025?

In terms of pollutant type, chemical segment to command 42.8% share in the indoor air quality monitor market in 2025.

Table of Content

  1. Executive Summary
    • Global Market Outlook
    • Demand-side Trends
    • Supply-side Trends
    • Technology Roadmap Analysis
    • Analysis and Recommendations
  2. Market Overview
    • Market Coverage / Taxonomy
    • Market Definition / Scope / Limitations
  3. Market Background
    • Market Dynamics
      • Drivers
      • Restraints
      • Opportunity
      • Trends
    • Scenario Forecast
      • Demand in Optimistic Scenario
      • Demand in Likely Scenario
      • Demand in Conservative Scenario
    • Opportunity Map Analysis
    • Product Life Cycle Analysis
    • Supply Chain Analysis
    • Investment Feasibility Matrix
    • Value Chain Analysis
    • PESTLE and Porter’s Analysis
    • Regulatory Landscape
    • Regional Parent Market Outlook
    • Production and Consumption Statistics
    • Import and Export Statistics
  4. Global Market Analysis 2020 to 2024 and Forecast, 2025 to 2035
    • Historical Market Size Value (USD Million) Analysis, 2020 to 2024
    • Current and Future Market Size Value (USD Million) Projections, 2025 to 2035
      • Y-o-Y Growth Trend Analysis
      • Absolute $ Opportunity Analysis
  5. Global Market Pricing Analysis 2020 to 2024 and Forecast 2025 to 2035
  6. Global Market Analysis 2020 to 2024 and Forecast 2025 to 2035, By Product Type
    • Introduction / Key Findings
    • Historical Market Size Value (USD Million) Analysis By Product Type , 2020 to 2024
    • Current and Future Market Size Value (USD Million) Analysis and Forecast By Product Type , 2025 to 2035
      • Fixed
      • Portable
    • Y-o-Y Growth Trend Analysis By Product Type , 2020 to 2024
    • Absolute $ Opportunity Analysis By Product Type , 2025 to 2035
  7. Global Market Analysis 2020 to 2024 and Forecast 2025 to 2035, By Pollutant Type
    • Introduction / Key Findings
    • Historical Market Size Value (USD Million) Analysis By Pollutant Type, 2020 to 2024
    • Current and Future Market Size Value (USD Million) Analysis and Forecast By Pollutant Type, 2025 to 2035
      • Chemical
      • Physical
      • Biological
    • Y-o-Y Growth Trend Analysis By Pollutant Type, 2020 to 2024
    • Absolute $ Opportunity Analysis By Pollutant Type, 2025 to 2035
  8. Global Market Analysis 2020 to 2024 and Forecast 2025 to 2035, By End User
    • Introduction / Key Findings
    • Historical Market Size Value (USD Million) Analysis By End User, 2020 to 2024
    • Current and Future Market Size Value (USD Million) Analysis and Forecast By End User, 2025 to 2035
      • Industrial
      • Government Buildings
      • Commercial Buildings
      • Residential
    • Y-o-Y Growth Trend Analysis By End User, 2020 to 2024
    • Absolute $ Opportunity Analysis By End User, 2025 to 2035
  9. Global Market Analysis 2020 to 2024 and Forecast 2025 to 2035, By Region
    • Introduction
    • Historical Market Size Value (USD Million) Analysis By Region, 2020 to 2024
    • Current Market Size Value (USD Million) Analysis and Forecast By Region, 2025 to 2035
      • North America
      • Latin America
      • Western Europe
      • Eastern Europe
      • East Asia
      • South Asia and Pacific
      • Middle East & Africa
    • Market Attractiveness Analysis By Region
  10. North America Market Analysis 2020 to 2024 and Forecast 2025 to 2035, By Country
    • Historical Market Size Value (USD Million) Trend Analysis By Market Taxonomy, 2020 to 2024
    • Market Size Value (USD Million) Forecast By Market Taxonomy, 2025 to 2035
      • By Country
        • USA
        • Canada
        • Mexico
      • By Product Type
      • By Pollutant Type
      • By End User
    • Market Attractiveness Analysis
      • By Country
      • By Product Type
      • By Pollutant Type
      • By End User
    • Key Takeaways
  11. Latin America Market Analysis 2020 to 2024 and Forecast 2025 to 2035, By Country
    • Historical Market Size Value (USD Million) Trend Analysis By Market Taxonomy, 2020 to 2024
    • Market Size Value (USD Million) Forecast By Market Taxonomy, 2025 to 2035
      • By Country
        • Brazil
        • Chile
        • Rest of Latin America
      • By Product Type
      • By Pollutant Type
      • By End User
    • Market Attractiveness Analysis
      • By Country
      • By Product Type
      • By Pollutant Type
      • By End User
    • Key Takeaways
  12. Western Europe Market Analysis 2020 to 2024 and Forecast 2025 to 2035, By Country
    • Historical Market Size Value (USD Million) Trend Analysis By Market Taxonomy, 2020 to 2024
    • Market Size Value (USD Million) Forecast By Market Taxonomy, 2025 to 2035
      • By Country
        • Germany
        • UK
        • Italy
        • Spain
        • France
        • Nordic
        • BENELUX
        • Rest of Western Europe
      • By Product Type
      • By Pollutant Type
      • By End User
    • Market Attractiveness Analysis
      • By Country
      • By Product Type
      • By Pollutant Type
      • By End User
    • Key Takeaways
  13. Eastern Europe Market Analysis 2020 to 2024 and Forecast 2025 to 2035, By Country
    • Historical Market Size Value (USD Million) Trend Analysis By Market Taxonomy, 2020 to 2024
    • Market Size Value (USD Million) Forecast By Market Taxonomy, 2025 to 2035
      • By Country
        • Russia
        • Poland
        • Hungary
        • Balkan & Baltic
        • Rest of Eastern Europe
      • By Product Type
      • By Pollutant Type
      • By End User
    • Market Attractiveness Analysis
      • By Country
      • By Product Type
      • By Pollutant Type
      • By End User
    • Key Takeaways
  14. East Asia Market Analysis 2020 to 2024 and Forecast 2025 to 2035, By Country
    • Historical Market Size Value (USD Million) Trend Analysis By Market Taxonomy, 2020 to 2024
    • Market Size Value (USD Million) Forecast By Market Taxonomy, 2025 to 2035
      • By Country
        • China
        • Japan
        • South Korea
      • By Product Type
      • By Pollutant Type
      • By End User
    • Market Attractiveness Analysis
      • By Country
      • By Product Type
      • By Pollutant Type
      • By End User
    • Key Takeaways
  15. South Asia and Pacific Market Analysis 2020 to 2024 and Forecast 2025 to 2035, By Country
    • Historical Market Size Value (USD Million) Trend Analysis By Market Taxonomy, 2020 to 2024
    • Market Size Value (USD Million) Forecast By Market Taxonomy, 2025 to 2035
      • By Country
        • India
        • ASEAN
        • Australia & New Zealand
        • Rest of South Asia and Pacific
      • By Product Type
      • By Pollutant Type
      • By End User
    • Market Attractiveness Analysis
      • By Country
      • By Product Type
      • By Pollutant Type
      • By End User
    • Key Takeaways
  16. Middle East & Africa Market Analysis 2020 to 2024 and Forecast 2025 to 2035, By Country
    • Historical Market Size Value (USD Million) Trend Analysis By Market Taxonomy, 2020 to 2024
    • Market Size Value (USD Million) Forecast By Market Taxonomy, 2025 to 2035
      • By Country
        • Kingdom of Saudi Arabia
        • Other GCC Countries
        • Turkiye
        • South Africa
        • Other African Union
        • Rest of Middle East & Africa
      • By Product Type
      • By Pollutant Type
      • By End User
    • Market Attractiveness Analysis
      • By Country
      • By Product Type
      • By Pollutant Type
      • By End User
    • Key Takeaways
  17. Key Countries Market Analysis
    • USA
      • Pricing Analysis
      • Market Share Analysis, 2024
        • By Product Type
        • By Pollutant Type
        • By End User
    • Canada
      • Pricing Analysis
      • Market Share Analysis, 2024
        • By Product Type
        • By Pollutant Type
        • By End User
    • Mexico
      • Pricing Analysis
      • Market Share Analysis, 2024
        • By Product Type
        • By Pollutant Type
        • By End User
    • Brazil
      • Pricing Analysis
      • Market Share Analysis, 2024
        • By Product Type
        • By Pollutant Type
        • By End User
    • Chile
      • Pricing Analysis
      • Market Share Analysis, 2024
        • By Product Type
        • By Pollutant Type
        • By End User
    • Germany
      • Pricing Analysis
      • Market Share Analysis, 2024
        • By Product Type
        • By Pollutant Type
        • By End User
    • UK
      • Pricing Analysis
      • Market Share Analysis, 2024
        • By Product Type
        • By Pollutant Type
        • By End User
    • Italy
      • Pricing Analysis
      • Market Share Analysis, 2024
        • By Product Type
        • By Pollutant Type
        • By End User
    • Spain
      • Pricing Analysis
      • Market Share Analysis, 2024
        • By Product Type
        • By Pollutant Type
        • By End User
    • France
      • Pricing Analysis
      • Market Share Analysis, 2024
        • By Product Type
        • By Pollutant Type
        • By End User
    • India
      • Pricing Analysis
      • Market Share Analysis, 2024
        • By Product Type
        • By Pollutant Type
        • By End User
    • ASEAN
      • Pricing Analysis
      • Market Share Analysis, 2024
        • By Product Type
        • By Pollutant Type
        • By End User
    • Australia & New Zealand
      • Pricing Analysis
      • Market Share Analysis, 2024
        • By Product Type
        • By Pollutant Type
        • By End User
    • China
      • Pricing Analysis
      • Market Share Analysis, 2024
        • By Product Type
        • By Pollutant Type
        • By End User
    • Japan
      • Pricing Analysis
      • Market Share Analysis, 2024
        • By Product Type
        • By Pollutant Type
        • By End User
    • South Korea
      • Pricing Analysis
      • Market Share Analysis, 2024
        • By Product Type
        • By Pollutant Type
        • By End User
    • Russia
      • Pricing Analysis
      • Market Share Analysis, 2024
        • By Product Type
        • By Pollutant Type
        • By End User
    • Poland
      • Pricing Analysis
      • Market Share Analysis, 2024
        • By Product Type
        • By Pollutant Type
        • By End User
    • Hungary
      • Pricing Analysis
      • Market Share Analysis, 2024
        • By Product Type
        • By Pollutant Type
        • By End User
    • Kingdom of Saudi Arabia
      • Pricing Analysis
      • Market Share Analysis, 2024
        • By Product Type
        • By Pollutant Type
        • By End User
    • Turkiye
      • Pricing Analysis
      • Market Share Analysis, 2024
        • By Product Type
        • By Pollutant Type
        • By End User
    • South Africa
      • Pricing Analysis
      • Market Share Analysis, 2024
        • By Product Type
        • By Pollutant Type
        • By End User
  18. Market Structure Analysis
    • Competition Dashboard
    • Competition Benchmarking
    • Market Share Analysis of Top Players
      • By Regional
      • By Product Type
      • By Pollutant Type
      • By End User
  19. Competition Analysis
    • Competition Deep Dive
      • Aeroqual Ltd.
        • Overview
        • Product Portfolio
        • Profitability by Market Segments (Product/Age /Sales Channel/Region)
        • Sales Footprint
        • Strategy Overview
          • Marketing Strategy
          • Product Strategy
          • Channel Strategy
      • TSI Inc.
      • Ingersoll Rand Plc.
      • Panasonic Corp.
      • Daikin North America LLC
      • Trane Technologies plc
      • Lennox International Inc.
      • Zigma Global Environ Solutions
      • Teledyne Technologies Inc.
      • Horiba Ltd.
  20. Assumptions & Acronyms Used
  21. Research Methodology

List of Tables

  • Table 1: Global Market Value (USD Million) Forecast by Region, 2020-2035
  • Table 2: Global Market Value (USD Million) Forecast by Product Type , 2020-2035
  • Table 3: Global Market Value (USD Million) Forecast by Pollutant Type, 2020-2035
  • Table 4: Global Market Value (USD Million) Forecast by End User, 2020-2035
  • Table 5: North America Market Value (USD Million) Forecast by Country, 2020-2035
  • Table 6: North America Market Value (USD Million) Forecast by Product Type , 2020-2035
  • Table 7: North America Market Value (USD Million) Forecast by Pollutant Type, 2020-2035
  • Table 8: North America Market Value (USD Million) Forecast by End User, 2020-2035
  • Table 9: Latin America Market Value (USD Million) Forecast by Country, 2020-2035
  • Table 10: Latin America Market Value (USD Million) Forecast by Product Type , 2020-2035
  • Table 11: Latin America Market Value (USD Million) Forecast by Pollutant Type, 2020-2035
  • Table 12: Latin America Market Value (USD Million) Forecast by End User, 2020-2035
  • Table 13: Western Europe Market Value (USD Million) Forecast by Country, 2020-2035
  • Table 14: Western Europe Market Value (USD Million) Forecast by Product Type , 2020-2035
  • Table 15: Western Europe Market Value (USD Million) Forecast by Pollutant Type, 2020-2035
  • Table 16: Western Europe Market Value (USD Million) Forecast by End User, 2020-2035
  • Table 17: Eastern Europe Market Value (USD Million) Forecast by Country, 2020-2035
  • Table 18: Eastern Europe Market Value (USD Million) Forecast by Product Type , 2020-2035
  • Table 19: Eastern Europe Market Value (USD Million) Forecast by Pollutant Type, 2020-2035
  • Table 20: Eastern Europe Market Value (USD Million) Forecast by End User, 2020-2035
  • Table 21: East Asia Market Value (USD Million) Forecast by Country, 2020-2035
  • Table 22: East Asia Market Value (USD Million) Forecast by Product Type , 2020-2035
  • Table 23: East Asia Market Value (USD Million) Forecast by Pollutant Type, 2020-2035
  • Table 24: East Asia Market Value (USD Million) Forecast by End User, 2020-2035
  • Table 25: South Asia and Pacific Market Value (USD Million) Forecast by Country, 2020-2035
  • Table 26: South Asia and Pacific Market Value (USD Million) Forecast by Product Type , 2020-2035
  • Table 27: South Asia and Pacific Market Value (USD Million) Forecast by Pollutant Type, 2020-2035
  • Table 28: South Asia and Pacific Market Value (USD Million) Forecast by End User, 2020-2035
  • Table 29: Middle East & Africa Market Value (USD Million) Forecast by Country, 2020-2035
  • Table 30: Middle East & Africa Market Value (USD Million) Forecast by Product Type , 2020-2035
  • Table 31: Middle East & Africa Market Value (USD Million) Forecast by Pollutant Type, 2020-2035
  • Table 32: Middle East & Africa Market Value (USD Million) Forecast by End User, 2020-2035

List of Figures

  • Figure 1: Global Market Pricing Analysis
  • Figure 2: Global Market Value (USD Million) Forecast 2020-2035
  • Figure 3: Global Market Value Share and BPS Analysis by Product Type , 2025 and 2035
  • Figure 4: Global Market Y-o-Y Growth Comparison by Product Type , 2025-2035
  • Figure 5: Global Market Attractiveness Analysis by Product Type
  • Figure 6: Global Market Value Share and BPS Analysis by Pollutant Type, 2025 and 2035
  • Figure 7: Global Market Y-o-Y Growth Comparison by Pollutant Type, 2025-2035
  • Figure 8: Global Market Attractiveness Analysis by Pollutant Type
  • Figure 9: Global Market Value Share and BPS Analysis by End User, 2025 and 2035
  • Figure 10: Global Market Y-o-Y Growth Comparison by End User, 2025-2035
  • Figure 11: Global Market Attractiveness Analysis by End User
  • Figure 12: Global Market Value (USD Million) Share and BPS Analysis by Region, 2025 and 2035
  • Figure 13: Global Market Y-o-Y Growth Comparison by Region, 2025-2035
  • Figure 14: Global Market Attractiveness Analysis by Region
  • Figure 15: North America Market Incremental Dollar Opportunity, 2025-2035
  • Figure 16: Latin America Market Incremental Dollar Opportunity, 2025-2035
  • Figure 17: Western Europe Market Incremental Dollar Opportunity, 2025-2035
  • Figure 18: Eastern Europe Market Incremental Dollar Opportunity, 2025-2035
  • Figure 19: East Asia Market Incremental Dollar Opportunity, 2025-2035
  • Figure 20: South Asia and Pacific Market Incremental Dollar Opportunity, 2025-2035
  • Figure 21: Middle East & Africa Market Incremental Dollar Opportunity, 2025-2035
  • Figure 22: North America Market Value Share and BPS Analysis by Country, 2025 and 2035
  • Figure 23: North America Market Value Share and BPS Analysis by Product Type , 2025 and 2035
  • Figure 24: North America Market Y-o-Y Growth Comparison by Product Type , 2025-2035
  • Figure 25: North America Market Attractiveness Analysis by Product Type
  • Figure 26: North America Market Value Share and BPS Analysis by Pollutant Type, 2025 and 2035
  • Figure 27: North America Market Y-o-Y Growth Comparison by Pollutant Type, 2025-2035
  • Figure 28: North America Market Attractiveness Analysis by Pollutant Type
  • Figure 29: North America Market Value Share and BPS Analysis by End User, 2025 and 2035
  • Figure 30: North America Market Y-o-Y Growth Comparison by End User, 2025-2035
  • Figure 31: North America Market Attractiveness Analysis by End User
  • Figure 32: Latin America Market Value Share and BPS Analysis by Country, 2025 and 2035
  • Figure 33: Latin America Market Value Share and BPS Analysis by Product Type , 2025 and 2035
  • Figure 34: Latin America Market Y-o-Y Growth Comparison by Product Type , 2025-2035
  • Figure 35: Latin America Market Attractiveness Analysis by Product Type
  • Figure 36: Latin America Market Value Share and BPS Analysis by Pollutant Type, 2025 and 2035
  • Figure 37: Latin America Market Y-o-Y Growth Comparison by Pollutant Type, 2025-2035
  • Figure 38: Latin America Market Attractiveness Analysis by Pollutant Type
  • Figure 39: Latin America Market Value Share and BPS Analysis by End User, 2025 and 2035
  • Figure 40: Latin America Market Y-o-Y Growth Comparison by End User, 2025-2035
  • Figure 41: Latin America Market Attractiveness Analysis by End User
  • Figure 42: Western Europe Market Value Share and BPS Analysis by Country, 2025 and 2035
  • Figure 43: Western Europe Market Value Share and BPS Analysis by Product Type , 2025 and 2035
  • Figure 44: Western Europe Market Y-o-Y Growth Comparison by Product Type , 2025-2035
  • Figure 45: Western Europe Market Attractiveness Analysis by Product Type
  • Figure 46: Western Europe Market Value Share and BPS Analysis by Pollutant Type, 2025 and 2035
  • Figure 47: Western Europe Market Y-o-Y Growth Comparison by Pollutant Type, 2025-2035
  • Figure 48: Western Europe Market Attractiveness Analysis by Pollutant Type
  • Figure 49: Western Europe Market Value Share and BPS Analysis by End User, 2025 and 2035
  • Figure 50: Western Europe Market Y-o-Y Growth Comparison by End User, 2025-2035
  • Figure 51: Western Europe Market Attractiveness Analysis by End User
  • Figure 52: Eastern Europe Market Value Share and BPS Analysis by Country, 2025 and 2035
  • Figure 53: Eastern Europe Market Value Share and BPS Analysis by Product Type , 2025 and 2035
  • Figure 54: Eastern Europe Market Y-o-Y Growth Comparison by Product Type , 2025-2035
  • Figure 55: Eastern Europe Market Attractiveness Analysis by Product Type
  • Figure 56: Eastern Europe Market Value Share and BPS Analysis by Pollutant Type, 2025 and 2035
  • Figure 57: Eastern Europe Market Y-o-Y Growth Comparison by Pollutant Type, 2025-2035
  • Figure 58: Eastern Europe Market Attractiveness Analysis by Pollutant Type
  • Figure 59: Eastern Europe Market Value Share and BPS Analysis by End User, 2025 and 2035
  • Figure 60: Eastern Europe Market Y-o-Y Growth Comparison by End User, 2025-2035
  • Figure 61: Eastern Europe Market Attractiveness Analysis by End User
  • Figure 62: East Asia Market Value Share and BPS Analysis by Country, 2025 and 2035
  • Figure 63: East Asia Market Value Share and BPS Analysis by Product Type , 2025 and 2035
  • Figure 64: East Asia Market Y-o-Y Growth Comparison by Product Type , 2025-2035
  • Figure 65: East Asia Market Attractiveness Analysis by Product Type
  • Figure 66: East Asia Market Value Share and BPS Analysis by Pollutant Type, 2025 and 2035
  • Figure 67: East Asia Market Y-o-Y Growth Comparison by Pollutant Type, 2025-2035
  • Figure 68: East Asia Market Attractiveness Analysis by Pollutant Type
  • Figure 69: East Asia Market Value Share and BPS Analysis by End User, 2025 and 2035
  • Figure 70: East Asia Market Y-o-Y Growth Comparison by End User, 2025-2035
  • Figure 71: East Asia Market Attractiveness Analysis by End User
  • Figure 72: South Asia and Pacific Market Value Share and BPS Analysis by Country, 2025 and 2035
  • Figure 73: South Asia and Pacific Market Value Share and BPS Analysis by Product Type , 2025 and 2035
  • Figure 74: South Asia and Pacific Market Y-o-Y Growth Comparison by Product Type , 2025-2035
  • Figure 75: South Asia and Pacific Market Attractiveness Analysis by Product Type
  • Figure 76: South Asia and Pacific Market Value Share and BPS Analysis by Pollutant Type, 2025 and 2035
  • Figure 77: South Asia and Pacific Market Y-o-Y Growth Comparison by Pollutant Type, 2025-2035
  • Figure 78: South Asia and Pacific Market Attractiveness Analysis by Pollutant Type
  • Figure 79: South Asia and Pacific Market Value Share and BPS Analysis by End User, 2025 and 2035
  • Figure 80: South Asia and Pacific Market Y-o-Y Growth Comparison by End User, 2025-2035
  • Figure 81: South Asia and Pacific Market Attractiveness Analysis by End User
  • Figure 82: Middle East & Africa Market Value Share and BPS Analysis by Country, 2025 and 2035
  • Figure 83: Middle East & Africa Market Value Share and BPS Analysis by Product Type , 2025 and 2035
  • Figure 84: Middle East & Africa Market Y-o-Y Growth Comparison by Product Type , 2025-2035
  • Figure 85: Middle East & Africa Market Attractiveness Analysis by Product Type
  • Figure 86: Middle East & Africa Market Value Share and BPS Analysis by Pollutant Type, 2025 and 2035
  • Figure 87: Middle East & Africa Market Y-o-Y Growth Comparison by Pollutant Type, 2025-2035
  • Figure 88: Middle East & Africa Market Attractiveness Analysis by Pollutant Type
  • Figure 89: Middle East & Africa Market Value Share and BPS Analysis by End User, 2025 and 2035
  • Figure 90: Middle East & Africa Market Y-o-Y Growth Comparison by End User, 2025-2035
  • Figure 91: Middle East & Africa Market Attractiveness Analysis by End User
  • Figure 92: Global Market - Tier Structure Analysis
  • Figure 93: Global Market - Company Share Analysis
Dashboard
Dashboard
Dashboard
Dashboard
Dashboard
Dashboard

Full Research Suite comprises of:

Market outlook & trends analysis

Market outlook & trends analysis

Interviews & case studies

Interviews & case studies

Strategic recommendations

Strategic recommendations

Vendor profiles & capabilities analysis

Vendor profiles & capabilities analysis

5-year forecasts

5-year forecasts

8 regions and 60+ country-level data splits

8 regions and 60+ country-level data splits

Market segment data splits

Market segment data splits

12 months of continuous data updates

12 months of continuous data updates

DELIVERED AS:

PDF EXCEL ONLINE

Full Research Suite


$5000

$7500

$10000

Buy Report Now
Similar Industry Reports

Similar Industry Reports

Indoor Rotary High Voltage Disconnect Switch Market

Indoor Rotary High Voltage Disconnect Switch Market Size and Share Forecast Outlook 2025 to 2035

Indoor Cable Assemblies Market

Indoor Cable Assemblies Market Size and Share Forecast Outlook 2025 to 2035

Indoor Residential Switchgear Market

Indoor Residential Switchgear Market Size and Share Forecast Outlook 2025 to 2035

Indoor Location Market

Indoor Location Market Size and Share Forecast Outlook 2025 to 2035

Indoor Space Heater Market

Indoor Space Heater Market Size and Share Forecast Outlook 2025 to 2035

Indoor Farming Market

Indoor Farming Market Analysis - Size, Share, and Forecast 2025 to 2035

Indoor Smokehouses and Pig Roasters Market

Indoor Smokehouses & Pig Roasters Market – Smoked Meat Processing 2025 to 2035

Indoor Farming Market Share Analysis

A Detailed Global Analysis of Brand Share for the Indoor Farming Market

Smart Indoor Gardening System Market

Smart Indoor Gardening System Market Size and Share Forecast Outlook 2025 to 2035

Family/Indoor Entertainment Centres Market

Family/Indoor Entertainment Centres Market Report – Forecast 2017-2027

Cat Condos & Indoor Houses Market

Cat Condos & Indoor Houses Market Insights - Size & Trends 2025 to 2035

Airborne Molecular Contamination Control Services Market

Airborne Molecular Contamination Control Services Market Forecast and Outlook 2025 to 2035

Airflow Balancer Market

Airflow Balancer Market Size and Share Forecast Outlook 2025 to 2035

Aircraft Cabin Environment Sensor Market

Aircraft Cabin Environment Sensor Market Forecast and Outlook 2025 to 2035

Aircraft Flight Control System Market

Aircraft Flight Control System Market Size and Share Forecast Outlook 2025 to 2035

Airborne Radar Market

Airborne Radar Market Size and Share Forecast Outlook 2025 to 2035

Aircraft Electric Motor Market

Aircraft Electric Motor Market Forecast Outlook 2025 to 2035

Airport Ground Transportation Market

Airport Ground Transportation Market Forecast and Outlook 2025 to 2035

Airless Sprayer Accessories Market

Airless Sprayer Accessories Market Size and Share Forecast Outlook 2025 to 2035

Air Purge Valve Market

Air Purge Valve Market Size and Share Forecast Outlook 2025 to 2035

Future Market Insights

Indoor Air Quality Monitor Market

Chat With MaRIA

Chat With

MaRIA

Hi There, I am MaRIA, Your Market Research Intelligence Assistant. How may I help you?