Indoor Location Market
Demand for tracing objects in indoor locations and penetration of IoT devices boosting market growth
Indoor Location Market by Service Type, Technology, Software Tools, End Use, Application & Region - Forecast 2022 – 2032
Indoor Location Market Snapshot (2022-2032)
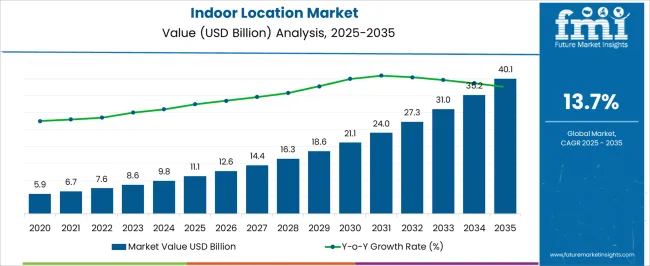
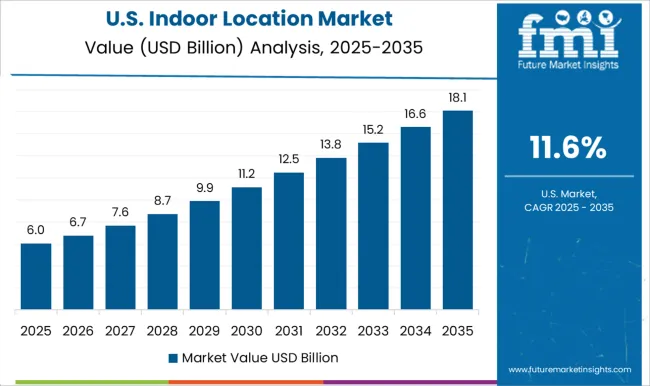
[300 Pages Report] The global indoor location market is expected to garner a market value of US$ 7530.5 Million in 2022 and is expected to accumulate a market value of US$ 28,500.5 Million by registering a CAGR of 14.2% in the forecast period 2022-2032. Growth of the indoor location market can be attributed to advancements in technology to trace objects or humans in indoor locations. The market for indoor location registered a CAGR of 11.5% in the historical period 2016-2021.
Data Points |
Key Statistics |
Indoor Location Market Value (2022) |
US$ 7530.5 Million |
Indoor Location Market Value (2032) |
US$ 28,500.5 Million |
Indoor Location Market CAGR (2022-2032) |
14.2% CAGR |
An indoor location is a system used to locate people or objects inside a building with the help of radio waves, acoustic signals, magnetic fields, and other sensory information which are collected through mobile devices. Indoor location is used for tracking of any object which is present in indoor and also known as indoor localization.
Indoor positioning system advanced technology is used for tracing objects which can locate objects or humans situated in a company with the help of radio waves or acoustic signals collected by handheld devices including mobile phones, and other devices.
Let us know your requirement to get
100% FREE customization
Indoor Location Demand Analysis (2016 to 2021) Vs Market Outlook (2022 to 2032)
The global demand for indoor location is projected to increase at a CAGR of 14.2% during the forecast period between 2022 and 2032, reaching a total of US$ 28,500.5 Million in 2032, according to a report from Future Market Insights (FMI). From 2016 to 2021, sales witnessed significant growth, registering a CAGR of 11.5%.
The use of indoor navigation is becoming prominent across various end user industries. The need for tracing objects, human and pathways has become prominent. In addition, the use of IoT devices is expected to bolster the growth of indoor location systems in the upcoming years.
Furthermore, deployment of indoor location technology has helped retailers to enhance their user experiences and provide proper navigation for objects or any locations. Indoor location solutions bring with them an opportunity for organizations to connect customers inside large indoor spaces with their brands, products, and partners, providing them with different ways to increase customer relationships and sales. The proliferation of various technologies, such as BLE and Wi-Fi, enables users to detect a person’s location within a specific range.
Which are Some Prominent Drivers of Indoor Location Market?
Usage of smartphones and IoT devices bolstering use of indoor location systems
The major factors driving the growth of indoor location market are consistent support to governments for confirming public safety, increased usage of smartphones, and inadequacy of GPS technology in indoor locations. Moreover, rising usage of smartphones with innovative mobile applications, mobile commerce, trend of digitalization, and technological advancements are boosting to the growth of the indoor location market.
In addition, the government awareness to have improved positioning technology for urban security segment and public safety are enhancing the demand for indoor location solutions. In indoor location market,
Find your sweet spots for generating winning opportunities in this market.
Talk to AnalystWhat are the Challenges Faced by the Indoor Location Market?
Stringent rules regarding privacy and data collection restraining market growth
Stringent rules and regulations pose one of the biggest challenges to the growth of the indoor location market. Government rules and regulations, such as the World Wide Web Consortium (W3C), open geospatial consortium, and Health Insurance Portability and Accountability Act (HIPAA), restrict the data collection, sharing, and use of location-based information.
Countries across the globe prioritize the security and privacy of their citizens, which leads to the implementation of regulations that restrict the use of location-based information. Thus. These factors are restraining the growth of indoor location market.
Region-Wise Insights
Demand for Customized Indoor Location Solutions Creating Lucrative Opportunities for Indoor Location Market in North America?
Increasing use of proximity-based solutions in retail sector bolstering growth
The indoor location market is expected to register healthy CAGR during the forecast period. North America is experiencing the rapid increase in the adoption of indoor location as a demand for customized indoor location solutions owing to the increasing use of proximity-based solutions in the retail sector in the region is rising at faster pace.
The North American region continue to account a significant share in overall indoor location market due to usage of mobile media by enterprises for promoting services and products and the increasing adoption of location-enabled searches by individual users. Thus, North America is expected to possess 40.6% market share for indoor location market.
Demand for Navigation Supporting Growth of Indoor Locations in Europe?
Development of commercial and residential sectors propelling growth of indoor locations
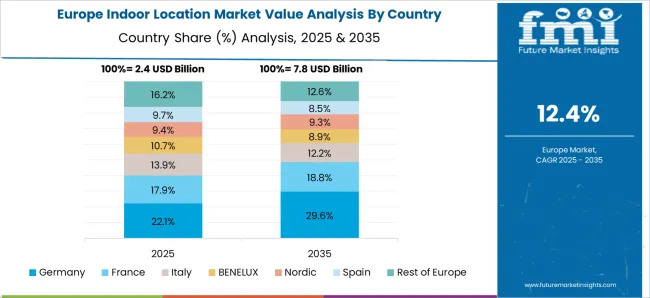
Indoor location market for Europe is also expected to witness steady growth during the forecast period primarily attributed to the growth of indoor location technologies coupled with demand for customization in offerings, especially in Germany and Italy.
In addition, rapid development of commercial and residential sector is positively influencing the use of indoor location. Thus, Europe is expected to hold 21.2% market share for indoor location market.

A unified Market Research Subscription Platform, built for today's disparate research needs.
Category-Wise Insights
Navigation in Indoor Location Bolstering Demand for Professional Services in Indoor Locations Market?
Shifting technological developments positively Influencing Market Growth
Professional services are majorly crucial and comprise solutions offered by the service providers to increase the awareness and growth of indoor location solutions and technology for attracting customers to stores and navigation.
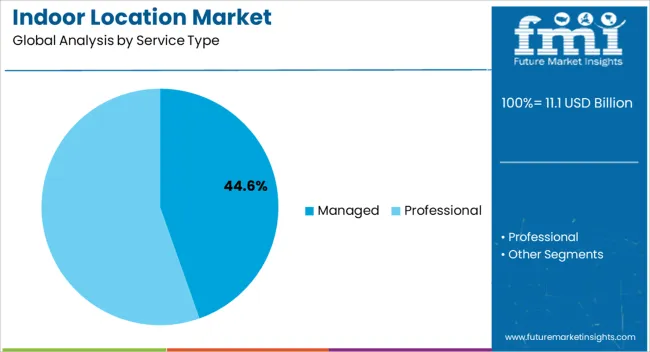
In terms of indoor location services segment, this segment is accounting a high adoption rate in the overall indoor location market owing to its requirement to flow with shifting technology that can be used for advance development in the market. Thus, by service type, professional services are expected to hold 55% market share for indoor location market.
Start-Ups for Indoor Location Market
Key players in the indoor location market are SIRL, IIWARI, Arara, Invento Robotics and ARWAY.
- Arara, a key player in the indoor location market is focusing on offering Wi-Fi analytics and indoor positioning solutions. The solutions are designed on received signal strength indicator systems, thus providing accuracy in results.
- IIWARI an ultra-wideband radio technology based indoor positioning systems. the company is focusing on collecting accurate data for route optimization and location-based marketing.
Market Competition
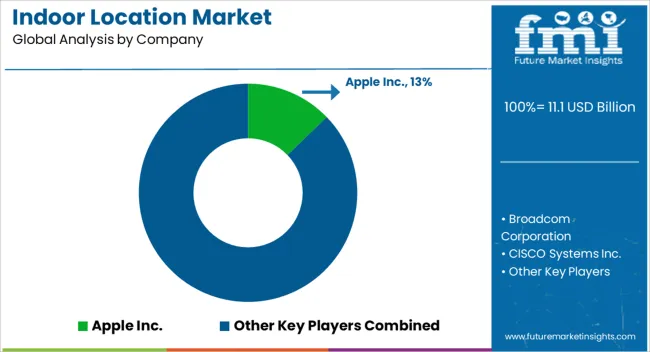
Key players in the indoor location market are Apple Inc., Broadcom Corporation, CISCO Systems Inc., Ericsson, Google Inc., Microsoft Corporation, Motorola Solutions, Nokia Corporation, STMicroelectronics N.V., Qualcomm and Others.
- Google Inc, a key player in the indoor location market is focusing on offering easy and accurate navigation in different locations that range from retail stores to airports. Universal icons and location accuracy is constantly updated by the company.
Report Scope
Report Attribute |
Details |
Market Value in 2022 |
US$ 7530.5 Million |
Market Value in 2032 |
US$ 28,500.5 Million |
Growth Rate |
CAGR of 14.2% from 2022 to 2032 |
Base Year for Estimation |
2021 |
Historical Data |
2016-2021 |
Forecast Period |
2022-2032 |
Quantitative Units |
Revenue in USD Million and CAGR from 2022-2032 |
Report Coverage |
Revenue Forecast, Volume Forecast, Company Ranking, Competitive Landscape, Growth Factors, Trends and Pricing Analysis |
Segments Covered |
|
Regions Covered |
|
Key Countries Profiled |
|
Key Companies Profiled |
|
Customization |
Available Upon Request |
Key Segments Profiled in the Indoor Location Industry Survey
Indoor Location by Service Type:
- Managed Indoor Location Services
- Professional Indoor Location Services
Indoor Location by Technology Type:
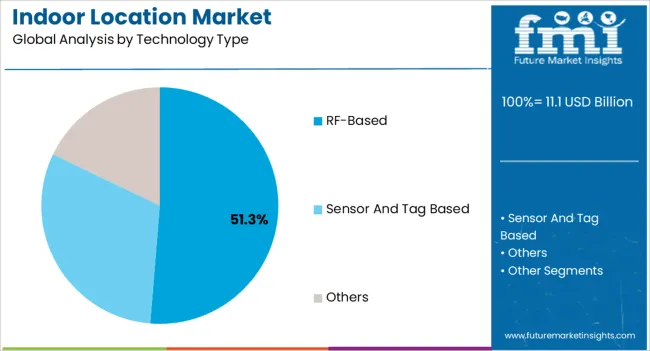
- RF-based Indoor Location
- Sensor and Tag Based Indoor Location
- Others Indoor Location Technology Types
Indoor Location by Software Tools Type:
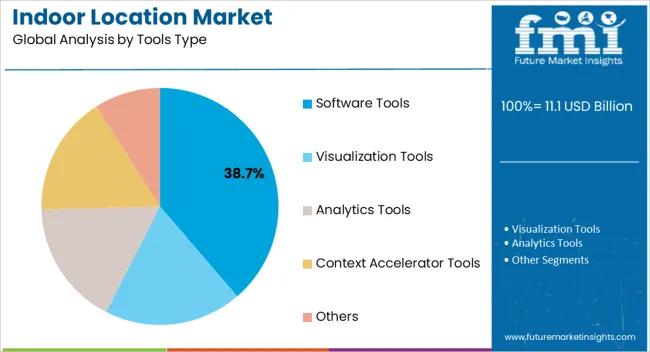
- Indoor Location Software Tools
- Indoor Location Visualization Tools
- Indoor Location Analytics Tools
- Context Indoor Location Accelerator Tools
- Other Indoor Location Software Tools
Indoor Location by End Use Type:
- Indoor Location for Transportation
- Indoor Location forHospitality
- Indoor Location for Entertainment
- Indoor Location for Shopping
- Indoor Location for Public Buildings
- Indoor Location for Other End Users
Indoor Location by Application:
- Indoor Location for Risk Management
- Indoor Location for Predictive Asset Analytics
- Indoor Location for Emergency Response Management
- Indoor Location for Remote Monitoring
- Indoor Location for Marketing and Customer Experience Management
- Indoor Location for Inventory Management
- Indoor Location for Other Applications
Indoor Location by Region:
- North America Indoor Location Market
- Latin America Indoor Location Market
- Europe Indoor Location Market
- East Asia Indoor Location Market
- South Asia Indoor Location Market
- Oceania Indoor Location Market
- Middle East & Africa Indoor Location Market
Frequently Asked Questions
What is the anticipated growth of the indoor location market until 2032?
FMI projects the global indoor location market to expand at a 14.2% value CAGR by 2032
Which region is forecast to be the most lucrative for indoor location market growth?
North America is expected to possess 40.6% market share for indoor location market.
Which are some prominent indoor location manufacturers?
Apple Inc., Broadcom Corporation, CISCO Systems Inc., Ericsson, Google Inc., Microsoft Corporation, Motorola Solutions, Nokia Corporation, STMicroelectronics N.V., Qualcomm, are some prominent indoor location manufacturers
Table of Content
1. Executive Summary 1.1. Global Market Outlook 1.2. Demand-side Trends 1.3. Supply-side Trends 1.4. Technology Roadmap Analysis 1.5. Analysis and Recommendations 2. Market Overview 2.1. Market Coverage / Taxonomy 2.2. Market Definition / Scope / Limitations 3. Market Background 3.1. Market Dynamics 3.1.1. Drivers 3.1.2. Restraints 3.1.3. Opportunity 3.1.4. Trends 3.2. Scenario Forecast 3.2.1. Demand in Optimistic Scenario 3.2.2. Demand in Likely Scenario 3.2.3. Demand in Conservative Scenario 3.3. Opportunity Map Analysis 3.4. Investment Feasibility Matrix 3.5. PESTLE and Porter’s Analysis 3.6. Regulatory Landscape 3.6.1. By Key Regions 3.6.2. By Key Countries 3.7. Regional Parent Market Outlook 4. Global Indoor Location Market Analysis 2016-2021 and Forecast, 2022-2032 4.1. Historical Market Size Value (US$ Mn) Analysis, 2016-2021 4.2. Current and Future Market Size Value (US$ Mn) Projections, 2022-2032 4.2.1. Y-o-Y Growth Trend Analysis 4.2.2. Absolute $ Opportunity Analysis 5. Global Indoor Location Market Analysis 2016-2021 and Forecast 2022-2032, By Service Type 5.1. Introduction / Key Findings 5.2. Historical Market Size Value (US$ Mn) Analysis By Service Type, 2016-2021 5.3. Current and Future Market Size Value (US$ Mn) Analysis and Forecast By Service Type, 2022-2032 5.3.1. Manages services 5.3.2. Professional services 5.4. Y-o-Y Growth Trend Analysis By Service Type, 2016-2021 5.5. Absolute $ Opportunity Analysis By Service Type, 2022-2032 6. Global Indoor Location Market Analysis 2016-2021 and Forecast 2022-2032, By Technology Type 6.1. Introduction / Key Findings 6.2. Historical Market Size Value (US$ Mn) Analysis By Technology Type, 2016-2021 6.3. Current and Future Market Size Value (US$ Mn) Analysis and Forecast By Technology Type, 2022-2032 6.3.1. RF based 6.3.2. Sensor and Tag Based 6.3.3. Others 6.4. Y-o-Y Growth Trend Analysis By Technology Type, 2016-2021 6.5. Absolute $ Opportunity Analysis By Technology Type, 2022-2032 7. Global Indoor Location Market Analysis 2016-2021 and Forecast 2022-2032, By Software Tools Type 7.1. Introduction / Key Findings 7.2. Historical Market Size Value (US$ Mn) Analysis By Software Tools Type , 2016-2021 7.3. Current and Future Market Size Value (US$ Mn) Analysis and Forecast By Software Tools Type , 2022-2032 7.3.1. Software Tools 7.3.2. Visualization 7.3.3. Location Analytics 7.3.4. Context Accelerator 7.3.5. Others 7.4. Y-o-Y Growth Trend Analysis By Software Tools Type , 2016-2021 7.5. Absolute $ Opportunity Analysis By Software Tools Type , 2022-2032 8. Global Indoor Location Market Analysis 2016-2021 and Forecast 2022-2032, By End-Use Type 8.1. Introduction / Key Findings 8.2. Historical Market Size Value (US$ Mn) Analysis By End-Use Type, 2016-2021 8.3. Current and Future Market Size Value (US$ Mn) Analysis and Forecast By End-Use Type, 2022-2032 8.3.1. Transportation 8.3.2. Hospitality 8.3.3. Entertainment 8.3.4. Shopping 8.3.5. Public Buildings 8.3.6. Others 8.4. Y-o-Y Growth Trend Analysis By End-Use Type, 2016-2021 8.5. Absolute $ Opportunity Analysis By End-Use Type, 2022-2032 9. Global Indoor Location Market Analysis 2016-2021 and Forecast 2022-2032, By Type of Application 9.1. Introduction / Key Findings 9.2. Historical Market Size Value (US$ Mn) Analysis By Type of Application, 2016-2021 9.3. Current and Future Market Size Value (US$ Mn) Analysis and Forecast By Type of Application, 2022-2032 9.3.1. Risk Management 9.3.2. Predictive Asset Analytics 9.3.3. Emergency Response Management 9.3.4. Remote Monitoring 9.3.5. Marketing and Customer Experience Management 9.3.6. Inventory Management 9.3.7. Others 9.4. Y-o-Y Growth Trend Analysis By Type of Application, 2016-2021 9.5. Absolute $ Opportunity Analysis By Type of Application, 2022-2032 10. Global Indoor Location Market Analysis 2016-2021 and Forecast 2022-2032, By Building Size 10.1. Introduction / Key Findings 10.2. Historical Market Size Value (US$ Mn) Analysis By Building Size, 2016-2021 10.3. Current and Future Market Size Value (US$ Mn) Analysis and Forecast By Building Size, 2022-2032 10.3.1. Large and medium 10.3.2. Small 10.4. Y-o-Y Growth Trend Analysis By Building Size, 2016-2021 10.5. Absolute $ Opportunity Analysis By Building Size, 2022-2032 11. Global Indoor Location Market Analysis 2016-2021 and Forecast 2022-2032, By Region 11.1. Introduction 11.2. Historical Market Size Value (US$ Mn) Analysis By Region, 2016-2021 11.3. Current Market Size Value (US$ Mn) Analysis and Forecast By Region, 2022-2032 11.3.1. North America 11.3.2. Latin America 11.3.3. Europe 11.3.4. South Asia 11.3.5. East Asia 11.3.6. Oceania 11.3.7. MEA 11.4. Market Attractiveness Analysis By Region 12. North America Indoor Location Market Analysis 2016-2021 and Forecast 2022-2032, By Country 12.1. Historical Market Size Value (US$ Mn) Trend Analysis By Market Taxonomy, 2016-2021 12.2. Market Size Value (US$ Mn) Forecast By Market Taxonomy, 2022-2032 12.2.1. By Country 12.2.1.1. U.S. 12.2.1.2. Canada 12.2.2. By Service Type 12.2.3. By Technology Type 12.2.4. By Software Tools Type 12.2.5. By End-Use Type 12.2.6. By Type of Application 12.2.7. By Building Size 12.3. Market Attractiveness Analysis 12.3.1. By Country 12.3.2. By Service Type 12.3.3. By Technology Type 12.3.4. By Software Tools Type 12.3.5. By End-Use Type 12.3.6. By Type of Application 12.3.7. By Building Size 12.4. Key Takeaways 13. Latin America Indoor Location Market Analysis 2016-2021 and Forecast 2022-2032, By Country 13.1. Historical Market Size Value (US$ Mn) Trend Analysis By Market Taxonomy, 2016-2021 13.2. Market Size Value (US$ Mn) Forecast By Market Taxonomy, 2022-2032 13.2.1. By Country 13.2.1.1. Brazil 13.2.1.2. Mexico 13.2.1.3. Rest of Latin America 13.2.2. By Service Type 13.2.3. By Technology Type 13.2.4. By Software Tools Type 13.2.5. By End-Use Type 13.2.6. By Type of Application 13.2.7. By Building Size 13.3. Market Attractiveness Analysis 13.3.1. By Country 13.3.2. By Service Type 13.3.3. By Technology Type 13.3.4. By Software Tools Type 13.3.5. By End-Use Type 13.3.6. By Type of Application 13.3.7. By Building Size 13.4. Key Takeaways 14. Europe Indoor Location Market Analysis 2016-2021 and Forecast 2022-2032, By Country 14.1. Historical Market Size Value (US$ Mn) Trend Analysis By Market Taxonomy, 2016-2021 14.2. Market Size Value (US$ Mn) Forecast By Market Taxonomy, 2022-2032 14.2.1. By Country 14.2.1.1. Germany 14.2.1.2. U.K. 14.2.1.3. France 14.2.1.4. Spain 14.2.1.5. Italy 14.2.1.6. Rest of Europe 14.2.2. By Service Type 14.2.3. By Technology Type 14.2.4. By Software Tools Type 14.2.5. By End-Use Type 14.2.6. By Type of Application 14.2.7. By Building Size 14.3. Market Attractiveness Analysis 14.3.1. By Country 14.3.2. By Service Type 14.3.3. By Technology Type 14.3.4. By Software Tools Type 14.3.5. By End-Use Type 14.3.6. By Type of Application 14.3.7. By Building Size 14.4. Key Takeaways 15. South Asia Indoor Location Market Analysis 2016-2021 and Forecast 2022-2032, By Country 15.1. Historical Market Size Value (US$ Mn) Trend Analysis By Market Taxonomy, 2016-2021 15.2. Market Size Value (US$ Mn) Forecast By Market Taxonomy, 2022-2032 15.2.1. By Country 15.2.1.1. India 15.2.1.2. Malaysia 15.2.1.3. Singapore 15.2.1.4. Thailand 15.2.1.5. Rest of South Asia 15.2.2. By Service Type 15.2.3. By Technology Type 15.2.4. By Software Tools Type 15.2.5. By End-Use Type 15.2.6. By Type of Application 15.2.7. By Building Size 15.3. Market Attractiveness Analysis 15.3.1. By Country 15.3.2. By Service Type 15.3.3. By Technology Type 15.3.4. By Software Tools Type 15.3.5. By End-Use Type 15.3.6. By Type of Application 15.3.7. By Building Size 15.4. Key Takeaways 16. East Asia Indoor Location Market Analysis 2016-2021 and Forecast 2022-2032, By Country 16.1. Historical Market Size Value (US$ Mn) Trend Analysis By Market Taxonomy, 2016-2021 16.2. Market Size Value (US$ Mn) Forecast By Market Taxonomy, 2022-2032 16.2.1. By Country 16.2.1.1. China 16.2.1.2. Japan 16.2.1.3. South Korea 16.2.2. By Service Type 16.2.3. By Technology Type 16.2.4. By Software Tools Type 16.2.5. By End-Use Type 16.2.6. By Type of Application 16.2.7. By Building Size 16.3. Market Attractiveness Analysis 16.3.1. By Country 16.3.2. By Service Type 16.3.3. By Technology Type 16.3.4. By Software Tools Type 16.3.5. By End-Use Type 16.3.6. By Type of Application 16.3.7. By Building Size 16.4. Key Takeaways 17. Oceania Indoor Location Market Analysis 2016-2021 and Forecast 2022-2032, By Country 17.1. Historical Market Size Value (US$ Mn) Trend Analysis By Market Taxonomy, 2016-2021 17.2. Market Size Value (US$ Mn) Forecast By Market Taxonomy, 2022-2032 17.2.1. By Country 17.2.1.1. Australia 17.2.1.2. New Zealand 17.2.2. By Service Type 17.2.3. By Technology Type 17.2.4. By Software Tools Type 17.2.5. By End-Use Type 17.2.6. By Type of Application 17.2.7. By Building Size 17.3. Market Attractiveness Analysis 17.3.1. By Country 17.3.2. By Service Type 17.3.3. By Technology Type 17.3.4. By Software Tools Type 17.3.5. By End-Use Type 17.3.6. By Type of Application 17.3.7. By Building Size 17.4. Key Takeaways 18. MEA Indoor Location Market Analysis 2016-2021 and Forecast 2022-2032, By Country 18.1. Historical Market Size Value (US$ Mn) Trend Analysis By Market Taxonomy, 2016-2021 18.2. Market Size Value (US$ Mn) Forecast By Market Taxonomy, 2022-2032 18.2.1. By Country 18.2.1.1. GCC Countries 18.2.1.2. South Africa 18.2.1.3. Israel 18.2.1.4. Rest of MEA 18.2.2. By Service Type 18.2.3. By Technology Type 18.2.4. By Software Tools Type 18.2.5. By End-Use Type 18.2.6. By Type of Application 18.2.7. By Building Size 18.3. Market Attractiveness Analysis 18.3.1. By Country 18.3.2. By Service Type 18.3.3. By Technology Type 18.3.4. By Software Tools Type 18.3.5. By End-Use Type 18.3.6. By Type of Application 18.3.7. By Building Size 18.4. Key Takeaways 19. Key Countries Indoor Location Market Analysis 19.1. U.S. 19.1.1. Pricing Analysis 19.1.2. Market Share Analysis, 2021 19.1.2.1. By Service Type 19.1.2.2. By Technology Type 19.1.2.3. By Software Tools Type 19.1.2.4. By End-Use Type 19.1.2.5. By Type of Application 19.1.2.6. By Building Size 19.2. Canada 19.2.1. Pricing Analysis 19.2.2. Market Share Analysis, 2021 19.2.2.1. By Service Type 19.2.2.2. By Technology Type 19.2.2.3. By Software Tools Type 19.2.2.4. By End-Use Type 19.2.2.5. By Type of Application 19.2.2.6. By Building Size 19.3. Brazil 19.3.1. Pricing Analysis 19.3.2. Market Share Analysis, 2021 19.3.2.1. By Service Type 19.3.2.2. By Technology Type 19.3.2.3. By Software Tools Type 19.3.2.4. By End-Use Type 19.3.2.5. By Type of Application 19.3.2.6. By Building Size 19.4. Mexico 19.4.1. Pricing Analysis 19.4.2. Market Share Analysis, 2021 19.4.2.1. By Service Type 19.4.2.2. By Technology Type 19.4.2.3. By Software Tools Type 19.4.2.4. By End-Use Type 19.4.2.5. By Type of Application 19.4.2.6. By Building Size 19.5. Germany 19.5.1. Pricing Analysis 19.5.2. Market Share Analysis, 2021 19.5.2.1. By Service Type 19.5.2.2. By Technology Type 19.5.2.3. By Software Tools Type 19.5.2.4. By End-Use Type 19.5.2.5. By Type of Application 19.5.2.6. By Building Size 19.6. U.K. 19.6.1. Pricing Analysis 19.6.2. Market Share Analysis, 2021 19.6.2.1. By Service Type 19.6.2.2. By Technology Type 19.6.2.3. By Software Tools Type 19.6.2.4. By End-Use Type 19.6.2.5. By Type of Application 19.6.2.6. By Building Size 19.7. France 19.7.1. Pricing Analysis 19.7.2. Market Share Analysis, 2021 19.7.2.1. By Service Type 19.7.2.2. By Technology Type 19.7.2.3. By Software Tools Type 19.7.2.4. By End-Use Type 19.7.2.5. By Type of Application 19.7.2.6. By Building Size 19.8. Spain 19.8.1. Pricing Analysis 19.8.2. Market Share Analysis, 2021 19.8.2.1. By Service Type 19.8.2.2. By Technology Type 19.8.2.3. By Software Tools Type 19.8.2.4. By End-Use Type 19.8.2.5. By Type of Application 19.8.2.6. By Building Size 19.9. Italy 19.9.1. Pricing Analysis 19.9.2. Market Share Analysis, 2021 19.9.2.1. By Service Type 19.9.2.2. By Technology Type 19.9.2.3. By Software Tools Type 19.9.2.4. By End-Use Type 19.9.2.5. By Type of Application 19.9.2.6. By Building Size 19.10. India 19.10.1. Pricing Analysis 19.10.2. Market Share Analysis, 2021 19.10.2.1. By Service Type 19.10.2.2. By Technology Type 19.10.2.3. By Software Tools Type 19.10.2.4. By End-Use Type 19.10.2.5. By Type of Application 19.10.2.6. By Building Size 19.11. Malaysia 19.11.1. Pricing Analysis 19.11.2. Market Share Analysis, 2021 19.11.2.1. By Service Type 19.11.2.2. By Technology Type 19.11.2.3. By Software Tools Type 19.11.2.4. By End-Use Type 19.11.2.5. By Type of Application 19.11.2.6. By Building Size 19.12. Singapore 19.12.1. Pricing Analysis 19.12.2. Market Share Analysis, 2021 19.12.2.1. By Service Type 19.12.2.2. By Technology Type 19.12.2.3. By Software Tools Type 19.12.2.4. By End-Use Type 19.12.2.5. By Type of Application 19.12.2.6. By Building Size 19.13. Thailand 19.13.1. Pricing Analysis 19.13.2. Market Share Analysis, 2021 19.13.2.1. By Service Type 19.13.2.2. By Technology Type 19.13.2.3. By Software Tools Type 19.13.2.4. By End-Use Type 19.13.2.5. By Type of Application 19.13.2.6. By Building Size 19.14. China 19.14.1. Pricing Analysis 19.14.2. Market Share Analysis, 2021 19.14.2.1. By Service Type 19.14.2.2. By Technology Type 19.14.2.3. By Software Tools Type 19.14.2.4. By End-Use Type 19.14.2.5. By Type of Application 19.14.2.6. By Building Size 19.15. Japan 19.15.1. Pricing Analysis 19.15.2. Market Share Analysis, 2021 19.15.2.1. By Service Type 19.15.2.2. By Technology Type 19.15.2.3. By Software Tools Type 19.15.2.4. By End-Use Type 19.15.2.5. By Type of Application 19.15.2.6. By Building Size 19.16. South Korea 19.16.1. Pricing Analysis 19.16.2. Market Share Analysis, 2021 19.16.2.1. By Service Type 19.16.2.2. By Technology Type 19.16.2.3. By Software Tools Type 19.16.2.4. By End-Use Type 19.16.2.5. By Type of Application 19.16.2.6. By Building Size 19.17. Australia 19.17.1. Pricing Analysis 19.17.2. Market Share Analysis, 2021 19.17.2.1. By Service Type 19.17.2.2. By Technology Type 19.17.2.3. By Software Tools Type 19.17.2.4. By End-Use Type 19.17.2.5. By Type of Application 19.17.2.6. By Building Size 19.18. New Zealand 19.18.1. Pricing Analysis 19.18.2. Market Share Analysis, 2021 19.18.2.1. By Service Type 19.18.2.2. By Technology Type 19.18.2.3. By Software Tools Type 19.18.2.4. By End-Use Type 19.18.2.5. By Type of Application 19.18.2.6. By Building Size 19.19. GCC Countries 19.19.1. Pricing Analysis 19.19.2. Market Share Analysis, 2021 19.19.2.1. By Service Type 19.19.2.2. By Technology Type 19.19.2.3. By Software Tools Type 19.19.2.4. By End-Use Type 19.19.2.5. By Type of Application 19.19.2.6. By Building Size 19.20. South Africa 19.20.1. Pricing Analysis 19.20.2. Market Share Analysis, 2021 19.20.2.1. By Service Type 19.20.2.2. By Technology Type 19.20.2.3. By Software Tools Type 19.20.2.4. By End-Use Type 19.20.2.5. By Type of Application 19.20.2.6. By Building Size 19.21. Israel 19.21.1. Pricing Analysis 19.21.2. Market Share Analysis, 2021 19.21.2.1. By Service Type 19.21.2.2. By Technology Type 19.21.2.3. By Software Tools Type 19.21.2.4. By End-Use Type 19.21.2.5. By Type of Application 19.21.2.6. By Building Size 20. Market Structure Analysis 20.1. Competition Dashboard 20.2. Competition Benchmarking 20.3. Market Share Analysis of Top Players 20.3.1. By Regional 20.3.2. By Service Type 20.3.3. By Technology Type 20.3.4. By Software Tools Type 20.3.5. By End-Use Type 20.3.6. By Type of Application 20.3.7. By Building Size 21. Competition Analysis 21.1. Competition Deep Dive 21.1.1. Apple Inc. 21.1.1.1. Overview 21.1.1.2. Product Portfolio 21.1.1.3. Profitability by Market Segments 21.1.1.4. Sales Footprint 21.1.1.5. Strategy Overview 21.1.1.5.1. Marketing Strategy 21.1.2. Broadcom Corporation 21.1.2.1. Overview 21.1.2.2. Product Portfolio 21.1.2.3. Profitability by Market Segments 21.1.2.4. Sales Footprint 21.1.2.5. Strategy Overview 21.1.2.5.1. Marketing Strategy 21.1.3. CISCO Systems Inc. 21.1.3.1. Overview 21.1.3.2. Product Portfolio 21.1.3.3. Profitability by Market Segments 21.1.3.4. Sales Footprint 21.1.3.5. Strategy Overview 21.1.3.5.1. Marketing Strategy 21.1.4. Ericsson, Google Inc. 21.1.4.1. Overview 21.1.4.2. Product Portfolio 21.1.4.3. Profitability by Market Segments 21.1.4.4. Sales Footprint 21.1.4.5. Strategy Overview 21.1.4.5.1. Marketing Strategy 21.1.5. Microsoft Corporation 21.1.5.1. Overview 21.1.5.2. Product Portfolio 21.1.5.3. Profitability by Market Segments 21.1.5.4. Sales Footprint 21.1.5.5. Strategy Overview 21.1.5.5.1. Marketing Strategy 21.1.6. Motorola Solutions 21.1.6.1. Overview 21.1.6.2. Product Portfolio 21.1.6.3. Profitability by Market Segments 21.1.6.4. Sales Footprint 21.1.6.5. Strategy Overview 21.1.6.5.1. Marketing Strategy 21.1.7. Nokia Corporation 21.1.7.1. Overview 21.1.7.2. Product Portfolio 21.1.7.3. Profitability by Market Segments 21.1.7.4. Sales Footprint 21.1.7.5. Strategy Overview 21.1.7.5.1. Marketing Strategy 21.1.8. STMicroelectronics N.V. 21.1.8.1. Overview 21.1.8.2. Product Portfolio 21.1.8.3. Profitability by Market Segments 21.1.8.4. Sales Footprint 21.1.8.5. Strategy Overview 21.1.8.5.1. Marketing Strategy 21.1.9. Qualcomm. 21.1.9.1. Overview 21.1.9.2. Product Portfolio 21.1.9.3. Profitability by Market Segments 21.1.9.4. Sales Footprint 21.1.9.5. Strategy Overview 21.1.9.5.1. Marketing Strategy 21.1.10. Zebra Technologies 21.1.10.1. Overview 21.1.10.2. Product Portfolio 21.1.10.3. Profitability by Market Segments 21.1.10.4. Sales Footprint 21.1.10.5. Strategy Overview 21.1.10.5.1. Marketing Strategy 22. Assumptions & Acronyms Used 23. Research Methodology
Let us know your requirement to get
100% FREE customization
List of Tables
Table 1: Global Indoor Location Market Value (US$ Mn) Forecast by Region, 2016-2032 Table 2: Global Indoor Location Market Value (US$ Mn) Forecast by Service Type, 2016-2032 Table 3: Global Indoor Location Market Value (US$ Mn) Forecast by Technology Type, 2016-2032 Table 4: Global Indoor Location Market Value (US$ Mn) Forecast by Software Tools Type , 2016-2032 Table 5: Global Indoor Location Market Value (US$ Mn) Forecast by End-Use Type, 2016-2032 Table 6: Global Indoor Location Market Value (US$ Mn) Forecast by Type of Application, 2016-2032 Table 7: Global Indoor Location Market Value (US$ Mn) Forecast by Building Size, 2016-2032 Table 8: North America Indoor Location Market Value (US$ Mn) Forecast by Country, 2016-2032 Table 9: North America Indoor Location Market Value (US$ Mn) Forecast by Service Type, 2016-2032 Table 10: North America Indoor Location Market Value (US$ Mn) Forecast by Technology Type, 2016-2032 Table 11: North America Indoor Location Market Value (US$ Mn) Forecast by Software Tools Type , 2016-2032 Table 12: North America Indoor Location Market Value (US$ Mn) Forecast by End-Use Type, 2016-2032 Table 13: North America Indoor Location Market Value (US$ Mn) Forecast by Type of Application, 2016-2032 Table 14: North America Indoor Location Market Value (US$ Mn) Forecast by Building Size, 2016-2032 Table 15: Latin America Indoor Location Market Value (US$ Mn) Forecast by Country, 2016-2032 Table 16: Latin America Indoor Location Market Value (US$ Mn) Forecast by Service Type, 2016-2032 Table 17: Latin America Indoor Location Market Value (US$ Mn) Forecast by Technology Type, 2016-2032 Table 18: Latin America Indoor Location Market Value (US$ Mn) Forecast by Software Tools Type , 2016-2032 Table 19: Latin America Indoor Location Market Value (US$ Mn) Forecast by End-Use Type, 2016-2032 Table 20: Latin America Indoor Location Market Value (US$ Mn) Forecast by Type of Application, 2016-2032 Table 21: Latin America Indoor Location Market Value (US$ Mn) Forecast by Building Size, 2016-2032 Table 22: Europe Indoor Location Market Value (US$ Mn) Forecast by Country, 2016-2032 Table 23: Europe Indoor Location Market Value (US$ Mn) Forecast by Service Type, 2016-2032 Table 24: Europe Indoor Location Market Value (US$ Mn) Forecast by Technology Type, 2016-2032 Table 25: Europe Indoor Location Market Value (US$ Mn) Forecast by Software Tools Type , 2016-2032 Table 26: Europe Indoor Location Market Value (US$ Mn) Forecast by End-Use Type, 2016-2032 Table 27: Europe Indoor Location Market Value (US$ Mn) Forecast by Type of Application, 2016-2032 Table 28: Europe Indoor Location Market Value (US$ Mn) Forecast by Building Size, 2016-2032 Table 29: South Asia Indoor Location Market Value (US$ Mn) Forecast by Country, 2016-2032 Table 30: South Asia Indoor Location Market Value (US$ Mn) Forecast by Service Type, 2016-2032 Table 31: South Asia Indoor Location Market Value (US$ Mn) Forecast by Technology Type, 2016-2032 Table 32: South Asia Indoor Location Market Value (US$ Mn) Forecast by Software Tools Type , 2016-2032 Table 33: South Asia Indoor Location Market Value (US$ Mn) Forecast by End-Use Type, 2016-2032 Table 34: South Asia Indoor Location Market Value (US$ Mn) Forecast by Type of Application, 2016-2032 Table 35: South Asia Indoor Location Market Value (US$ Mn) Forecast by Building Size, 2016-2032 Table 36: East Asia Indoor Location Market Value (US$ Mn) Forecast by Country, 2016-2032 Table 37: East Asia Indoor Location Market Value (US$ Mn) Forecast by Service Type, 2016-2032 Table 38: East Asia Indoor Location Market Value (US$ Mn) Forecast by Technology Type, 2016-2032 Table 39: East Asia Indoor Location Market Value (US$ Mn) Forecast by Software Tools Type , 2016-2032 Table 40: East Asia Indoor Location Market Value (US$ Mn) Forecast by End-Use Type, 2016-2032 Table 41: East Asia Indoor Location Market Value (US$ Mn) Forecast by Type of Application, 2016-2032 Table 42: East Asia Indoor Location Market Value (US$ Mn) Forecast by Building Size, 2016-2032 Table 43: Oceania Indoor Location Market Value (US$ Mn) Forecast by Country, 2016-2032 Table 44: Oceania Indoor Location Market Value (US$ Mn) Forecast by Service Type, 2016-2032 Table 45: Oceania Indoor Location Market Value (US$ Mn) Forecast by Technology Type, 2016-2032 Table 46: Oceania Indoor Location Market Value (US$ Mn) Forecast by Software Tools Type , 2016-2032 Table 47: Oceania Indoor Location Market Value (US$ Mn) Forecast by End-Use Type, 2016-2032 Table 48: Oceania Indoor Location Market Value (US$ Mn) Forecast by Type of Application, 2016-2032 Table 49: Oceania Indoor Location Market Value (US$ Mn) Forecast by Building Size, 2016-2032 Table 50: MEA Indoor Location Market Value (US$ Mn) Forecast by Country, 2016-2032 Table 51: MEA Indoor Location Market Value (US$ Mn) Forecast by Service Type, 2016-2032 Table 52: MEA Indoor Location Market Value (US$ Mn) Forecast by Technology Type, 2016-2032 Table 53: MEA Indoor Location Market Value (US$ Mn) Forecast by Software Tools Type , 2016-2032 Table 54: MEA Indoor Location Market Value (US$ Mn) Forecast by End-Use Type, 2016-2032 Table 55: MEA Indoor Location Market Value (US$ Mn) Forecast by Type of Application, 2016-2032 Table 56: MEA Indoor Location Market Value (US$ Mn) Forecast by Building Size, 2016-2032
Find your sweet spots for generating winning opportunities in this market.
Talk to AnalystList of Charts
Figure 1: Global Indoor Location Market Value (US$ Mn) by Service Type, 2022-2032 Figure 2: Global Indoor Location Market Value (US$ Mn) by Technology Type, 2022-2032 Figure 3: Global Indoor Location Market Value (US$ Mn) by Software Tools Type , 2022-2032 Figure 4: Global Indoor Location Market Value (US$ Mn) by End-Use Type, 2022-2032 Figure 5: Global Indoor Location Market Value (US$ Mn) by Type of Application, 2022-2032 Figure 6: Global Indoor Location Market Value (US$ Mn) by Building Size, 2022-2032 Figure 7: Global Indoor Location Market Value (US$ Mn) by Region, 2022-2032 Figure 8: Global Indoor Location Market Value (US$ Mn) Analysis by Region, 2016-2032 Figure 9: Global Indoor Location Market Value Share (%) and BPS Analysis by Region, 2022-2032 Figure 10: Global Indoor Location Market Y-o-Y Growth (%) Projections by Region, 2022-2032 Figure 11: Global Indoor Location Market Value (US$ Mn) Analysis by Service Type, 2016-2032 Figure 12: Global Indoor Location Market Value Share (%) and BPS Analysis by Service Type, 2022-2032 Figure 13: Global Indoor Location Market Y-o-Y Growth (%) Projections by Service Type, 2022-2032 Figure 14: Global Indoor Location Market Value (US$ Mn) Analysis by Technology Type, 2016-2032 Figure 15: Global Indoor Location Market Value Share (%) and BPS Analysis by Technology Type, 2022-2032 Figure 16: Global Indoor Location Market Y-o-Y Growth (%) Projections by Technology Type, 2022-2032 Figure 17: Global Indoor Location Market Value (US$ Mn) Analysis by Software Tools Type , 2016-2032 Figure 18: Global Indoor Location Market Value Share (%) and BPS Analysis by Software Tools Type , 2022-2032 Figure 19: Global Indoor Location Market Y-o-Y Growth (%) Projections by Software Tools Type , 2022-2032 Figure 20: Global Indoor Location Market Value (US$ Mn) Analysis by End-Use Type, 2016-2032 Figure 21: Global Indoor Location Market Value Share (%) and BPS Analysis by End-Use Type, 2022-2032 Figure 22: Global Indoor Location Market Y-o-Y Growth (%) Projections by End-Use Type, 2022-2032 Figure 23: Global Indoor Location Market Value (US$ Mn) Analysis by Type of Application, 2016-2032 Figure 24: Global Indoor Location Market Value Share (%) and BPS Analysis by Type of Application, 2022-2032 Figure 25: Global Indoor Location Market Y-o-Y Growth (%) Projections by Type of Application, 2022-2032 Figure 26: Global Indoor Location Market Value (US$ Mn) Analysis by Building Size, 2016-2032 Figure 27: Global Indoor Location Market Value Share (%) and BPS Analysis by Building Size, 2022-2032 Figure 28: Global Indoor Location Market Y-o-Y Growth (%) Projections by Building Size, 2022-2032 Figure 29: Global Indoor Location Market Attractiveness by Service Type, 2022-2032 Figure 30: Global Indoor Location Market Attractiveness by Technology Type, 2022-2032 Figure 31: Global Indoor Location Market Attractiveness by Software Tools Type , 2022-2032 Figure 32: Global Indoor Location Market Attractiveness by End-Use Type, 2022-2032 Figure 33: Global Indoor Location Market Attractiveness by Type of Application, 2022-2032 Figure 34: Global Indoor Location Market Attractiveness by Building Size, 2022-2032 Figure 35: Global Indoor Location Market Attractiveness by Region, 2022-2032 Figure 36: North America Indoor Location Market Value (US$ Mn) by Service Type, 2022-2032 Figure 37: North America Indoor Location Market Value (US$ Mn) by Technology Type, 2022-2032 Figure 38: North America Indoor Location Market Value (US$ Mn) by Software Tools Type , 2022-2032 Figure 39: North America Indoor Location Market Value (US$ Mn) by End-Use Type, 2022-2032 Figure 40: North America Indoor Location Market Value (US$ Mn) by Type of Application, 2022-2032 Figure 41: North America Indoor Location Market Value (US$ Mn) by Building Size, 2022-2032 Figure 42: North America Indoor Location Market Value (US$ Mn) by Country, 2022-2032 Figure 43: North America Indoor Location Market Value (US$ Mn) Analysis by Country, 2016-2032 Figure 44: North America Indoor Location Market Value Share (%) and BPS Analysis by Country, 2022-2032 Figure 45: North America Indoor Location Market Y-o-Y Growth (%) Projections by Country, 2022-2032 Figure 46: North America Indoor Location Market Value (US$ Mn) Analysis by Service Type, 2016-2032 Figure 47: North America Indoor Location Market Value Share (%) and BPS Analysis by Service Type, 2022-2032 Figure 48: North America Indoor Location Market Y-o-Y Growth (%) Projections by Service Type, 2022-2032 Figure 49: North America Indoor Location Market Value (US$ Mn) Analysis by Technology Type, 2016-2032 Figure 50: North America Indoor Location Market Value Share (%) and BPS Analysis by Technology Type, 2022-2032 Figure 51: North America Indoor Location Market Y-o-Y Growth (%) Projections by Technology Type, 2022-2032 Figure 52: North America Indoor Location Market Value (US$ Mn) Analysis by Software Tools Type , 2016-2032 Figure 53: North America Indoor Location Market Value Share (%) and BPS Analysis by Software Tools Type , 2022-2032 Figure 54: North America Indoor Location Market Y-o-Y Growth (%) Projections by Software Tools Type , 2022-2032 Figure 55: North America Indoor Location Market Value (US$ Mn) Analysis by End-Use Type, 2016-2032 Figure 56: North America Indoor Location Market Value Share (%) and BPS Analysis by End-Use Type, 2022-2032 Figure 57: North America Indoor Location Market Y-o-Y Growth (%) Projections by End-Use Type, 2022-2032 Figure 58: North America Indoor Location Market Value (US$ Mn) Analysis by Type of Application, 2016-2032 Figure 59: North America Indoor Location Market Value Share (%) and BPS Analysis by Type of Application, 2022-2032 Figure 60: North America Indoor Location Market Y-o-Y Growth (%) Projections by Type of Application, 2022-2032 Figure 61: North America Indoor Location Market Value (US$ Mn) Analysis by Building Size, 2016-2032 Figure 62: North America Indoor Location Market Value Share (%) and BPS Analysis by Building Size, 2022-2032 Figure 63: North America Indoor Location Market Y-o-Y Growth (%) Projections by Building Size, 2022-2032 Figure 64: North America Indoor Location Market Attractiveness by Service Type, 2022-2032 Figure 65: North America Indoor Location Market Attractiveness by Technology Type, 2022-2032 Figure 66: North America Indoor Location Market Attractiveness by Software Tools Type , 2022-2032 Figure 67: North America Indoor Location Market Attractiveness by End-Use Type, 2022-2032 Figure 68: North America Indoor Location Market Attractiveness by Type of Application, 2022-2032 Figure 69: North America Indoor Location Market Attractiveness by Building Size, 2022-2032 Figure 70: North America Indoor Location Market Attractiveness by Country, 2022-2032 Figure 71: Latin America Indoor Location Market Value (US$ Mn) by Service Type, 2022-2032 Figure 72: Latin America Indoor Location Market Value (US$ Mn) by Technology Type, 2022-2032 Figure 73: Latin America Indoor Location Market Value (US$ Mn) by Software Tools Type , 2022-2032 Figure 74: Latin America Indoor Location Market Value (US$ Mn) by End-Use Type, 2022-2032 Figure 75: Latin America Indoor Location Market Value (US$ Mn) by Type of Application, 2022-2032 Figure 76: Latin America Indoor Location Market Value (US$ Mn) by Building Size, 2022-2032 Figure 77: Latin America Indoor Location Market Value (US$ Mn) by Country, 2022-2032 Figure 78: Latin America Indoor Location Market Value (US$ Mn) Analysis by Country, 2016-2032 Figure 79: Latin America Indoor Location Market Value Share (%) and BPS Analysis by Country, 2022-2032 Figure 80: Latin America Indoor Location Market Y-o-Y Growth (%) Projections by Country, 2022-2032 Figure 81: Latin America Indoor Location Market Value (US$ Mn) Analysis by Service Type, 2016-2032 Figure 82: Latin America Indoor Location Market Value Share (%) and BPS Analysis by Service Type, 2022-2032 Figure 83: Latin America Indoor Location Market Y-o-Y Growth (%) Projections by Service Type, 2022-2032 Figure 84: Latin America Indoor Location Market Value (US$ Mn) Analysis by Technology Type, 2016-2032 Figure 85: Latin America Indoor Location Market Value Share (%) and BPS Analysis by Technology Type, 2022-2032 Figure 86: Latin America Indoor Location Market Y-o-Y Growth (%) Projections by Technology Type, 2022-2032 Figure 87: Latin America Indoor Location Market Value (US$ Mn) Analysis by Software Tools Type , 2016-2032 Figure 88: Latin America Indoor Location Market Value Share (%) and BPS Analysis by Software Tools Type , 2022-2032 Figure 89: Latin America Indoor Location Market Y-o-Y Growth (%) Projections by Software Tools Type , 2022-2032 Figure 90: Latin America Indoor Location Market Value (US$ Mn) Analysis by End-Use Type, 2016-2032 Figure 91: Latin America Indoor Location Market Value Share (%) and BPS Analysis by End-Use Type, 2022-2032 Figure 92: Latin America Indoor Location Market Y-o-Y Growth (%) Projections by End-Use Type, 2022-2032 Figure 93: Latin America Indoor Location Market Value (US$ Mn) Analysis by Type of Application, 2016-2032 Figure 94: Latin America Indoor Location Market Value Share (%) and BPS Analysis by Type of Application, 2022-2032 Figure 95: Latin America Indoor Location Market Y-o-Y Growth (%) Projections by Type of Application, 2022-2032 Figure 96: Latin America Indoor Location Market Value (US$ Mn) Analysis by Building Size, 2016-2032 Figure 97: Latin America Indoor Location Market Value Share (%) and BPS Analysis by Building Size, 2022-2032 Figure 98: Latin America Indoor Location Market Y-o-Y Growth (%) Projections by Building Size, 2022-2032 Figure 99: Latin America Indoor Location Market Attractiveness by Service Type, 2022-2032 Figure 100: Latin America Indoor Location Market Attractiveness by Technology Type, 2022-2032 Figure 101: Latin America Indoor Location Market Attractiveness by Software Tools Type , 2022-2032 Figure 102: Latin America Indoor Location Market Attractiveness by End-Use Type, 2022-2032 Figure 103: Latin America Indoor Location Market Attractiveness by Type of Application, 2022-2032 Figure 104: Latin America Indoor Location Market Attractiveness by Building Size, 2022-2032 Figure 105: Latin America Indoor Location Market Attractiveness by Country, 2022-2032 Figure 106: Europe Indoor Location Market Value (US$ Mn) by Service Type, 2022-2032 Figure 107: Europe Indoor Location Market Value (US$ Mn) by Technology Type, 2022-2032 Figure 108: Europe Indoor Location Market Value (US$ Mn) by Software Tools Type , 2022-2032 Figure 109: Europe Indoor Location Market Value (US$ Mn) by End-Use Type, 2022-2032 Figure 110: Europe Indoor Location Market Value (US$ Mn) by Type of Application, 2022-2032 Figure 111: Europe Indoor Location Market Value (US$ Mn) by Building Size, 2022-2032 Figure 112: Europe Indoor Location Market Value (US$ Mn) by Country, 2022-2032 Figure 113: Europe Indoor Location Market Value (US$ Mn) Analysis by Country, 2016-2032 Figure 114: Europe Indoor Location Market Value Share (%) and BPS Analysis by Country, 2022-2032 Figure 115: Europe Indoor Location Market Y-o-Y Growth (%) Projections by Country, 2022-2032 Figure 116: Europe Indoor Location Market Value (US$ Mn) Analysis by Service Type, 2016-2032 Figure 117: Europe Indoor Location Market Value Share (%) and BPS Analysis by Service Type, 2022-2032 Figure 118: Europe Indoor Location Market Y-o-Y Growth (%) Projections by Service Type, 2022-2032 Figure 119: Europe Indoor Location Market Value (US$ Mn) Analysis by Technology Type, 2016-2032 Figure 120: Europe Indoor Location Market Value Share (%) and BPS Analysis by Technology Type, 2022-2032 Figure 121: Europe Indoor Location Market Y-o-Y Growth (%) Projections by Technology Type, 2022-2032 Figure 122: Europe Indoor Location Market Value (US$ Mn) Analysis by Software Tools Type , 2016-2032 Figure 123: Europe Indoor Location Market Value Share (%) and BPS Analysis by Software Tools Type , 2022-2032 Figure 124: Europe Indoor Location Market Y-o-Y Growth (%) Projections by Software Tools Type , 2022-2032 Figure 125: Europe Indoor Location Market Value (US$ Mn) Analysis by End-Use Type, 2016-2032 Figure 126: Europe Indoor Location Market Value Share (%) and BPS Analysis by End-Use Type, 2022-2032 Figure 127: Europe Indoor Location Market Y-o-Y Growth (%) Projections by End-Use Type, 2022-2032 Figure 128: Europe Indoor Location Market Value (US$ Mn) Analysis by Type of Application, 2016-2032 Figure 129: Europe Indoor Location Market Value Share (%) and BPS Analysis by Type of Application, 2022-2032 Figure 130: Europe Indoor Location Market Y-o-Y Growth (%) Projections by Type of Application, 2022-2032 Figure 131: Europe Indoor Location Market Value (US$ Mn) Analysis by Building Size, 2016-2032 Figure 132: Europe Indoor Location Market Value Share (%) and BPS Analysis by Building Size, 2022-2032 Figure 133: Europe Indoor Location Market Y-o-Y Growth (%) Projections by Building Size, 2022-2032 Figure 134: Europe Indoor Location Market Attractiveness by Service Type, 2022-2032 Figure 135: Europe Indoor Location Market Attractiveness by Technology Type, 2022-2032 Figure 136: Europe Indoor Location Market Attractiveness by Software Tools Type , 2022-2032 Figure 137: Europe Indoor Location Market Attractiveness by End-Use Type, 2022-2032 Figure 138: Europe Indoor Location Market Attractiveness by Type of Application, 2022-2032 Figure 139: Europe Indoor Location Market Attractiveness by Building Size, 2022-2032 Figure 140: Europe Indoor Location Market Attractiveness by Country, 2022-2032 Figure 141: South Asia Indoor Location Market Value (US$ Mn) by Service Type, 2022-2032 Figure 142: South Asia Indoor Location Market Value (US$ Mn) by Technology Type, 2022-2032 Figure 143: South Asia Indoor Location Market Value (US$ Mn) by Software Tools Type , 2022-2032 Figure 144: South Asia Indoor Location Market Value (US$ Mn) by End-Use Type, 2022-2032 Figure 145: South Asia Indoor Location Market Value (US$ Mn) by Type of Application, 2022-2032 Figure 146: South Asia Indoor Location Market Value (US$ Mn) by Building Size, 2022-2032 Figure 147: South Asia Indoor Location Market Value (US$ Mn) by Country, 2022-2032 Figure 148: South Asia Indoor Location Market Value (US$ Mn) Analysis by Country, 2016-2032 Figure 149: South Asia Indoor Location Market Value Share (%) and BPS Analysis by Country, 2022-2032 Figure 150: South Asia Indoor Location Market Y-o-Y Growth (%) Projections by Country, 2022-2032 Figure 151: South Asia Indoor Location Market Value (US$ Mn) Analysis by Service Type, 2016-2032 Figure 152: South Asia Indoor Location Market Value Share (%) and BPS Analysis by Service Type, 2022-2032 Figure 153: South Asia Indoor Location Market Y-o-Y Growth (%) Projections by Service Type, 2022-2032 Figure 154: South Asia Indoor Location Market Value (US$ Mn) Analysis by Technology Type, 2016-2032 Figure 155: South Asia Indoor Location Market Value Share (%) and BPS Analysis by Technology Type, 2022-2032 Figure 156: South Asia Indoor Location Market Y-o-Y Growth (%) Projections by Technology Type, 2022-2032 Figure 157: South Asia Indoor Location Market Value (US$ Mn) Analysis by Software Tools Type , 2016-2032 Figure 158: South Asia Indoor Location Market Value Share (%) and BPS Analysis by Software Tools Type , 2022-2032 Figure 159: South Asia Indoor Location Market Y-o-Y Growth (%) Projections by Software Tools Type , 2022-2032 Figure 160: South Asia Indoor Location Market Value (US$ Mn) Analysis by End-Use Type, 2016-2032 Figure 161: South Asia Indoor Location Market Value Share (%) and BPS Analysis by End-Use Type, 2022-2032 Figure 162: South Asia Indoor Location Market Y-o-Y Growth (%) Projections by End-Use Type, 2022-2032 Figure 163: South Asia Indoor Location Market Value (US$ Mn) Analysis by Type of Application, 2016-2032 Figure 164: South Asia Indoor Location Market Value Share (%) and BPS Analysis by Type of Application, 2022-2032 Figure 165: South Asia Indoor Location Market Y-o-Y Growth (%) Projections by Type of Application, 2022-2032 Figure 166: South Asia Indoor Location Market Value (US$ Mn) Analysis by Building Size, 2016-2032 Figure 167: South Asia Indoor Location Market Value Share (%) and BPS Analysis by Building Size, 2022-2032 Figure 168: South Asia Indoor Location Market Y-o-Y Growth (%) Projections by Building Size, 2022-2032 Figure 169: South Asia Indoor Location Market Attractiveness by Service Type, 2022-2032 Figure 170: South Asia Indoor Location Market Attractiveness by Technology Type, 2022-2032 Figure 171: South Asia Indoor Location Market Attractiveness by Software Tools Type , 2022-2032 Figure 172: South Asia Indoor Location Market Attractiveness by End-Use Type, 2022-2032 Figure 173: South Asia Indoor Location Market Attractiveness by Type of Application, 2022-2032 Figure 174: South Asia Indoor Location Market Attractiveness by Building Size, 2022-2032 Figure 175: South Asia Indoor Location Market Attractiveness by Country, 2022-2032 Figure 176: East Asia Indoor Location Market Value (US$ Mn) by Service Type, 2022-2032 Figure 177: East Asia Indoor Location Market Value (US$ Mn) by Technology Type, 2022-2032 Figure 178: East Asia Indoor Location Market Value (US$ Mn) by Software Tools Type , 2022-2032 Figure 179: East Asia Indoor Location Market Value (US$ Mn) by End-Use Type, 2022-2032 Figure 180: East Asia Indoor Location Market Value (US$ Mn) by Type of Application, 2022-2032 Figure 181: East Asia Indoor Location Market Value (US$ Mn) by Building Size, 2022-2032 Figure 182: East Asia Indoor Location Market Value (US$ Mn) by Country, 2022-2032 Figure 183: East Asia Indoor Location Market Value (US$ Mn) Analysis by Country, 2016-2032 Figure 184: East Asia Indoor Location Market Value Share (%) and BPS Analysis by Country, 2022-2032 Figure 185: East Asia Indoor Location Market Y-o-Y Growth (%) Projections by Country, 2022-2032 Figure 186: East Asia Indoor Location Market Value (US$ Mn) Analysis by Service Type, 2016-2032 Figure 187: East Asia Indoor Location Market Value Share (%) and BPS Analysis by Service Type, 2022-2032 Figure 188: East Asia Indoor Location Market Y-o-Y Growth (%) Projections by Service Type, 2022-2032 Figure 189: East Asia Indoor Location Market Value (US$ Mn) Analysis by Technology Type, 2016-2032 Figure 190: East Asia Indoor Location Market Value Share (%) and BPS Analysis by Technology Type, 2022-2032 Figure 191: East Asia Indoor Location Market Y-o-Y Growth (%) Projections by Technology Type, 2022-2032 Figure 192: East Asia Indoor Location Market Value (US$ Mn) Analysis by Software Tools Type , 2016-2032 Figure 193: East Asia Indoor Location Market Value Share (%) and BPS Analysis by Software Tools Type , 2022-2032 Figure 194: East Asia Indoor Location Market Y-o-Y Growth (%) Projections by Software Tools Type , 2022-2032 Figure 195: East Asia Indoor Location Market Value (US$ Mn) Analysis by End-Use Type, 2016-2032 Figure 196: East Asia Indoor Location Market Value Share (%) and BPS Analysis by End-Use Type, 2022-2032 Figure 197: East Asia Indoor Location Market Y-o-Y Growth (%) Projections by End-Use Type, 2022-2032 Figure 198: East Asia Indoor Location Market Value (US$ Mn) Analysis by Type of Application, 2016-2032 Figure 199: East Asia Indoor Location Market Value Share (%) and BPS Analysis by Type of Application, 2022-2032 Figure 200: East Asia Indoor Location Market Y-o-Y Growth (%) Projections by Type of Application, 2022-2032 Figure 201: East Asia Indoor Location Market Value (US$ Mn) Analysis by Building Size, 2016-2032 Figure 202: East Asia Indoor Location Market Value Share (%) and BPS Analysis by Building Size, 2022-2032 Figure 203: East Asia Indoor Location Market Y-o-Y Growth (%) Projections by Building Size, 2022-2032 Figure 204: East Asia Indoor Location Market Attractiveness by Service Type, 2022-2032 Figure 205: East Asia Indoor Location Market Attractiveness by Technology Type, 2022-2032 Figure 206: East Asia Indoor Location Market Attractiveness by Software Tools Type , 2022-2032 Figure 207: East Asia Indoor Location Market Attractiveness by End-Use Type, 2022-2032 Figure 208: East Asia Indoor Location Market Attractiveness by Type of Application, 2022-2032 Figure 209: East Asia Indoor Location Market Attractiveness by Building Size, 2022-2032 Figure 210: East Asia Indoor Location Market Attractiveness by Country, 2022-2032 Figure 211: Oceania Indoor Location Market Value (US$ Mn) by Service Type, 2022-2032 Figure 212: Oceania Indoor Location Market Value (US$ Mn) by Technology Type, 2022-2032 Figure 213: Oceania Indoor Location Market Value (US$ Mn) by Software Tools Type , 2022-2032 Figure 214: Oceania Indoor Location Market Value (US$ Mn) by End-Use Type, 2022-2032 Figure 215: Oceania Indoor Location Market Value (US$ Mn) by Type of Application, 2022-2032 Figure 216: Oceania Indoor Location Market Value (US$ Mn) by Building Size, 2022-2032 Figure 217: Oceania Indoor Location Market Value (US$ Mn) by Country, 2022-2032 Figure 218: Oceania Indoor Location Market Value (US$ Mn) Analysis by Country, 2016-2032 Figure 219: Oceania Indoor Location Market Value Share (%) and BPS Analysis by Country, 2022-2032 Figure 220: Oceania Indoor Location Market Y-o-Y Growth (%) Projections by Country, 2022-2032 Figure 221: Oceania Indoor Location Market Value (US$ Mn) Analysis by Service Type, 2016-2032 Figure 222: Oceania Indoor Location Market Value Share (%) and BPS Analysis by Service Type, 2022-2032 Figure 223: Oceania Indoor Location Market Y-o-Y Growth (%) Projections by Service Type, 2022-2032 Figure 224: Oceania Indoor Location Market Value (US$ Mn) Analysis by Technology Type, 2016-2032 Figure 225: Oceania Indoor Location Market Value Share (%) and BPS Analysis by Technology Type, 2022-2032 Figure 226: Oceania Indoor Location Market Y-o-Y Growth (%) Projections by Technology Type, 2022-2032 Figure 227: Oceania Indoor Location Market Value (US$ Mn) Analysis by Software Tools Type , 2016-2032 Figure 228: Oceania Indoor Location Market Value Share (%) and BPS Analysis by Software Tools Type , 2022-2032 Figure 229: Oceania Indoor Location Market Y-o-Y Growth (%) Projections by Software Tools Type , 2022-2032 Figure 230: Oceania Indoor Location Market Value (US$ Mn) Analysis by End-Use Type, 2016-2032 Figure 231: Oceania Indoor Location Market Value Share (%) and BPS Analysis by End-Use Type, 2022-2032 Figure 232: Oceania Indoor Location Market Y-o-Y Growth (%) Projections by End-Use Type, 2022-2032 Figure 233: Oceania Indoor Location Market Value (US$ Mn) Analysis by Type of Application, 2016-2032 Figure 234: Oceania Indoor Location Market Value Share (%) and BPS Analysis by Type of Application, 2022-2032 Figure 235: Oceania Indoor Location Market Y-o-Y Growth (%) Projections by Type of Application, 2022-2032 Figure 236: Oceania Indoor Location Market Value (US$ Mn) Analysis by Building Size, 2016-2032 Figure 237: Oceania Indoor Location Market Value Share (%) and BPS Analysis by Building Size, 2022-2032 Figure 238: Oceania Indoor Location Market Y-o-Y Growth (%) Projections by Building Size, 2022-2032 Figure 239: Oceania Indoor Location Market Attractiveness by Service Type, 2022-2032 Figure 240: Oceania Indoor Location Market Attractiveness by Technology Type, 2022-2032 Figure 241: Oceania Indoor Location Market Attractiveness by Software Tools Type , 2022-2032 Figure 242: Oceania Indoor Location Market Attractiveness by End-Use Type, 2022-2032 Figure 243: Oceania Indoor Location Market Attractiveness by Type of Application, 2022-2032 Figure 244: Oceania Indoor Location Market Attractiveness by Building Size, 2022-2032 Figure 245: Oceania Indoor Location Market Attractiveness by Country, 2022-2032 Figure 246: MEA Indoor Location Market Value (US$ Mn) by Service Type, 2022-2032 Figure 247: MEA Indoor Location Market Value (US$ Mn) by Technology Type, 2022-2032 Figure 248: MEA Indoor Location Market Value (US$ Mn) by Software Tools Type , 2022-2032 Figure 249: MEA Indoor Location Market Value (US$ Mn) by End-Use Type, 2022-2032 Figure 250: MEA Indoor Location Market Value (US$ Mn) by Type of Application, 2022-2032 Figure 251: MEA Indoor Location Market Value (US$ Mn) by Building Size, 2022-2032 Figure 252: MEA Indoor Location Market Value (US$ Mn) by Country, 2022-2032 Figure 253: MEA Indoor Location Market Value (US$ Mn) Analysis by Country, 2016-2032 Figure 254: MEA Indoor Location Market Value Share (%) and BPS Analysis by Country, 2022-2032 Figure 255: MEA Indoor Location Market Y-o-Y Growth (%) Projections by Country, 2022-2032 Figure 256: MEA Indoor Location Market Value (US$ Mn) Analysis by Service Type, 2016-2032 Figure 257: MEA Indoor Location Market Value Share (%) and BPS Analysis by Service Type, 2022-2032 Figure 258: MEA Indoor Location Market Y-o-Y Growth (%) Projections by Service Type, 2022-2032 Figure 259: MEA Indoor Location Market Value (US$ Mn) Analysis by Technology Type, 2016-2032 Figure 260: MEA Indoor Location Market Value Share (%) and BPS Analysis by Technology Type, 2022-2032 Figure 261: MEA Indoor Location Market Y-o-Y Growth (%) Projections by Technology Type, 2022-2032 Figure 262: MEA Indoor Location Market Value (US$ Mn) Analysis by Software Tools Type , 2016-2032 Figure 263: MEA Indoor Location Market Value Share (%) and BPS Analysis by Software Tools Type , 2022-2032 Figure 264: MEA Indoor Location Market Y-o-Y Growth (%) Projections by Software Tools Type , 2022-2032 Figure 265: MEA Indoor Location Market Value (US$ Mn) Analysis by End-Use Type, 2016-2032 Figure 266: MEA Indoor Location Market Value Share (%) and BPS Analysis by End-Use Type, 2022-2032 Figure 267: MEA Indoor Location Market Y-o-Y Growth (%) Projections by End-Use Type, 2022-2032 Figure 268: MEA Indoor Location Market Value (US$ Mn) Analysis by Type of Application, 2016-2032 Figure 269: MEA Indoor Location Market Value Share (%) and BPS Analysis by Type of Application, 2022-2032 Figure 270: MEA Indoor Location Market Y-o-Y Growth (%) Projections by Type of Application, 2022-2032 Figure 271: MEA Indoor Location Market Value (US$ Mn) Analysis by Building Size, 2016-2032 Figure 272: MEA Indoor Location Market Value Share (%) and BPS Analysis by Building Size, 2022-2032 Figure 273: MEA Indoor Location Market Y-o-Y Growth (%) Projections by Building Size, 2022-2032 Figure 274: MEA Indoor Location Market Attractiveness by Service Type, 2022-2032 Figure 275: MEA Indoor Location Market Attractiveness by Technology Type, 2022-2032 Figure 276: MEA Indoor Location Market Attractiveness by Software Tools Type , 2022-2032 Figure 277: MEA Indoor Location Market Attractiveness by End-Use Type, 2022-2032 Figure 278: MEA Indoor Location Market Attractiveness by Type of Application, 2022-2032 Figure 279: MEA Indoor Location Market Attractiveness by Building Size, 2022-2032 Figure 280: MEA Indoor Location Market Attractiveness by Country, 2022-2032
Need specific information?
Request CustomizationExplore Technology Insights
View Reports