Tip Location Devices Market
From X-Rays to Wireless: Get to Know How Miniature Tip Location Devices for At-Home Infusion Therapy are Driving Sales Bar for Companies
Tip Location Devices Market by Product, Technology, End User & Region | Forecast 2023 to 2033
Tip Location Devices Market Snapshot
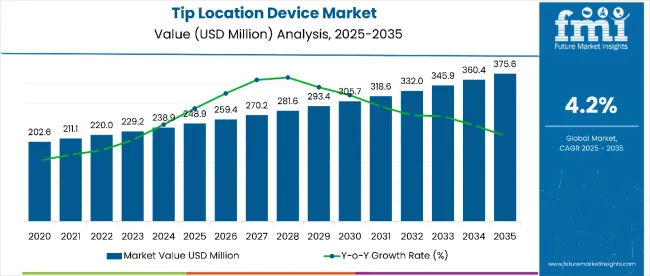
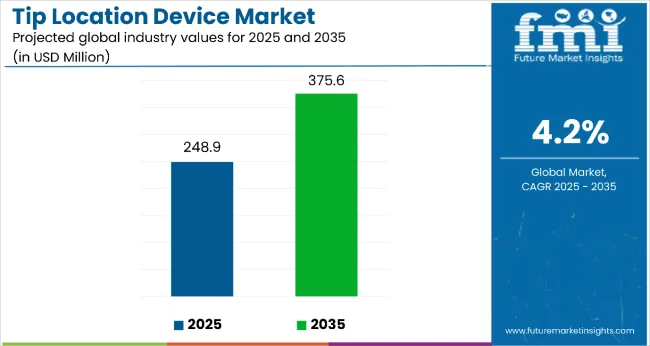
The global tip location devices market is estimated to be valued at around US$ 43.8 million in 2023. The market is anticipated to progress at a CAGR of 7.2% to reach US$ 87.3 million by 2033.
Tip Location Devices Industry Goes High-Tech with PICC Tip Location Systems and ECG PICC Tip Placement
In recent years, there has been a significant shift towards the adoption of PICC tip location systems in the healthcare industry. These systems provide real-time monitoring and accurate placement of catheter tips, reducing the risk of complications and improving patient outcomes. In addition, there has been an increased demand for ECG PICC tip placement, which uses electrocardiogram technology to accurately position catheter tips within the heart. This trend towards advanced technology in tip location equipment is expected to continue in the coming years.
Chronic Diseases and Surgeries Fuel Demand for Tip Location Appliances
The sales of tip location devices are primarily driven by the increasing prevalence of chronic diseases and the growing number of patients requiring long-term intravenous therapy. The rise in the geriatric population and the increasing number of surgeries are also contributing to the growth of the tip location appliances market. In addition, the development of new and advanced products, such as wearable tip location devices and ultrasound-based systems, is expected to boost market growth during the forecast period.
Accurate Catheter Placement Demands Surge, Driving Tip Location Devices Market
The demand for tip location devices is fueled by the need for accurate and efficient placement of catheter tips. These devices are essential in preventing complications, such as catheter malposition and pneumothorax, which can lead to serious health risks for patients. The rising demand for minimally invasive surgeries is also driving the growth of the tip location devices market, as these procedures often require the use of catheters and other medical devices.
Innovation and Differentiation Drive Tip Location Devices Market Amid Rising Trend Towards Home Healthcare and Telemedicine
The tip location devices industry offers significant opportunities for manufacturers and vendors to expand their product offerings and enter new markets. The increasing demand for portable and wireless devices, as well as the growing use of ultrasound-based systems, presents opportunities for innovation and product differentiation. Moreover, the rising trend towards home healthcare and telemedicine is expected to drive the adoption of tip location devices that can be used by patients in their own homes, further expanding the market.
Data Points |
Market Insights |
Market Value 2023 |
US$ 43.8 million |
Market Value 2033 |
US$ 87.3 million |
CAGR 2023 to 2033 |
7.2% |
Market Share of Top 5 Countries |
61.5% |
Let us know your requirement to get
100% FREE customization
Sales Analysis of Tip Location Devices From 2017 to 2020 Vs Market Outlook For 2023 to 2033
As per Future Market Insights projections, manual tip location systems hold a substantial share of over 77.0% in 2023 within the global tip location devices market.
PICCs are a dependable alternative to central venous catheters (CVC) due to comparatively lower potential complications and cost of PICC. The growing occurrence of cancer is anticipated to offer profitable growth opportunities for players in the global tip location devices market.
The growth of the tip location devices market is heavily influenced by healthcare spending and innovation, as well as macro and industry factors. Tip navigation using a reference electrode, magnetic tip navigation, and intracavitary ECG to display the position of the catheter, is currently a desirable trend in the market.
According to FMI analysis, the tip location devices market is expected to increase by 26 Basis Share Point (BPS) in H1-2022 (O) as compared to H1-2021. This increase in the BPS is associated with the relevance of tip location devices linked with ultrasound-guided venepuncture, as well as intracavitary electrocardiography, during the insertion of peripherally inserted central catheters, as established accurate guidance techniques for the procedure.
The H1-2022 outlook period in comparison to H1-2022 projected period showed negative growth in terms of Basis Point Share by 10 BPS.
Particulars |
Details |
H1, 2021 |
6.60% |
H1, 2022 Projected |
6.96% |
H1, 2022 Outlook |
6.86% |
BPS Change - H1, 2022 (O) – H1, 2022 (P) |
(-) 10 ↓ |
BPS Change – H1, 2022 (O) – H1, 2021 |
(+) 26 ↑ |
Mechanical phlebitis, risk of infection, device malfunction, and air emboli are some of the challenges that the sector faces. Other market categories, on the other hand, are predicted to do promisingly well and have a favorable development potential in the second half of the projection period.
The tip location devices market holds nearly 1.0% of the overall US$ 4.0 billion vascular access devices market in 2023. The historical value of the CAGR displayed by the market is 5.8% from 2017 to 2022.
The tip location devices industry is expected to expand at a considerable CAGR of 7.2% during the forecast period.
Increasing adoption of PICC is expected to drive the revenue growth of the tip location devices market globally as these devices assist in real-time navigation of PICC tip and reduces the time required to commence infusion therapy post-PICC insertion as compared to X-ray or fluoroscopy.
Before the launch of tip location devices, chest X-ray was considered the gold standard for confirmation of the location of the PICC tip. X-rays lead to radiation exposure. Malpositioning of catheters leads to repetitive X-ray procedures which increases the risk of side effects of radiation exposure such as mouth sores, nausea, vomiting, and hair loss. Tip location devices assist physicians to locate the PICC tip accurately with relatively less radiation exposure to patients as compared to procedures such as chest X-ray
Find your sweet spots for generating winning opportunities in this market.
Talk to AnalystComparative View of the Tip Location Devices Market
Tip Location Devices Market:
Attributes |
Tip Location Devices Market |
CAGR (2023 to 2033) |
7.2% |
Market Value (2033) |
US$ 87.3 million |
Opportunity |
Increasing demand for minimally invasive surgeries and accurate catheter placement. |
Key Trends |
Shift towards adoption of PICC tip location systems and advanced technology in tip location equipment. |
Peripherally Inserted Central Catheters Market:
Attributes |
Peripherally Inserted Central Catheters Market |
CAGR (2023 to 2033) |
6.7% |
Market Value (2033) |
US$ 1,338.35 million |
Opportunity |
Growing prevalence of chronic diseases and need for long-term intravenous therapy. |
Key Trends |
Increasing demand for wearable and ultrasound-based PICC devices. |
PICC Tip Placement Systems Market:
Attributes |
PICC Tip Placement Systems Market |
CAGR (2023 to 2033) |
5.71% |
Market Value (2033) |
US$ 212 million |
Opportunity |
Real-time monitoring and accurate placement of catheter tips. |
Key Trends |
Adoption of ECG PICC tip placement and use of magnetic tracking and electrocardiography-guided catheter tip confirmation system. |
What are the Factors Restraining Demand for Tip Location Devices?
Tip location device use is avoided in patients that show alterations of cardiac rhythm as various devices track the P-wave generated by the heart. PICC nurses and radiologists usually perform PICC insertion through tip location devices. The protocol is specific and requires a trained professional to carry out the procedure to obtain the desired results with minimum manual error.
The low availability of skilled professionals is expected to hamper the growth of the tip location devices market globally during the forecast period, especially in developing countries. The lack of ample clinical studies is restricting the entry of new market players in the global tip location devices market hampering the revenue growth of the market.

A unified Market Research Subscription Platform, built for today's disparate research needs.
Country-Wise Insights
United States Market Size (US$ million) by End of Forecast Period (2033) |
36.2 |
CAGR % 2023 to End of Forecast (2033) |
7.8% |
What Makes the United States the Largest Market for Tip Location Devices?
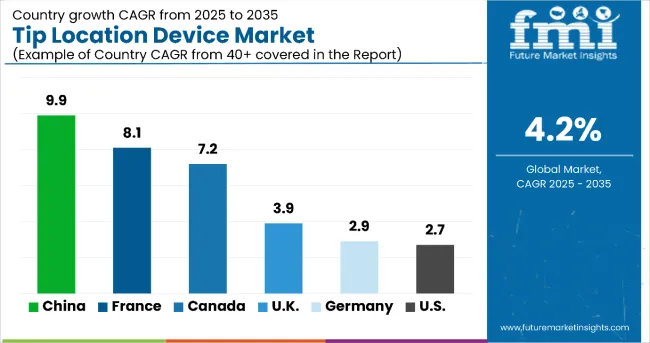
The United States tip location devices industry is estimated to be worth US$ 36.2 million by 2033, with a CAGR of 7.8% between 2023 and 2033. The country's robust healthcare system, characterized by a large number of healthcare facilities and hospitals, creates a significant demand for medical devices, including tip location devices. The high prevalence of chronic diseases, such as cancer and cardiovascular diseases, increases the need for catheterization procedures, which, in turn, drives the demand for tip location devices.
The favorable reimbursement scenario in the United States healthcare system, coupled with the emphasis on patient outcomes and safety, encourages healthcare facilities to invest in advanced medical devices such as tip location devices. Moreover, the presence of major players in the medical device industry in the United States, investing heavily in research and development, contributes to the growth of the tip location devices market in the country. These companies strive to innovate and introduce advanced products, such as superior imaging devices and software with enhanced safety features, to influence the adoption of tip location devices over traditional procedures such as X-rays for PICC tip confirmation.
Why is Germany Considered a Lucrative Market for Tip Location Devices in Western Europe?
Germany Market Size (US$ million) by End of Forecast Period (2033) |
6.7 |
CAGR % 2023 to End of Forecast (2033) |
7.9% |
The tip location devices industry in Germany is expected to be worth US$ 6.7 million by 2033, with a CAGR of 7.9% from 2023 to 2033.
In Western Europe, Germany is considered a lucrative market for tip location devices due to its high prevalence of chronic diseases, favorable reimbursement scenario, and well-established healthcare system with advanced medical facilities. In addition, the German market has been witnessing a shift towards the adoption of ultrasound-based tip location devices, which offer real-time guidance for catheter placement, reduced radiation exposure, and improved accuracy.
United Kingdom Tip Location Devices Industry Outlook
United Kingdom Market Size (US$ million) by End of Forecast Period (2033) |
4.7 |
CAGR % 2023 to End of Forecast (2033) |
7.2% |
The United Kingdom tip location devices industry is projected to be worth US$ 4.7 million by 2033, with a CAGR of 7.2% during the forecast period.
The United Kingdom's tip location device market is witnessing a trend toward the adoption of advanced imaging software, which improves the reproducibility of results and reduces the time for tip confirmation. The country's strong emphasis on patient outcomes and safety, coupled with the government's focus on reducing the burden on the National Health Service (NHS), is driving the adoption of tip location devices to reduce the time and cost associated with traditional procedures such as X-rays.
What Makes China an Emerging Market for Tip Location Devices?
China Market Size (US$ million) by End of Forecast Period (2033) |
2.9 |
CAGR % 2023 to End of Forecast (2033) |
8.2% |
The China tip location devices market is expected to reach US$ 4.9 million by 2033, with a CAGR of 8.2% during the forecast period. The country has a large population, a growing middle class, and an increasing prevalence of chronic diseases, leading to a rise in demand for advanced medical devices such as tip location devices. The government's emphasis on improving the quality of healthcare and expanding access to medical facilities also creates opportunities for the growth of the tip location devices market.
In addition, the Chinese market is witnessing a trend toward the adoption of advanced imaging technologies, such as ultrasound and electromagnetic navigation, for tip confirmation. These technologies offer improved accuracy, reduced radiation exposure, and increased patient comfort compared to traditional procedures such as X-rays and fluoroscopy. In addition, the Chinese market is witnessing a shift towards the adoption of disposable tip location devices, which offer improved safety and reduce the risk of infections.
Category-Wise Insights
Which Tip Location Devices Product is Driving Market Growth?
Top Product |
Tip Location System |
CAGR % 2023 to End of Forecast (2033) |
7.5% |
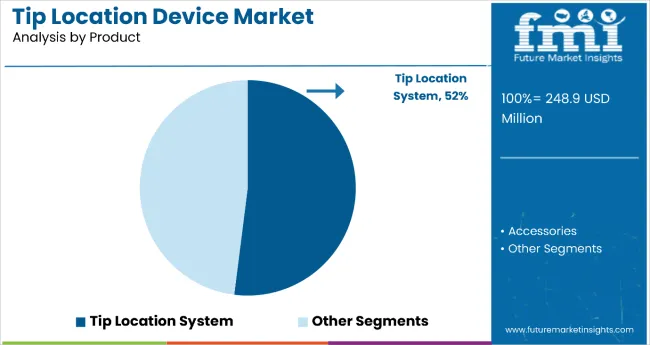
The tip location system segment is expected to have the biggest market share with a 7.5% CAGR over the forecast period. The steady growth of the tip location system segment is attributed to its use of magnetic tracking and electrocardiography-guided catheter tip confirmation system (TCS), which eliminates the need for radiation exposure from X-rays and fluoroscopy. This technology ensures the accurate placement of peripherally inserted central catheters, making it a preferred choice for healthcare providers.
Which Technology is Large of Focus in the Tip Location Devices Market?
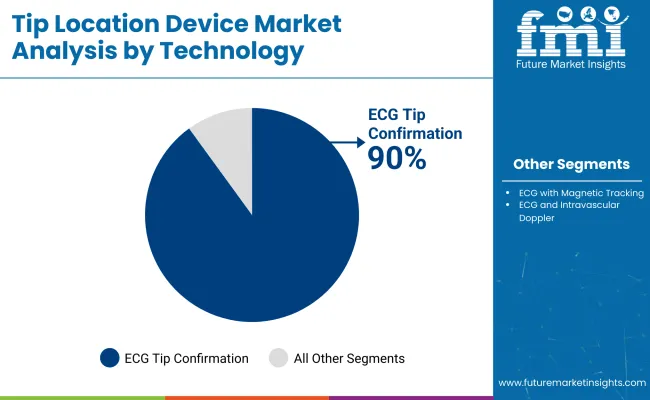
ECG with Magnetic Tracking held a revenue share of 59% in 2022 and is projected to hold a share over the forecast period with the estimation being 61.6% as ECG with Magnetic Tracking PICC placement applications reduce the risk of radiations associated with conventional X-ray procedures.
ECG with Magnetic Tracking holds a significant share of the tip location devices market due to its non-invasive and radiation-free nature. It is particularly beneficial for patients with pre-existing conditions, such as cancer and kidney disease, who are at a higher risk of radiation exposure. In addition, the technology is user-friendly and provides real-time data, increasing its adoption rate among healthcare providers.
Which End User Benefits the Most by Adoption of Tip Location Devices?
Top End User |
Hospital |
CAGR % 2023 to End of Forecast (2033) |
7.7% |
By end user, the hospital segment is expected to lead the market, with a CAGR of 7.7% during the forecast period. Hospitals are the leading end-users of tip location devices due to the critical nature of procedures that require accurate catheter placement. The adoption of tip location devices in hospitals reduces the need for time-consuming and expensive X-rays and fluoroscopy, allowing for quicker initiation of infusion therapy and improved patient outcomes. Furthermore, the cost-effectiveness of tip location devices makes them an attractive investment for hospitals looking to improve their bottom line.
Shrinking Technology, Expanding Possibilities: Manufacturers Preparing for the Lucrative Future of Tip Location Devices
Miniaturization of tip location devices has been a primary area of focus for manufacturers. Currently, the majority of tip location devices are installed beside. Miniaturization of these devices with the same level of precision in terms of catheter tip placement is expected to be a key area of focus for tip location device manufacturers.
Researchers are continuously working on taking tip location devices out of healthcare facilities and to sites closer to the common user, through the development of miniature tip location devices. Innovation while developing imaging software used to track PICC tip location is a key aspect for increasing the reproducibility of results.
Companies are investing in R&D initiatives to introduce superior imaging devices and software with enhanced safety features to influence physicians to the adoption of tip location devices over other traditional procedures such as X-rays for PICC tip confirmation.
Reduction of time for initiation of infusion therapy is a key area of focus as a substantial amount of time is required for tip location confirmation through x-ray and fluoroscopy. CVCs are inserted in intensive care units, theatres, wards, and radiology departments. To avoid conditions such as I.V. misplacement, intra-arterial misplacement, and extravascular placement, increasing implementation of tip location devices is expected in healthcare facilities.
This is mainly because tip location devices reduce the time for infusion therapy by eliminating the need for chest X-rays and fluoroscopy. All these factors are expected to provide huge opportunities for the players functioning in the tip location devices market.
Engaging in acquisitions and mergers is a key strategy adopted by manufacturers in the tip location devices market to increase the consumer base in different geographies. Leading players also form alliances with group purchasing organizations to fortify the premier market.
- In January 2020, AngioDynamics Inc. announced the acquisition of the C3 Wave PICC tip location system from Medical Components Inc.
- In December 2021, Teleflex Incorporated announced that the company has received reimbursement approval from the Central Social Insurance Medical Council of Japan (Chuikyo) for its UroLift System for patients who require treatment for benign prostatic hyperplasia (BPH).
Similarly, recent developments related to companies manufacturing tip location device products have been tracked by the team at Future Market Insights, which are available in the full report.
Report Scope as Per Tip Location Devices Industry Analysis
Attribute |
Details |
Forecast Period |
2022 to 2033 |
Historical Data Available for |
2017 to 2022 |
Market Analysis |
US$ million for Value |
Key Regions Covered |
North America, Latin America, Western Europe, Eastern Europe, APEJ, Japan and the Middle East, and Africa |
Key Countries Covered |
USA, Canada, Brazil, Mexico, Argentina, Germany, United kingdom, France, Italy, Spain, Nordic, BENELUX, Poland, Russia, China, Japan, India, Australia, New Zealand, GCC Countries, and South Africa |
Key Market Segments Covered |
Product, Technology, End User, and Region |
Key Companies Profiled |
|
Pricing |
Available upon Request |
Key Market Segments Covered in Tip Location Devices Industry Research
By Product:
- Tip Location System
- Accessories
- ECG Cables
- ECG Clip Cables
- ECG Lead Set
By Technology:
- ECG Tip Confirmation
- ECG with Magnetic Tracking
- ECG and IV Doppler
By End User:
- Hospitals
- Ambulatory Surgical Centers (ASCS)
- Catheterization Labs
By Region:
- North America
- Latin America
- Western Europe
- Eastern Europe
- APEJ
- Japan
- Middle East and Africa (MEA)
Frequently Asked Questions
How much is the tip location devices market currently worth?
The global tip location devices market is worth US$ 43.8 million in 2023 and is set to expand 1.7X over the forecast period.
What is the sales forecast for tip location devices through 2033?
The sales of tip location devices are expected to surpass US$ 87.3 million by 2033.
What are the key trends shaping the tip location devices industry?
The launch of innovative products to make PICC insertion safer and more user-friendly is a prominent trend amongst various manufacturers.
Which are the top 5 countries driving demand for tip location devices?
The United States, Germany, Canada, the United kingdom, and Japan are expected to drive demand in the tip location devices market.
What is the United States market outlook for tip location devices?
The United States is expected to account for over 87% of the North American market during the forecast period.
At what percentage is the demand for tip location devices expected to register growth in Western Europe?
Demand for tip location devices in Western Europe is expected to register a growth of 6.9% over the next eight years.
Which countries are key producers of tip location device products?
The United States, Canada, and Germany are key producers of tip location device products.
Which are the key exporters of the tip location devices market?
Teleflex Incorporated, AngioDynamics Inc., C.R. Bard, Inc., Vygon S.A., and CORPAK MedSystems are the key exporters of the tip location devices market.
Table of Content
1. Executive Summary | Tip Location Devices Market 1.1. Global Market Outlook 1.2. Demand-side Trends 1.3. Supply-side Trends 1.4. Technology Roadmap Analysis 1.5. Analysis and Recommendations 2. Market Overview 2.1. Market Coverage / Taxonomy 2.2. Market Definition / Scope / Limitations 3. Market Background 3.1. Market Dynamics 3.1.1. Drivers 3.1.2. Restraints 3.1.3. Opportunity 3.1.4. Trends 3.2. Scenario Forecast 3.2.1. Demand in Optimistic Scenario 3.2.2. Demand in Likely Scenario 3.2.3. Demand in Conservative Scenario 3.3. Opportunity Map Analysis 3.4. Investment Feasibility Matrix 3.5. PESTLE and Porter’s Analysis 3.6. Regulatory Landscape 3.6.1. By Key Regions 3.6.2. By Key Countries 3.7. Regional Parent Market Outlook 4. Global Market Analysis 2018 to 2022 and Forecast, 2023 to 2033 4.1. Historical Market Size Value (US$ Million) Analysis, 2018 to 2022 4.2. Current and Future Market Size Value (US$ Million) Projections, 2023 to 2033 4.2.1. Y-o-Y Growth Trend Analysis 4.2.2. Absolute $ Opportunity Analysis 5. Global Market Analysis 2018 to 2022 and Forecast 2023 to 2033, By Product 5.1. Introduction / Key Findings 5.2. Historical Market Size Value (US$ Million) Analysis By Product, 2018 to 2022 5.3. Current and Future Market Size Value (US$ Million) Analysis and Forecast By Product, 2023 to 2033 5.3.1. Tip Location System 5.3.2. Accessories 5.3.2.1. ECG Cables 5.3.2.2. ECG Clip Cables 5.3.2.3. ECG Lead Set 5.4. Y-o-Y Growth Trend Analysis By Product, 2018 to 2022 5.5. Absolute $ Opportunity Analysis By Product, 2023 to 2033 6. Global Market Analysis 2018 to 2022 and Forecast 2023 to 2033, By Technology 6.1. Introduction / Key Findings 6.2. Historical Market Size Value (US$ Million) Analysis By Technology, 2018 to 2022 6.3. Current and Future Market Size Value (US$ Million) Analysis and Forecast By Technology, 2023 to 2033 6.3.1. ECG Tip Confirmation 6.3.2. ECG with Magnetic Tracking 6.3.3. ECG and IV Doppler 6.4. Y-o-Y Growth Trend Analysis By Technology, 2018 to 2022 6.5. Absolute $ Opportunity Analysis By Technology, 2023 to 2033 7. Global Market Analysis 2018 to 2022 and Forecast 2023 to 2033, By End User 7.1. Introduction / Key Findings 7.2. Historical Market Size Value (US$ Million) Analysis By End User , 2018 to 2022 7.3. Current and Future Market Size Value (US$ Million) Analysis and Forecast By End User , 2023 to 2033 7.3.1. Hospitals 7.3.2. Ambulatory Surgical Centres 7.3.3. Catheterization Labs 7.4. Y-o-Y Growth Trend Analysis By End User , 2018 to 2022 7.5. Absolute $ Opportunity Analysis By End User , 2023 to 2033 8. Global Market Analysis 2018 to 2022 and Forecast 2023 to 2033, By Region 8.1. Introduction 8.2. Historical Market Size Value (US$ Million) Analysis By Region, 2018 to 2022 8.3. Current Market Size Value (US$ Million) Analysis and Forecast By Region, 2023 to 2033 8.3.1. North America 8.3.2. Latin America 8.3.3. Europe 8.3.4. South Asia 8.3.5. East Asia 8.3.6. Oceania 8.3.7. MEA 8.4. Market Attractiveness Analysis By Region 9. North America Market Analysis 2018 to 2022 and Forecast 2023 to 2033, By Country 9.1. Historical Market Size Value (US$ Million) Trend Analysis By Market Taxonomy, 2018 to 2022 9.2. Market Size Value (US$ Million) Forecast By Market Taxonomy, 2023 to 2033 9.2.1. By Country 9.2.1.1. USA 9.2.1.2. Canada 9.2.2. By Product 9.2.3. By Technology 9.2.4. By End User 9.3. Market Attractiveness Analysis 9.3.1. By Country 9.3.2. By Product 9.3.3. By Technology 9.3.4. By End User 9.4. Key Takeaways 10. Latin America Market Analysis 2018 to 2022 and Forecast 2023 to 2033, By Country 10.1. Historical Market Size Value (US$ Million) Trend Analysis By Market Taxonomy, 2018 to 2022 10.2. Market Size Value (US$ Million) Forecast By Market Taxonomy, 2023 to 2033 10.2.1. By Country 10.2.1.1. Brazil 10.2.1.2. Mexico 10.2.1.3. Rest of Latin America 10.2.2. By Product 10.2.3. By Technology 10.2.4. By End User 10.3. Market Attractiveness Analysis 10.3.1. By Country 10.3.2. By Product 10.3.3. By Technology 10.3.4. By End User 10.4. Key Takeaways 11. Europe Market Analysis 2018 to 2022 and Forecast 2023 to 2033, By Country 11.1. Historical Market Size Value (US$ Million) Trend Analysis By Market Taxonomy, 2018 to 2022 11.2. Market Size Value (US$ Million) Forecast By Market Taxonomy, 2023 to 2033 11.2.1. By Country 11.2.1.1. Germany 11.2.1.2. United kingdom 11.2.1.3. France 11.2.1.4. Spain 11.2.1.5. Italy 11.2.1.6. Rest of Europe 11.2.2. By Product 11.2.3. By Technology 11.2.4. By End User 11.3. Market Attractiveness Analysis 11.3.1. By Country 11.3.2. By Product 11.3.3. By Technology 11.3.4. By End User 11.4. Key Takeaways 12. South Asia Market Analysis 2018 to 2022 and Forecast 2023 to 2033, By Country 12.1. Historical Market Size Value (US$ Million) Trend Analysis By Market Taxonomy, 2018 to 2022 12.2. Market Size Value (US$ Million) Forecast By Market Taxonomy, 2023 to 2033 12.2.1. By Country 12.2.1.1. India 12.2.1.2. Malaysia 12.2.1.3. Singapore 12.2.1.4. Thailand 12.2.1.5. Rest of South Asia 12.2.2. By Product 12.2.3. By Technology 12.2.4. By End User 12.3. Market Attractiveness Analysis 12.3.1. By Country 12.3.2. By Product 12.3.3. By Technology 12.3.4. By End User 12.4. Key Takeaways 13. East Asia Market Analysis 2018 to 2022 and Forecast 2023 to 2033, By Country 13.1. Historical Market Size Value (US$ Million) Trend Analysis By Market Taxonomy, 2018 to 2022 13.2. Market Size Value (US$ Million) Forecast By Market Taxonomy, 2023 to 2033 13.2.1. By Country 13.2.1.1. China 13.2.1.2. Japan 13.2.1.3. South Korea 13.2.2. By Product 13.2.3. By Technology 13.2.4. By End User 13.3. Market Attractiveness Analysis 13.3.1. By Country 13.3.2. By Product 13.3.3. By Technology 13.3.4. By End User 13.4. Key Takeaways 14. Oceania Market Analysis 2018 to 2022 and Forecast 2023 to 2033, By Country 14.1. Historical Market Size Value (US$ Million) Trend Analysis By Market Taxonomy, 2018 to 2022 14.2. Market Size Value (US$ Million) Forecast By Market Taxonomy, 2023 to 2033 14.2.1. By Country 14.2.1.1. Australia 14.2.1.2. New Zealand 14.2.2. By Product 14.2.3. By Technology 14.2.4. By End User 14.3. Market Attractiveness Analysis 14.3.1. By Country 14.3.2. By Product 14.3.3. By Technology 14.3.4. By End User 14.4. Key Takeaways 15. MEA Market Analysis 2018 to 2022 and Forecast 2023 to 2033, By Country 15.1. Historical Market Size Value (US$ Million) Trend Analysis By Market Taxonomy, 2018 to 2022 15.2. Market Size Value (US$ Million) Forecast By Market Taxonomy, 2023 to 2033 15.2.1. By Country 15.2.1.1. GCC Countries 15.2.1.2. South Africa 15.2.1.3. Israel 15.2.1.4. Rest of MEA 15.2.2. By Product 15.2.3. By Technology 15.2.4. By End User 15.3. Market Attractiveness Analysis 15.3.1. By Country 15.3.2. By Product 15.3.3. By Technology 15.3.4. By End User 15.4. Key Takeaways 16. Key Countries Market Analysis 16.1. USA 16.1.1. Pricing Analysis 16.1.2. Market Share Analysis, 2022 16.1.2.1. By Product 16.1.2.2. By Technology 16.1.2.3. By End User 16.2. Canada 16.2.1. Pricing Analysis 16.2.2. Market Share Analysis, 2022 16.2.2.1. By Product 16.2.2.2. By Technology 16.2.2.3. By End User 16.3. Brazil 16.3.1. Pricing Analysis 16.3.2. Market Share Analysis, 2022 16.3.2.1. By Product 16.3.2.2. By Technology 16.3.2.3. By End User 16.4. Mexico 16.4.1. Pricing Analysis 16.4.2. Market Share Analysis, 2022 16.4.2.1. By Product 16.4.2.2. By Technology 16.4.2.3. By End User 16.5. Germany 16.5.1. Pricing Analysis 16.5.2. Market Share Analysis, 2022 16.5.2.1. By Product 16.5.2.2. By Technology 16.5.2.3. By End User 16.6. United kingdom 16.6.1. Pricing Analysis 16.6.2. Market Share Analysis, 2022 16.6.2.1. By Product 16.6.2.2. By Technology 16.6.2.3. By End User 16.7. France 16.7.1. Pricing Analysis 16.7.2. Market Share Analysis, 2022 16.7.2.1. By Product 16.7.2.2. By Technology 16.7.2.3. By End User 16.8. Spain 16.8.1. Pricing Analysis 16.8.2. Market Share Analysis, 2022 16.8.2.1. By Product 16.8.2.2. By Technology 16.8.2.3. By End User 16.9. Italy 16.9.1. Pricing Analysis 16.9.2. Market Share Analysis, 2022 16.9.2.1. By Product 16.9.2.2. By Technology 16.9.2.3. By End User 16.10. India 16.10.1. Pricing Analysis 16.10.2. Market Share Analysis, 2022 16.10.2.1. By Product 16.10.2.2. By Technology 16.10.2.3. By End User 16.11. Malaysia 16.11.1. Pricing Analysis 16.11.2. Market Share Analysis, 2022 16.11.2.1. By Product 16.11.2.2. By Technology 16.11.2.3. By End User 16.12. Singapore 16.12.1. Pricing Analysis 16.12.2. Market Share Analysis, 2022 16.12.2.1. By Product 16.12.2.2. By Technology 16.12.2.3. By End User 16.13. Thailand 16.13.1. Pricing Analysis 16.13.2. Market Share Analysis, 2022 16.13.2.1. By Product 16.13.2.2. By Technology 16.13.2.3. By End User 16.14. China 16.14.1. Pricing Analysis 16.14.2. Market Share Analysis, 2022 16.14.2.1. By Product 16.14.2.2. By Technology 16.14.2.3. By End User 16.15. Japan 16.15.1. Pricing Analysis 16.15.2. Market Share Analysis, 2022 16.15.2.1. By Product 16.15.2.2. By Technology 16.15.2.3. By End User 16.16. South Korea 16.16.1. Pricing Analysis 16.16.2. Market Share Analysis, 2022 16.16.2.1. By Product 16.16.2.2. By Technology 16.16.2.3. By End User 16.17. Australia 16.17.1. Pricing Analysis 16.17.2. Market Share Analysis, 2022 16.17.2.1. By Product 16.17.2.2. By Technology 16.17.2.3. By End User 16.18. New Zealand 16.18.1. Pricing Analysis 16.18.2. Market Share Analysis, 2022 16.18.2.1. By Product 16.18.2.2. By Technology 16.18.2.3. By End User 16.19. GCC Countries 16.19.1. Pricing Analysis 16.19.2. Market Share Analysis, 2022 16.19.2.1. By Product 16.19.2.2. By Technology 16.19.2.3. By End User 16.20. South Africa 16.20.1. Pricing Analysis 16.20.2. Market Share Analysis, 2022 16.20.2.1. By Product 16.20.2.2. By Technology 16.20.2.3. By End User 16.21. Israel 16.21.1. Pricing Analysis 16.21.2. Market Share Analysis, 2022 16.21.2.1. By Product 16.21.2.2. By Technology 16.21.2.3. By End User 17. Market Structure Analysis 17.1. Competition Dashboard 17.2. Competition Benchmarking 17.3. Market Share Analysis of Top Players 17.3.1. By Regional 17.3.2. By Product 17.3.3. By Technology 17.3.4. By End User 18. Competition Analysis 18.1. Competition Deep Dive 18.1.1. Teleflex Incorporated 18.1.1.1. Overview 18.1.1.2. Product Portfolio 18.1.1.3. Profitability by Market Segments 18.1.1.4. Sales Footprint 18.1.1.5. Strategy Overview 18.1.1.5.1. Marketing Strategy 18.1.2. AngioDynamics Inc. 18.1.2.1. Overview 18.1.2.2. Product Portfolio 18.1.2.3. Profitability by Market Segments 18.1.2.4. Sales Footprint 18.1.2.5. Strategy Overview 18.1.2.5.1. Marketing Strategy 18.1.3. Cath-Tip, Inc. 18.1.3.1. Overview 18.1.3.2. Product Portfolio 18.1.3.3. Profitability by Market Segments 18.1.3.4. Sales Footprint 18.1.3.5. Strategy Overview 18.1.3.5.1. Marketing Strategy 18.1.4. Vygon S.A. 18.1.4.1. Overview 18.1.4.2. Product Portfolio 18.1.4.3. Profitability by Market Segments 18.1.4.4. Sales Footprint 18.1.4.5. Strategy Overview 18.1.4.5.1. Marketing Strategy 18.1.5. CORPAK MedSystems 18.1.5.1. Overview 18.1.5.2. Product Portfolio 18.1.5.3. Profitability by Market Segments 18.1.5.4. Sales Footprint 18.1.5.5. Strategy Overview 18.1.5.5.1. Marketing Strategy 18.1.6. Becton, Dickinson and Company 18.1.6.1. Overview 18.1.6.2. Product Portfolio 18.1.6.3. Profitability by Market Segments 18.1.6.4. Sales Footprint 18.1.6.5. Strategy Overview 18.1.6.5.1. Marketing Strategy 18.1.7. Boston Scientific Corporation 18.1.7.1. Overview 18.1.7.2. Product Portfolio 18.1.7.3. Profitability by Market Segments 18.1.7.4. Sales Footprint 18.1.7.5. Strategy Overview 18.1.7.5.1. Marketing Strategy 18.1.8. Navilyst Medical, Inc. 18.1.8.1. Overview 18.1.8.2. Product Portfolio 18.1.8.3. Profitability by Market Segments 18.1.8.4. Sales Footprint 18.1.8.5. Strategy Overview 18.1.8.5.1. Marketing Strategy 18.1.9. Johnson and Johnson Services Inc. 18.1.9.1. Overview 18.1.9.2. Product Portfolio 18.1.9.3. Profitability by Market Segments 18.1.9.4. Sales Footprint 18.1.9.5. Strategy Overview 18.1.9.5.1. Marketing Strategy 18.1.10. C. R. Bard, Inc. 18.1.10.1. Overview 18.1.10.2. Product Portfolio 18.1.10.3. Profitability by Market Segments 18.1.10.4. Sales Footprint 18.1.10.5. Strategy Overview 18.1.10.5.1. Marketing Strategy 19. Assumptions & Acronyms Used 20. Research Methodology
Let us know your requirement to get
100% FREE customization
List of Tables
Table 1: Global Market Value (US$ Million) Forecast by Region, 2018 to 2033 Table 2: Global Market Value (US$ Million) Forecast by Product, 2018 to 2033 Table 3: Global Market Value (US$ Million) Forecast by Technology, 2018 to 2033 Table 4: Global Market Value (US$ Million) Forecast by End User , 2018 to 2033 Table 5: North America Market Value (US$ Million) Forecast by Country, 2018 to 2033 Table 6: North America Market Value (US$ Million) Forecast by Product, 2018 to 2033 Table 7: North America Market Value (US$ Million) Forecast by Technology, 2018 to 2033 Table 8: North America Market Value (US$ Million) Forecast by End User , 2018 to 2033 Table 9: Latin America Market Value (US$ Million) Forecast by Country, 2018 to 2033 Table 10: Latin America Market Value (US$ Million) Forecast by Product, 2018 to 2033 Table 11: Latin America Market Value (US$ Million) Forecast by Technology, 2018 to 2033 Table 12: Latin America Market Value (US$ Million) Forecast by End User , 2018 to 2033 Table 13: Europe Market Value (US$ Million) Forecast by Country, 2018 to 2033 Table 14: Europe Market Value (US$ Million) Forecast by Product, 2018 to 2033 Table 15: Europe Market Value (US$ Million) Forecast by Technology, 2018 to 2033 Table 16: Europe Market Value (US$ Million) Forecast by End User , 2018 to 2033 Table 17: South Asia Market Value (US$ Million) Forecast by Country, 2018 to 2033 Table 18: South Asia Market Value (US$ Million) Forecast by Product, 2018 to 2033 Table 19: South Asia Market Value (US$ Million) Forecast by Technology, 2018 to 2033 Table 20: South Asia Market Value (US$ Million) Forecast by End User , 2018 to 2033 Table 21: East Asia Market Value (US$ Million) Forecast by Country, 2018 to 2033 Table 22: East Asia Market Value (US$ Million) Forecast by Product, 2018 to 2033 Table 23: East Asia Market Value (US$ Million) Forecast by Technology, 2018 to 2033 Table 24: East Asia Market Value (US$ Million) Forecast by End User , 2018 to 2033 Table 25: Oceania Market Value (US$ Million) Forecast by Country, 2018 to 2033 Table 26: Oceania Market Value (US$ Million) Forecast by Product, 2018 to 2033 Table 27: Oceania Market Value (US$ Million) Forecast by Technology, 2018 to 2033 Table 28: Oceania Market Value (US$ Million) Forecast by End User , 2018 to 2033 Table 29: MEA Market Value (US$ Million) Forecast by Country, 2018 to 2033 Table 30: MEA Market Value (US$ Million) Forecast by Product, 2018 to 2033 Table 31: MEA Market Value (US$ Million) Forecast by Technology, 2018 to 2033 Table 32: MEA Market Value (US$ Million) Forecast by End User , 2018 to 2033
Find your sweet spots for generating winning opportunities in this market.
Talk to AnalystList of Charts
Figure 1: Global Market Value (US$ Million) by Product, 2023 to 2033 Figure 2: Global Market Value (US$ Million) by Technology, 2023 to 2033 Figure 3: Global Market Value (US$ Million) by End User , 2023 to 2033 Figure 4: Global Market Value (US$ Million) by Region, 2023 to 2033 Figure 5: Global Market Value (US$ Million) Analysis by Region, 2018 to 2033 Figure 6: Global Market Value Share (%) and BPS Analysis by Region, 2023 to 2033 Figure 7: Global Market Y-o-Y Growth (%) Projections by Region, 2023 to 2033 Figure 8: Global Market Value (US$ Million) Analysis by Product, 2018 to 2033 Figure 9: Global Market Value Share (%) and BPS Analysis by Product, 2023 to 2033 Figure 10: Global Market Y-o-Y Growth (%) Projections by Product, 2023 to 2033 Figure 11: Global Market Value (US$ Million) Analysis by Technology, 2018 to 2033 Figure 12: Global Market Value Share (%) and BPS Analysis by Technology, 2023 to 2033 Figure 13: Global Market Y-o-Y Growth (%) Projections by Technology, 2023 to 2033 Figure 14: Global Market Value (US$ Million) Analysis by End User , 2018 to 2033 Figure 15: Global Market Value Share (%) and BPS Analysis by End User , 2023 to 2033 Figure 16: Global Market Y-o-Y Growth (%) Projections by End User , 2023 to 2033 Figure 17: Global Market Attractiveness by Product, 2023 to 2033 Figure 18: Global Market Attractiveness by Technology, 2023 to 2033 Figure 19: Global Market Attractiveness by End User , 2023 to 2033 Figure 20: Global Market Attractiveness by Region, 2023 to 2033 Figure 21: North America Market Value (US$ Million) by Product, 2023 to 2033 Figure 22: North America Market Value (US$ Million) by Technology, 2023 to 2033 Figure 23: North America Market Value (US$ Million) by End User , 2023 to 2033 Figure 24: North America Market Value (US$ Million) by Country, 2023 to 2033 Figure 25: North America Market Value (US$ Million) Analysis by Country, 2018 to 2033 Figure 26: North America Market Value Share (%) and BPS Analysis by Country, 2023 to 2033 Figure 27: North America Market Y-o-Y Growth (%) Projections by Country, 2023 to 2033 Figure 28: North America Market Value (US$ Million) Analysis by Product, 2018 to 2033 Figure 29: North America Market Value Share (%) and BPS Analysis by Product, 2023 to 2033 Figure 30: North America Market Y-o-Y Growth (%) Projections by Product, 2023 to 2033 Figure 31: North America Market Value (US$ Million) Analysis by Technology, 2018 to 2033 Figure 32: North America Market Value Share (%) and BPS Analysis by Technology, 2023 to 2033 Figure 33: North America Market Y-o-Y Growth (%) Projections by Technology, 2023 to 2033 Figure 34: North America Market Value (US$ Million) Analysis by End User , 2018 to 2033 Figure 35: North America Market Value Share (%) and BPS Analysis by End User , 2023 to 2033 Figure 36: North America Market Y-o-Y Growth (%) Projections by End User , 2023 to 2033 Figure 37: North America Market Attractiveness by Product, 2023 to 2033 Figure 38: North America Market Attractiveness by Technology, 2023 to 2033 Figure 39: North America Market Attractiveness by End User , 2023 to 2033 Figure 40: North America Market Attractiveness by Country, 2023 to 2033 Figure 41: Latin America Market Value (US$ Million) by Product, 2023 to 2033 Figure 42: Latin America Market Value (US$ Million) by Technology, 2023 to 2033 Figure 43: Latin America Market Value (US$ Million) by End User , 2023 to 2033 Figure 44: Latin America Market Value (US$ Million) by Country, 2023 to 2033 Figure 45: Latin America Market Value (US$ Million) Analysis by Country, 2018 to 2033 Figure 46: Latin America Market Value Share (%) and BPS Analysis by Country, 2023 to 2033 Figure 47: Latin America Market Y-o-Y Growth (%) Projections by Country, 2023 to 2033 Figure 48: Latin America Market Value (US$ Million) Analysis by Product, 2018 to 2033 Figure 49: Latin America Market Value Share (%) and BPS Analysis by Product, 2023 to 2033 Figure 50: Latin America Market Y-o-Y Growth (%) Projections by Product, 2023 to 2033 Figure 51: Latin America Market Value (US$ Million) Analysis by Technology, 2018 to 2033 Figure 52: Latin America Market Value Share (%) and BPS Analysis by Technology, 2023 to 2033 Figure 53: Latin America Market Y-o-Y Growth (%) Projections by Technology, 2023 to 2033 Figure 54: Latin America Market Value (US$ Million) Analysis by End User , 2018 to 2033 Figure 55: Latin America Market Value Share (%) and BPS Analysis by End User , 2023 to 2033 Figure 56: Latin America Market Y-o-Y Growth (%) Projections by End User , 2023 to 2033 Figure 57: Latin America Market Attractiveness by Product, 2023 to 2033 Figure 58: Latin America Market Attractiveness by Technology, 2023 to 2033 Figure 59: Latin America Market Attractiveness by End User , 2023 to 2033 Figure 60: Latin America Market Attractiveness by Country, 2023 to 2033 Figure 61: Europe Market Value (US$ Million) by Product, 2023 to 2033 Figure 62: Europe Market Value (US$ Million) by Technology, 2023 to 2033 Figure 63: Europe Market Value (US$ Million) by End User , 2023 to 2033 Figure 64: Europe Market Value (US$ Million) by Country, 2023 to 2033 Figure 65: Europe Market Value (US$ Million) Analysis by Country, 2018 to 2033 Figure 66: Europe Market Value Share (%) and BPS Analysis by Country, 2023 to 2033 Figure 67: Europe Market Y-o-Y Growth (%) Projections by Country, 2023 to 2033 Figure 68: Europe Market Value (US$ Million) Analysis by Product, 2018 to 2033 Figure 69: Europe Market Value Share (%) and BPS Analysis by Product, 2023 to 2033 Figure 70: Europe Market Y-o-Y Growth (%) Projections by Product, 2023 to 2033 Figure 71: Europe Market Value (US$ Million) Analysis by Technology, 2018 to 2033 Figure 72: Europe Market Value Share (%) and BPS Analysis by Technology, 2023 to 2033 Figure 73: Europe Market Y-o-Y Growth (%) Projections by Technology, 2023 to 2033 Figure 74: Europe Market Value (US$ Million) Analysis by End User , 2018 to 2033 Figure 75: Europe Market Value Share (%) and BPS Analysis by End User , 2023 to 2033 Figure 76: Europe Market Y-o-Y Growth (%) Projections by End User , 2023 to 2033 Figure 77: Europe Market Attractiveness by Product, 2023 to 2033 Figure 78: Europe Market Attractiveness by Technology, 2023 to 2033 Figure 79: Europe Market Attractiveness by End User , 2023 to 2033 Figure 80: Europe Market Attractiveness by Country, 2023 to 2033 Figure 81: South Asia Market Value (US$ Million) by Product, 2023 to 2033 Figure 82: South Asia Market Value (US$ Million) by Technology, 2023 to 2033 Figure 83: South Asia Market Value (US$ Million) by End User , 2023 to 2033 Figure 84: South Asia Market Value (US$ Million) by Country, 2023 to 2033 Figure 85: South Asia Market Value (US$ Million) Analysis by Country, 2018 to 2033 Figure 86: South Asia Market Value Share (%) and BPS Analysis by Country, 2023 to 2033 Figure 87: South Asia Market Y-o-Y Growth (%) Projections by Country, 2023 to 2033 Figure 88: South Asia Market Value (US$ Million) Analysis by Product, 2018 to 2033 Figure 89: South Asia Market Value Share (%) and BPS Analysis by Product, 2023 to 2033 Figure 90: South Asia Market Y-o-Y Growth (%) Projections by Product, 2023 to 2033 Figure 91: South Asia Market Value (US$ Million) Analysis by Technology, 2018 to 2033 Figure 92: South Asia Market Value Share (%) and BPS Analysis by Technology, 2023 to 2033 Figure 93: South Asia Market Y-o-Y Growth (%) Projections by Technology, 2023 to 2033 Figure 94: South Asia Market Value (US$ Million) Analysis by End User , 2018 to 2033 Figure 95: South Asia Market Value Share (%) and BPS Analysis by End User , 2023 to 2033 Figure 96: South Asia Market Y-o-Y Growth (%) Projections by End User , 2023 to 2033 Figure 97: South Asia Market Attractiveness by Product, 2023 to 2033 Figure 98: South Asia Market Attractiveness by Technology, 2023 to 2033 Figure 99: South Asia Market Attractiveness by End User , 2023 to 2033 Figure 100: South Asia Market Attractiveness by Country, 2023 to 2033 Figure 101: East Asia Market Value (US$ Million) by Product, 2023 to 2033 Figure 102: East Asia Market Value (US$ Million) by Technology, 2023 to 2033 Figure 103: East Asia Market Value (US$ Million) by End User , 2023 to 2033 Figure 104: East Asia Market Value (US$ Million) by Country, 2023 to 2033 Figure 105: East Asia Market Value (US$ Million) Analysis by Country, 2018 to 2033 Figure 106: East Asia Market Value Share (%) and BPS Analysis by Country, 2023 to 2033 Figure 107: East Asia Market Y-o-Y Growth (%) Projections by Country, 2023 to 2033 Figure 108: East Asia Market Value (US$ Million) Analysis by Product, 2018 to 2033 Figure 109: East Asia Market Value Share (%) and BPS Analysis by Product, 2023 to 2033 Figure 110: East Asia Market Y-o-Y Growth (%) Projections by Product, 2023 to 2033 Figure 111: East Asia Market Value (US$ Million) Analysis by Technology, 2018 to 2033 Figure 112: East Asia Market Value Share (%) and BPS Analysis by Technology, 2023 to 2033 Figure 113: East Asia Market Y-o-Y Growth (%) Projections by Technology, 2023 to 2033 Figure 114: East Asia Market Value (US$ Million) Analysis by End User , 2018 to 2033 Figure 115: East Asia Market Value Share (%) and BPS Analysis by End User , 2023 to 2033 Figure 116: East Asia Market Y-o-Y Growth (%) Projections by End User , 2023 to 2033 Figure 117: East Asia Market Attractiveness by Product, 2023 to 2033 Figure 118: East Asia Market Attractiveness by Technology, 2023 to 2033 Figure 119: East Asia Market Attractiveness by End User , 2023 to 2033 Figure 120: East Asia Market Attractiveness by Country, 2023 to 2033 Figure 121: Oceania Market Value (US$ Million) by Product, 2023 to 2033 Figure 122: Oceania Market Value (US$ Million) by Technology, 2023 to 2033 Figure 123: Oceania Market Value (US$ Million) by End User , 2023 to 2033 Figure 124: Oceania Market Value (US$ Million) by Country, 2023 to 2033 Figure 125: Oceania Market Value (US$ Million) Analysis by Country, 2018 to 2033 Figure 126: Oceania Market Value Share (%) and BPS Analysis by Country, 2023 to 2033 Figure 127: Oceania Market Y-o-Y Growth (%) Projections by Country, 2023 to 2033 Figure 128: Oceania Market Value (US$ Million) Analysis by Product, 2018 to 2033 Figure 129: Oceania Market Value Share (%) and BPS Analysis by Product, 2023 to 2033 Figure 130: Oceania Market Y-o-Y Growth (%) Projections by Product, 2023 to 2033 Figure 131: Oceania Market Value (US$ Million) Analysis by Technology, 2018 to 2033 Figure 132: Oceania Market Value Share (%) and BPS Analysis by Technology, 2023 to 2033 Figure 133: Oceania Market Y-o-Y Growth (%) Projections by Technology, 2023 to 2033 Figure 134: Oceania Market Value (US$ Million) Analysis by End User , 2018 to 2033 Figure 135: Oceania Market Value Share (%) and BPS Analysis by End User , 2023 to 2033 Figure 136: Oceania Market Y-o-Y Growth (%) Projections by End User , 2023 to 2033 Figure 137: Oceania Market Attractiveness by Product, 2023 to 2033 Figure 138: Oceania Market Attractiveness by Technology, 2023 to 2033 Figure 139: Oceania Market Attractiveness by End User , 2023 to 2033 Figure 140: Oceania Market Attractiveness by Country, 2023 to 2033 Figure 141: MEA Market Value (US$ Million) by Product, 2023 to 2033 Figure 142: MEA Market Value (US$ Million) by Technology, 2023 to 2033 Figure 143: MEA Market Value (US$ Million) by End User , 2023 to 2033 Figure 144: MEA Market Value (US$ Million) by Country, 2023 to 2033 Figure 145: MEA Market Value (US$ Million) Analysis by Country, 2018 to 2033 Figure 146: MEA Market Value Share (%) and BPS Analysis by Country, 2023 to 2033 Figure 147: MEA Market Y-o-Y Growth (%) Projections by Country, 2023 to 2033 Figure 148: MEA Market Value (US$ Million) Analysis by Product, 2018 to 2033 Figure 149: MEA Market Value Share (%) and BPS Analysis by Product, 2023 to 2033 Figure 150: MEA Market Y-o-Y Growth (%) Projections by Product, 2023 to 2033 Figure 151: MEA Market Value (US$ Million) Analysis by Technology, 2018 to 2033 Figure 152: MEA Market Value Share (%) and BPS Analysis by Technology, 2023 to 2033 Figure 153: MEA Market Y-o-Y Growth (%) Projections by Technology, 2023 to 2033 Figure 154: MEA Market Value (US$ Million) Analysis by End User , 2018 to 2033 Figure 155: MEA Market Value Share (%) and BPS Analysis by End User , 2023 to 2033 Figure 156: MEA Market Y-o-Y Growth (%) Projections by End User , 2023 to 2033 Figure 157: MEA Market Attractiveness by Product, 2023 to 2033 Figure 158: MEA Market Attractiveness by Technology, 2023 to 2033 Figure 159: MEA Market Attractiveness by End User , 2023 to 2033 Figure 160: MEA Market Attractiveness by Country, 2023 to 2033
Need specific information?
Request CustomizationExplore Healthcare Insights
View Reports