Multiplex Molecular Diagnostics Market Outlook (2022-2032)

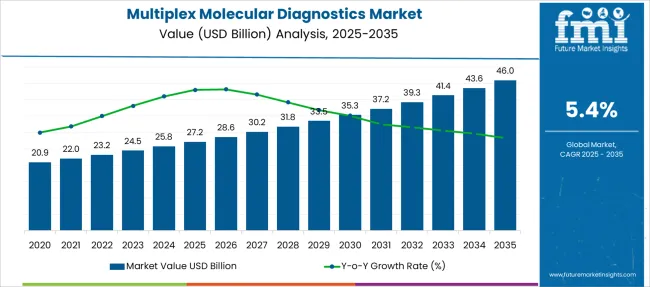
The multiplex molecular diagnostics market has anticipated a CAGR of 5.4% during the forecast period, up from US$ 23.2 Billion in 2022 to reach the valuation of US$ 39.25 Billion by 2032.

Attributes Details
Multiplex Molecular Diagnostic (CAGR) 5.4%
Multiplex Molecular Diagnostic (2022) US$ 23.2 Billion
Multiplex Molecular Diagnostic (2032) US$ 39.25 Billion

The demand for multiplex molecular diagnostics is anticipated to increase at a decent rate in the forecast period. An increase in economic stability leads to improve funding in healthcare and research, which leads to an increase in sales of multiplex molecular diagnostics.

An increase in the incidence of gastrointestinal, respiratory and CNS infections has led to the growth of the multiplex molecular diagnostics market. That’s why there is a huge demand for multiplex molecular diagnostics.

As the clinical symptoms of these diseases are not pathogen-specific, therefore its differential diagnosis is broad. Previously, for performing microbiologic diagnosis, one needed a combination of antigen tests, microscopy, culture, and pathogen-specific PCR assays.

Due to this, there is a widespread use of and demand for multiplex molecular diagnostics in healthcare centres.

As the multiplex molecular diagnostic approach came into practice, it simplified testing algorithms and laboratory workflow, which led to an increase in sales of multiplex molecular diagnostics.

Multiplex molecular diagnostics have significantly increased the diagnostic yield with the launch of multiplex PCRs; the tests have become more sensitive than the routine culture or antigen detection. This leads to generating sales of multiplex molecular diagnostics in the multiplex molecular diagnostics market.

Still, there are a few limitations to the current multiplex molecular diagnostics test. In its current form, multiplex molecular diagnostics cannot detect all potential pathogens, which can decline the sales of multiplex molecular diagnostics.

Besides, a negative panel result doesn’t on entirely exclude infection. Further, with panel-based methodology, current platforms offer few or limited options to select which organism targets needs to be tested. Due to this, the demand for multiplex molecular diagnostics can decrease in the marketplace.

Don't pay for what you don't need

Customize your report by selecting specific countries or regions and save 30%!

What are the Key Contributors to the Multiplex Molecular Diagnostics Market?

Several industries are the key contributors to the multiplex molecular diagnostic market. Some of them are clinical research, laboratory, hospitals, academic & research centres and others.

The multiplex molecular diagnostic is used to detect infections such as tuberculosis, chlamydia, H1N1 virus and other diseases. Due to identifying such diseases, there is likely to increase in demand for multiplex molecular diagnostics by the end users.

These industries are likely to grow the multiplex molecular diagnosis market share along with sales of multiplex molecular diagnostics in the coming forecast period.
What is the Regional Outlook for the Multiplex Molecular Diagnostics Market?

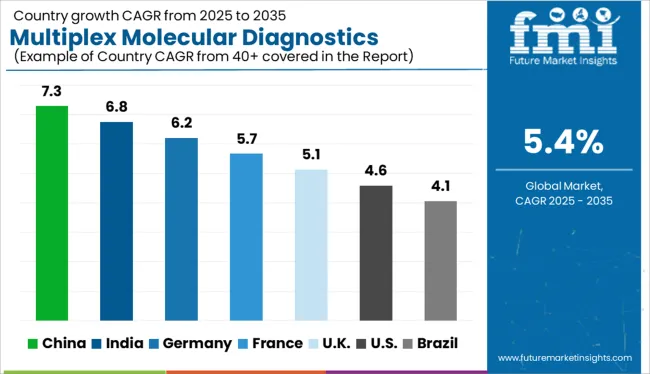
North America is anticipated to be the dominant revenue-generating region for the immunoaffinity columns multiplex molecular diagnostics market over the forecasting period. Demand for multiplex molecular diagnostics is likely to grow higher in this region as compared to others.

Many factors like well-developed high-tech diagnostic labs, the presence of a large number of key players, and favourable research funding are contributing to the high revenue generation in this region for multiplex molecular diagnostics market share.

After North America, Europe is anticipated to be the second most important region for the multiplex molecular diagnostics market share. This is attributed to the increased number of patient care and epidemiologic studies being conducted in this region.

The Asia Pacific regional multiplex molecular diagnostics market share is expected to grow at the fastest rate due to factors such as the rising adoption of advanced diagnostic technologies and the high prevalence of infectious diseases. This leads to an increase in sales of multiplex molecular diagnostics in the region.

The Middle East and Africa are expected to be the least lucrative region in the immunoaffinity columns multiplex molecular diagnostics market due to the lack of awareness about modern diagnostic techniques and the lack of advanced clinical laboratories.

Hence, there is expected to decline in the sales of multiplex molecular diagnostics in these regions.
Sabyasachi Ghosh
Sabyasachi Ghosh

Principal Consultant

Talk to Analyst

Find your sweet spots for generating winning opportunities in this market.

Who are the Key Players in the Multiplex Molecular Diagnostics Market?

Demand for multiplex molecular diagnostics is likely to increase in the manufacturing industries, which are playing a key role in the growth of the multiple molecular diagnostics market.

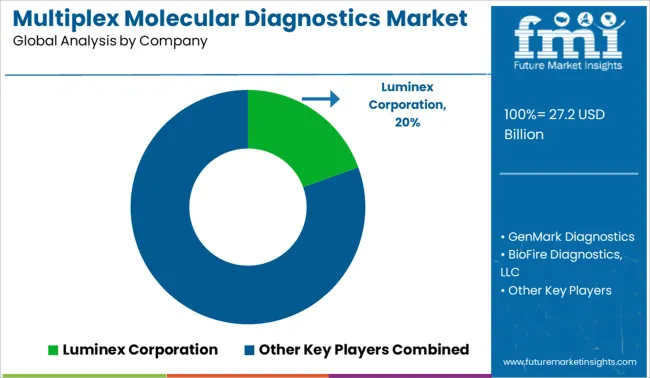
Some of the key players present in the multiplex molecular diagnostics market share include BD, bioMérieux SA, GenMark Diagnostics, Inc, Hologic, Luminex Corporation and many more. In addition, the presence of small and local manufacturers across the countries will account for competitiveness in the multiplex molecular diagnostics market.

These manufacturing companies are leading as key a player, which leads to an increase in the sales of multiplex molecular diagnostics in the forecast period.

Scope Of Report

Report Attribute Details
Growth Rate CAGR of  5.4% from 2022 to 2032
Base year for estimation 2022
Historical data 2015 – 2021
Forecast period 2023 – 2032
Quantitative units Revenue in USD billion and CAGR from 2022 to 2032
Report coverage Revenue forecast, volume forecast, company ranking, competitive landscape, growth factors, and trends, Pricing Analysis
Segments covered By Product, By Method, By End User & By Region
Regional scope North America; Latin America; Europe; Middle East and; Africa (MEA); East Asia; South Asia; Oceania
Country scope U.S., Canada, Mexico, Brazil, Argentina, Germany, Italy, France, U.K, Spain, Russia, India, Indonesia, Thailand, China, Japan, South Korea, Australia & New Zealand, GCC Countries, South Africa, North Africa
Key companies profiled BD, bioMérieux SA, GenMark Diagnostics, Inc, Hologic, Luminex Corporation and many more
Customization scope Free report customization (equivalent to up to 8 analysts working days) with purchase. Addition or alteration to country, regional & segment scope.
Pricing and purchase options Avail customized purchase options to meet your exact research needs.

Get the data you need at a Fraction of the cost

Personalize your report by choosing insights you need
and save 40%!

Key Segment

By Product:

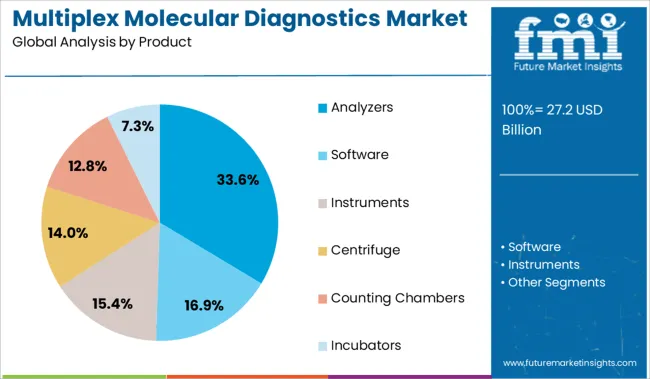
  • Analyzers
  • Software
  • Instruments
  • Centrifuge
  • Counting Chambers
  • Incubators

By Method:

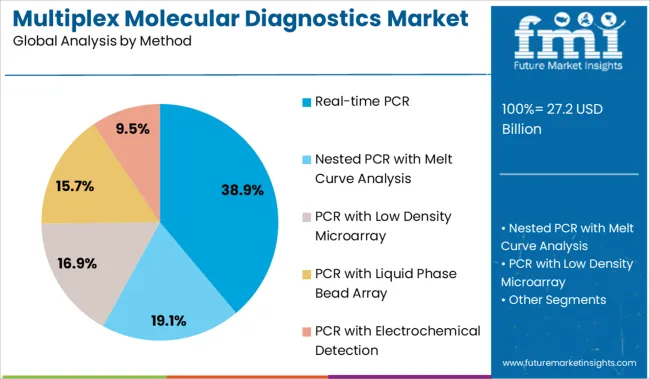
  • Real-time PCR
  • Nested PCR with Melt Curve Analysis
  • PCR with Low Density Microarray
  • PCR with Liquid Phase Bead Array
  • PCR with Electrochemical Detection

By End Use:

  • Clinical Research Laboratory
  • Hospitals
  • Academic & Research Centers
  • Others

Frequently Asked Questions

What is the Growth Outlook for the Multiplex Molecular Diagnostic Market?

The growth outlook for the multiplex molecular diagnostic market is predicted up to a CAGR of 5.4% during 2022-2032.

Which Region Leads the Multiplex Molecular Diagnostic Market?

The North America region is expected to lead the multiplex molecular diagnostic market during forecast period.

How much Growth Potential does the Multiplex Molecular Diagnostic Market Hold?

The multiplex molecular diagnostic market is likely to hold the valuation of US$ 39.25 Billion by 2032.

Which is the Key Driver in the Multiplex Molecular Diagnostic Market?

Healthcare Industry is expected to be a key driver in the multiplex molecular diagnostic market.

Table of Content
1. Executive Summary

    1.1. Global Market Outlook

    1.2. Demand-side Trends

    1.3. Supply-side Trends

    1.4. Technology Roadmap Analysis

    1.5. Analysis and Recommendations

2. Market Overview

    2.1. Market Coverage / Taxonomy

    2.2. Market Definition / Scope / Limitations

3. Market Background

    3.1. Market Dynamics

        3.1.1. Drivers

        3.1.2. Restraints

        3.1.3. Opportunity

        3.1.4. Trends

    3.2. Scenario Forecast

        3.2.1. Demand in Optimistic Scenario

        3.2.2. Demand in Likely Scenario

        3.2.3. Demand in Conservative Scenario

    3.3. Opportunity Map Analysis

    3.4. Product Life Cycle Analysis

    3.5. Supply Chain Analysis

        3.5.1. Supply Side Participants and their Roles

            3.5.1.1. Producers

            3.5.1.2. Mid-Level Participants (Traders/ Agents/ Brokers)

            3.5.1.3. Wholesalers and Distributors

        3.5.2. Value Added and Value Created at Node in the Supply Chain

        3.5.3. List of Raw Material Suppliers

        3.5.4. List of Existing and Potential Buyer’s

    3.6. Investment Feasibility Matrix

    3.7. Value Chain Analysis

        3.7.1. Profit Margin Analysis

        3.7.2. Wholesalers and Distributors

        3.7.3. Retailers

    3.8. PESTLE and Porter’s Analysis

    3.9. Regulatory Landscape

        3.9.1. By Key Regions

        3.9.2. By Key Countries

    3.10. Regional Parent Market Outlook

    3.11. Production and Consumption Statistics

    3.12. Import and Export Statistics

4. Global Multiplex Molecular Diagnostics Market Analysis 2017-2021 and Forecast, 2022-2032

    4.1. Historical Market Size Value (US$ Mn) & Volume (Units) Analysis, 2017-2021

    4.2. Current and Future Market Size Value (US$ Mn) & Volume (Units) Projections, 2022-2032

        4.2.1. Y-o-Y Growth Trend Analysis

        4.2.2. Absolute $ Opportunity Analysis

5. Global Multiplex Molecular Diagnostics Market Analysis 2017-2021 and Forecast 2022-2032, By Component Type

    5.1. Introduction / Key Findings

    5.2. Historical Market Size Value (US$ Mn) & Volume (Units) Analysis By Component Type, 2017-2021

    5.3. Current and Future Market Size Value (US$ Mn) & Volume (Units) Analysis and Forecast By Component Type, 2022-2032

        5.3.1. Systems

        5.3.2. Test Kits

        5.3.3. Reagents and Consumables

    5.4. Y-o-Y Growth Trend Analysis By Component Type, 2017-2021

    5.5. Absolute $ Opportunity Analysis By Component Type, 2022-2032

Deep-dive segmentation will be available in the sample on request

6. Global Multiplex Molecular Diagnostics Market Analysis 2017-2021 and Forecast 2022-2032, By Indication

    6.1. Introduction / Key Findings

    6.2. Historical Market Size Value (US$ Mn) & Volume (Units) Analysis By Indication, 2017-2021

    6.3. Current and Future Market Size Value (US$ Mn) & Volume (Units) Analysis and Forecast By Indication, 2022-2032

        6.3.1. Respiratory Diseases

        6.3.2. Gastrointestinal Diseases

        6.3.3. CNS Infections

    6.4. Y-o-Y Growth Trend Analysis By Indication, 2017-2021

    6.5. Absolute $ Opportunity Analysis By Indication, 2022-2032

Deep-dive segmentation will be available in the sample on request

7. Global Multiplex Molecular Diagnostics Market Analysis 2017-2021 and Forecast 2022-2032, By End User

    7.1. Introduction / Key Findings

    7.2. Historical Market Size Value (US$ Mn) & Volume (Units) Analysis By End User, 2017-2021

    7.3. Current and Future Market Size Value (US$ Mn) & Volume (Units) Analysis and Forecast By End User, 2022-2032

        7.3.1. Hospitals

        7.3.2. Diagnostic Laboratories

        7.3.3. Specialty Clinics

        7.3.4. Academic and Research Institutes

    7.4. Y-o-Y Growth Trend Analysis By End User, 2017-2021

    7.5. Absolute $ Opportunity Analysis By End User, 2022-2032

Deep-dive segmentation will be available in the sample on request

8. Global Multiplex Molecular Diagnostics Market Analysis 2017-2021 and Forecast 2022-2032, By Region

    8.1. Introduction

    8.2. Historical Market Size Value (US$ Mn) & Volume (Units) Analysis By Region, 2017-2021

    8.3. Current Market Size Value (US$ Mn) & Volume (Units) Analysis and Forecast By Region, 2022-2032

        8.3.1. North America

        8.3.2. Latin America

        8.3.3. Europe

        8.3.4. East Asia

        8.3.5. South Asia & Pacific

        8.3.6. MEA

    8.4. Market Attractiveness Analysis By Region

9. North America Multiplex Molecular Diagnostics Market Analysis 2017-2021 and Forecast 2022-2032, By Country

    9.1. Historical Market Size Value (US$ Mn) & Volume (Units) Trend Analysis By Market Taxonomy, 2017-2021

    9.2. Market Size Value (US$ Mn) & Volume (Units) Forecast By Market Taxonomy, 2022-2032

        9.2.1. By Country

            9.2.1.1. U.S.

            9.2.1.2. Canada

        9.2.2. By Component Type

        9.2.3. By Indication

        9.2.4. By End User

    9.3. Market Attractiveness Analysis

        9.3.1. By Country

        9.3.2. By Component Type

        9.3.3. By Indication

        9.3.4. By End User

    9.4. Key Takeaways

10. Latin America Multiplex Molecular Diagnostics Market Analysis 2017-2021 and Forecast 2022-2032, By Country

    10.1. Historical Market Size Value (US$ Mn) & Volume (Units) Trend Analysis By Market Taxonomy, 2017-2021

    10.2. Market Size Value (US$ Mn) & Volume (Units) Forecast By Market Taxonomy, 2022-2032

        10.2.1. By Country

            10.2.1.1. Brazil

            10.2.1.2. Mexico

            10.2.1.3. Rest of Latin America

        10.2.2. By Component Type

        10.2.3. By Indication

        10.2.4. By End User

    10.3. Market Attractiveness Analysis

        10.3.1. By Country

        10.3.2. By Component Type

        10.3.3. By Indication

        10.3.4. By End User

    10.4. Key Takeaways

11. Europe Multiplex Molecular Diagnostics Market Analysis 2017-2021 and Forecast 2022-2032, By Country

    11.1. Historical Market Size Value (US$ Mn) & Volume (Units) Trend Analysis By Market Taxonomy, 2017-2021

    11.2. Market Size Value (US$ Mn) & Volume (Units) Forecast By Market Taxonomy, 2022-2032

        11.2.1. By Country

            11.2.1.1. Germany

            11.2.1.2. U.K.

            11.2.1.3. France

            11.2.1.4. Spain

            11.2.1.5. Italy

            11.2.1.6. Rest of Europe

        11.2.2. By Component Type

        11.2.3. By Indication

        11.2.4. By End User

    11.3. Market Attractiveness Analysis

        11.3.1. By Country

        11.3.2. By Component Type

        11.3.3. By Indication

        11.3.4. By End User

    11.4. Key Takeaways

12. East Asia Multiplex Molecular Diagnostics Market Analysis 2017-2021 and Forecast 2022-2032, By Country

    12.1. Historical Market Size Value (US$ Mn) & Volume (Units) Trend Analysis By Market Taxonomy, 2017-2021

    12.2. Market Size Value (US$ Mn) & Volume (Units) Forecast By Market Taxonomy, 2022-2032

        12.2.1. By Country

            12.2.1.1. China

            12.2.1.2. Japan

            12.2.1.3. South Korea

        12.2.2. By Component Type

        12.2.3. By Indication

        12.2.4. By End User

    12.3. Market Attractiveness Analysis

        12.3.1. By Country

        12.3.2. By Component Type

        12.3.3. By Indication

        12.3.4. By End User

    12.4. Key Takeaways

13. South Asia & Pacific Multiplex Molecular Diagnostics Market Analysis 2017-2021 and Forecast 2022-2032, By Country

    13.1. Historical Market Size Value (US$ Mn) & Volume (Units) Trend Analysis By Market Taxonomy, 2017-2021

    13.2. Market Size Value (US$ Mn) & Volume (Units) Forecast By Market Taxonomy, 2022-2032

        13.2.1. By Country

            13.2.1.1. India

            13.2.1.2. Thailand

            13.2.1.3. Indonesia

            13.2.1.4. Malaysia

            13.2.1.5. Singapore

            13.2.1.6. Australia

            13.2.1.7. New Zealand

            13.2.1.8. Rest of South Asia & Pacific

        13.2.2. By Component Type

        13.2.3. By Indication

        13.2.4. By End User

    13.3. Market Attractiveness Analysis

        13.3.1. By Country

        13.3.2. By Component Type

        13.3.3. By Indication

        13.3.4. By End User

    13.4. Key Takeaways

14. MEA Multiplex Molecular Diagnostics Market Analysis 2017-2021 and Forecast 2022-2032, By Country

    14.1. Historical Market Size Value (US$ Mn) & Volume (Units) Trend Analysis By Market Taxonomy, 2017-2021

    14.2. Market Size Value (US$ Mn) & Volume (Units) Forecast By Market Taxonomy, 2022-2032

        14.2.1. By Country

            14.2.1.1. GCC Countries

            14.2.1.2. South Africa

            14.2.1.3. Israel

            14.2.1.4. Rest of MEA

        14.2.2. By Component Type

        14.2.3. By Indication

        14.2.4. By End User

    14.3. Market Attractiveness Analysis

        14.3.1. By Country

        14.3.2. By Component Type

        14.3.3. By Indication

        14.3.4. By End User

    14.4. Key Takeaways

15. Key Countries Multiplex Molecular Diagnostics Market Analysis

    15.1. U.S.

        15.1.1. Pricing Analysis

        15.1.2. Market Share Analysis, 2021

            15.1.2.1. By Component Type

            15.1.2.2. By Indication

            15.1.2.3. By End User

    15.2. Canada

        15.2.1. Pricing Analysis

        15.2.2. Market Share Analysis, 2021

            15.2.2.1. By Component Type

            15.2.2.2. By Indication

            15.2.2.3. By End User

    15.3. Brazil

        15.3.1. Pricing Analysis

        15.3.2. Market Share Analysis, 2021

            15.3.2.1. By Component Type

            15.3.2.2. By Indication

            15.3.2.3. By End User

    15.4. Mexico

        15.4.1. Pricing Analysis

        15.4.2. Market Share Analysis, 2021

            15.4.2.1. By Component Type

            15.4.2.2. By Indication

            15.4.2.3. By End User

    15.5. Germany

        15.5.1. Pricing Analysis

        15.5.2. Market Share Analysis, 2021

            15.5.2.1. By Component Type

            15.5.2.2. By Indication

            15.5.2.3. By End User

    15.6. U.K.

        15.6.1. Pricing Analysis

        15.6.2. Market Share Analysis, 2021

            15.6.2.1. By Component Type

            15.6.2.2. By Indication

            15.6.2.3. By End User

    15.7. France

        15.7.1. Pricing Analysis

        15.7.2. Market Share Analysis, 2021

            15.7.2.1. By Component Type

            15.7.2.2. By Indication

            15.7.2.3. By End User

    15.8. Spain

        15.8.1. Pricing Analysis

        15.8.2. Market Share Analysis, 2021

            15.8.2.1. By Component Type

            15.8.2.2. By Indication

            15.8.2.3. By End User

    15.9. Italy

        15.9.1. Pricing Analysis

        15.9.2. Market Share Analysis, 2021

            15.9.2.1. By Component Type

            15.9.2.2. By Indication

            15.9.2.3. By End User

    15.10. China

        15.10.1. Pricing Analysis

        15.10.2. Market Share Analysis, 2021

            15.10.2.1. By Component Type

            15.10.2.2. By Indication

            15.10.2.3. By End User

    15.11. Japan

        15.11.1. Pricing Analysis

        15.11.2. Market Share Analysis, 2021

            15.11.2.1. By Component Type

            15.11.2.2. By Indication

            15.11.2.3. By End User

    15.12. South Korea

        15.12.1. Pricing Analysis

        15.12.2. Market Share Analysis, 2021

            15.12.2.1. By Component Type

            15.12.2.2. By Indication

            15.12.2.3. By End User

    15.13. India

        15.13.1. Pricing Analysis

        15.13.2. Market Share Analysis, 2021

            15.13.2.1. By Component Type

            15.13.2.2. By Indication

            15.13.2.3. By End User

    15.14. Thailand

        15.14.1. Pricing Analysis

        15.14.2. Market Share Analysis, 2021

            15.14.2.1. By Component Type

            15.14.2.2. By Indication

            15.14.2.3. By End User

    15.15. Indonesia

        15.15.1. Pricing Analysis

        15.15.2. Market Share Analysis, 2021

            15.15.2.1. By Component Type

            15.15.2.2. By Indication

            15.15.2.3. By End User

    15.16. Malaysia

        15.16.1. Pricing Analysis

        15.16.2. Market Share Analysis, 2021

            15.16.2.1. By Component Type

            15.16.2.2. By Indication

            15.16.2.3. By End User

    15.17. Singapore

        15.17.1. Pricing Analysis

        15.17.2. Market Share Analysis, 2021

            15.17.2.1. By Component Type

            15.17.2.2. By Indication

            15.17.2.3. By End User

    15.18. Australia

        15.18.1. Pricing Analysis

        15.18.2. Market Share Analysis, 2021

            15.18.2.1. By Component Type

            15.18.2.2. By Indication

            15.18.2.3. By End User

    15.19. New Zealand

        15.19.1. Pricing Analysis

        15.19.2. Market Share Analysis, 2021

            15.19.2.1. By Component Type

            15.19.2.2. By Indication

            15.19.2.3. By End User

    15.20. GCC Countries

        15.20.1. Pricing Analysis

        15.20.2. Market Share Analysis, 2021

            15.20.2.1. By Component Type

            15.20.2.2. By Indication

            15.20.2.3. By End User

    15.21. South Africa

        15.21.1. Pricing Analysis

        15.21.2. Market Share Analysis, 2021

            15.21.2.1. By Component Type

            15.21.2.2. By Indication

            15.21.2.3. By End User

    15.22. Israel

        15.22.1. Pricing Analysis

        15.22.2. Market Share Analysis, 2021

            15.22.2.1. By Component Type

            15.22.2.2. By Indication

            15.22.2.3. By End User

16. Market Structure Analysis

    16.1. Competition Dashboard

    16.2. Competition Benchmarking

    16.3. Market Share Analysis of Top Players

        16.3.1. By Regional

        16.3.2. By Component Type

        16.3.3. By Indication

        16.3.4. By End User

17. Competition Analysis

    17.1. Competition Deep Dive

        17.1.1. Luminex Corporation

            17.1.1.1. Overview

            17.1.1.2. Product Portfolio

            17.1.1.3. Profitability by Market Segments

            17.1.1.4. Sales Footprint

            17.1.1.5. Strategy Overview

                17.1.1.5.1. Marketing Strategy

                17.1.1.5.2. Product Strategy

                17.1.1.5.3. Channel Strategy

        17.1.2. GenMark Diagnostics

            17.1.2.1. Overview

            17.1.2.2. Product Portfolio

            17.1.2.3. Profitability by Market Segments

            17.1.2.4. Sales Footprint

            17.1.2.5. Strategy Overview

                17.1.2.5.1. Marketing Strategy

                17.1.2.5.2. Product Strategy

                17.1.2.5.3. Channel Strategy

        17.1.3. BioFire Diagnostics, LLC

            17.1.3.1. Overview

            17.1.3.2. Product Portfolio

            17.1.3.3. Profitability by Market Segments

            17.1.3.4. Sales Footprint

            17.1.3.5. Strategy Overview

                17.1.3.5.1. Marketing Strategy

                17.1.3.5.2. Product Strategy

                17.1.3.5.3. Channel Strategy

        17.1.4. SiemensAG

            17.1.4.1. Overview

            17.1.4.2. Product Portfolio

            17.1.4.3. Profitability by Market Segments

            17.1.4.4. Sales Footprint

            17.1.4.5. Strategy Overview

                17.1.4.5.1. Marketing Strategy

                17.1.4.5.2. Product Strategy

                17.1.4.5.3. Channel Strategy

        17.1.5. BioMérieux

            17.1.5.1. Overview

            17.1.5.2. Product Portfolio

            17.1.5.3. Profitability by Market Segments

            17.1.5.4. Sales Footprint

            17.1.5.5. Strategy Overview

                17.1.5.5.1. Marketing Strategy

                17.1.5.5.2. Product Strategy

                17.1.5.5.3. Channel Strategy

        17.1.6. Abbott Laboratories

            17.1.6.1. Overview

            17.1.6.2. Product Portfolio

            17.1.6.3. Profitability by Market Segments

            17.1.6.4. Sales Footprint

            17.1.6.5. Strategy Overview

                17.1.6.5.1. Marketing Strategy

                17.1.6.5.2. Product Strategy

                17.1.6.5.3. Channel Strategy

        17.1.7. EMPE Diagnostics AB

            17.1.7.1. Overview

            17.1.7.2. Product Portfolio

            17.1.7.3. Profitability by Market Segments

            17.1.7.4. Sales Footprint

            17.1.7.5. Strategy Overview

                17.1.7.5.1. Marketing Strategy

                17.1.7.5.2. Product Strategy

                17.1.7.5.3. Channel Strategy

        17.1.8. ELITechGroup

            17.1.8.1. Overview

            17.1.8.2. Product Portfolio

            17.1.8.3. Profitability by Market Segments

            17.1.8.4. Sales Footprint

            17.1.8.5. Strategy Overview

                17.1.8.5.1. Marketing Strategy

                17.1.8.5.2. Product Strategy

                17.1.8.5.3. Channel Strategy

        17.1.9. XCR Diagnostics

            17.1.9.1. Overview

            17.1.9.2. Product Portfolio

            17.1.9.3. Profitability by Market Segments

            17.1.9.4. Sales Footprint

            17.1.9.5. Strategy Overview

                17.1.9.5.1. Marketing Strategy

                17.1.9.5.2. Product Strategy

                17.1.9.5.3. Channel Strategy

        17.1.10. Laboratory Corporation of America Holdings

            17.1.10.1. Overview

            17.1.10.2. Product Portfolio

            17.1.10.3. Profitability by Market Segments

            17.1.10.4. Sales Footprint

            17.1.10.5. Strategy Overview

                17.1.10.5.1. Marketing Strategy

                17.1.10.5.2. Product Strategy

                17.1.10.5.3. Channel Strategy

18. Assumptions & Acronyms Used

19. Research Methodology
Recommendations

Healthcare

Molecular Diagnostic Market

February 2016

REP-GB-1262

March 2024

333 pages

Healthcare

Companion Diagnostics Market

February 2016

REP-GB-1255

August 2023

342 pages

Explore Healthcare Insights

View Reports
Future Market Insights

Multiplex Molecular Diagnostics Market