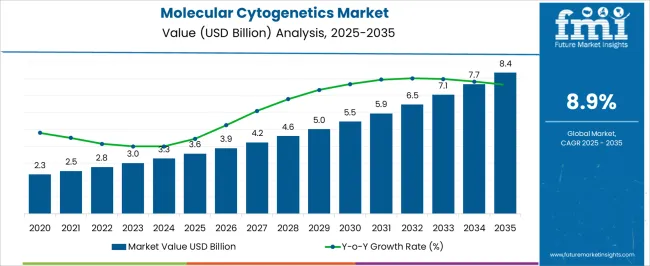
The Molecular Cytogenetics Market is estimated to be valued at USD 3.6 billion in 2025 and is projected to reach USD 8.4 billion by 2035, registering a compound annual growth rate (CAGR) of 8.9% over the forecast period.
| Metric | Value |
|---|---|
| Molecular Cytogenetics Market Estimated Value in (2025 E) | USD 3.6 billion |
| Molecular Cytogenetics Market Forecast Value in (2035 F) | USD 8.4 billion |
| Forecast CAGR (2025 to 2035) | 8.9% |
The molecular cytogenetics market is witnessing robust growth as healthcare systems and life science sectors increasingly focus on targeted diagnostics, genetic profiling, and personalized medicine. This momentum is supported by the widespread adoption of advanced cytogenetic techniques to detect chromosomal abnormalities in oncology, prenatal diagnostics, and rare genetic disorders. The growing prevalence of genetic diseases and cancer, along with increased access to molecular diagnostic technologies, is creating strong demand for high-resolution chromosomal imaging.
Investments in genomics research and biopharmaceutical innovation are also catalyzing the integration of cytogenetic tools into research and clinical workflows. Furthermore, the shift toward non-invasive testing, expansion of clinical trial pipelines, and the rising importance of companion diagnostics are reinforcing the relevance of molecular cytogenetics.
As automation and digital pathology platforms evolve, laboratories and research institutions are increasingly adopting scalable cytogenetic solutions, ensuring consistent growth in the market Regulatory support and rising awareness in emerging economies are further expected to accelerate adoption in the forecast period.
The market is segmented by Technique Type, Product Type, and End User and region. By Technique Type, the market is divided into Fluorescence In Situ Hybridization, Genomic In Situ Hybridization, Multicolour Fluorescence In Situ Hybridization, Multiplex Fluorescence In Situ Hybridization, Spectral Karyotyping, Comparative Genomic Hybridization, Array Comparative Genomic Hybridization, and Other Molecular Cytogenetic Techniques. In terms of Product Type, the market is classified into Reagents & Kits and Instruments. Based on End User, the market is segmented into Pharmaceutical & Biotechnology Companies, Clinical Research Laboratories, Research & Academic Institutes, Hospitals, and Diagnostic Centers. Regionally, the market is classified into North America, Latin America, Western Europe, Eastern Europe, Balkan & Baltic Countries, Russia & Belarus, Central Asia, East Asia, South Asia & Pacific, and the Middle East & Africa.
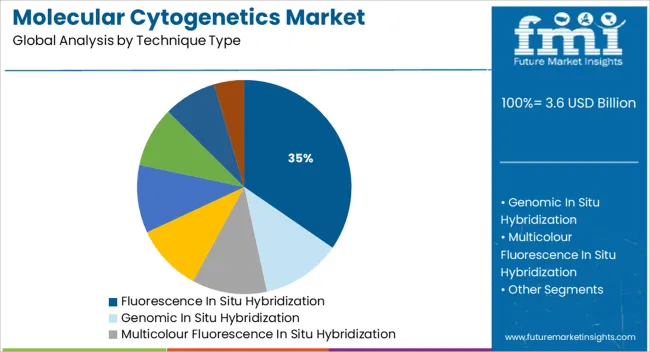
The fluorescence in situ hybridization technique segment is projected to account for 34.6% of the total revenue share in the molecular cytogenetics market in 2025, reflecting its critical role in modern cytogenetic analysis. The segment’s prominence is being driven by its proven efficacy in detecting chromosomal abnormalities at a high resolution and its compatibility with a broad range of sample types including formalin-fixed tissues.
This technique has been widely adopted in clinical genetics, cancer diagnostics, and hematological studies due to its rapid turnaround time, sensitivity, and multiplexing capabilities. Its integration into oncology workflows for gene amplification and translocation detection has significantly enhanced diagnostic precision.
Furthermore, the method's ability to deliver quantitative and spatial data within the cellular context has reinforced its application in both research and clinical environments The sustained advancements in probe design, imaging platforms, and signal detection software have made this technique more accessible, further supporting its continued expansion across diagnostic laboratories and research facilities.
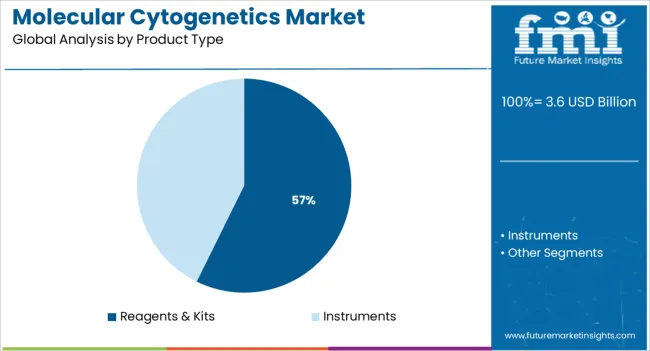
The reagents and kits product segment is expected to contribute 57.3% of the revenue share in the molecular cytogenetics market in 2025, highlighting its vital role in driving consumables demand across laboratory settings. The growth of this segment is being propelled by the rising volume of cytogenetiC testing, which requires frequent and reliable reagent replenishment to maintain workflow efficiency and accuracy.
Reagents and kits are essential for ensuring standardized assay performance and reproducibility, especially in high-throughput environments. Their increasing usage in cancer cytogenetics, prenatal diagnostics, and gene mapping has been supported by manufacturers offering validated, easy-to-use solutions compatible with automated platforms.
Additionally, the emphasis on quality control and assay standardization has driven laboratories to adopt pre-validated kits over manual reagent preparation Ongoing innovation in probe chemistry, buffer solutions, and hybridization protocols is further enhancing product performance, while strategic partnerships between suppliers and diagnostic labs are expanding the global availability of high-quality consumables.
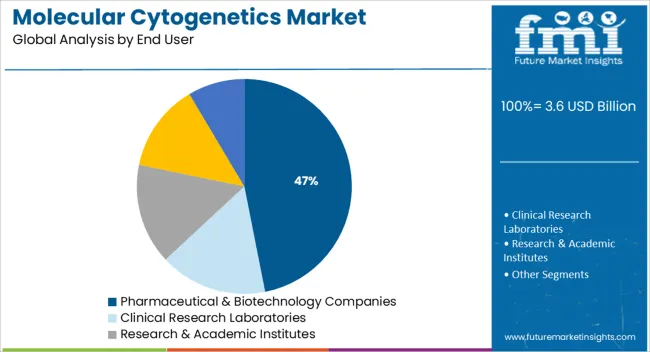
Pharmaceutical and biotechnology companies are anticipated to hold 46.9% of the total revenue share in the molecular cytogenetics market in 2025, establishing this segment as a key driver of market growth. The rising utilization of cytogenetic techniques in drug discovery, biomarker identification, and clinical trial stratification has significantly influenced demand from this end-user group.
Molecular cytogenetics provides valuable insights into chromosomal integrity, mutation profiling, and gene rearrangements, all of which are critical for validating therapeutic targets and ensuring regulatory compliance. As personalized medicine gains traction, these companies are increasingly integrating cytogenetic workflows into translational research and companion diagnostic development.
The need for accurate genetic characterization during preclinical studies and pharmacogenomic analysis has further intensified the adoption of advanced cytogenetic tools Additionally, partnerships with academic research centers and diagnostic service providers have enhanced data access and technology transfer, allowing pharmaceutical and biotech firms to streamline drug development pipelines while ensuring data reliability and regulatory alignment.
The Growing Prevalence of Cancer to Boost the Growth of The Molecular Cytogenetics Market
Molecular cytogenetics provides a scan and analysis of the whole genome organization, its structure and behavior at high resolutions, and also the visualization of single peculiar genomic loci which is a major growth driver for the global molecular cytogenetics market.
The recent advances in the fields of molecular biology and cytogenetics have brought about several key developments in the research of mitosis and meiosis processes, chromosome structures and their subsequent manipulation, gene expression, regulation, and gene silencing techniques.
Molecular cytogenetics is primarily driven by cancer diagnostics which offers techniques for imaging in genetics, epigenetics, and cytology and can be utilized for chromosomal modifications. The increasing prevalence of cancer and subsequent requirement for accurate diagnosis is expected to boost the growth of the global molecular cytogenetics market from 2025 to 2035
Lack of Skilled professional May Impede the Growth of the Market
There are some factors that are expected to impede the growth of the molecular cytogenetics market over the analysis period, such as technical limitations and complexities associated with the equipment.
However, the high cost of cytogenetic instruments, and lack of awareness about advanced technological methodologies, especially in low and middle-income countries, and the high cost of sophisticated devices are also expected to hinder the market growth during the forecast period.
The growing demand for genetic tests is an opportunity for the global molecular cytogenetics market. However, strict regulatory frameworks and a lack of skilled professionals are some of the major challenges for the global molecular cytogenetics market.
Technically Advance Healthcare Sector in North America to Boost the Growth
North America is expected to accumulate a 31.2% revenue share in 2025. North America is the market leader regarding revenue in the global molecular cytogenetics market owing to the presence of a large number of clinical research laboratories and research & academic institutes.
The rise in the incidences of cancer, growing spending from government and private healthcare organizations, and improved healthcare infrastructure in this region also boost the molecular cytogenetics market.
For instance, the average probability of a woman in the United States acquiring breast cancer in her lifetime is about 13%. An estimated 234,030 new instances of lung cancer were discovered in 2020, and there are already 541,000 Americans who have been diagnosed with lung cancer at some time in their lives. These findings show the vast potential for development and expansion in the USA molecular cytogenetics market.
An Increase in R& D Activities in The Region Propels the Growth of the Market
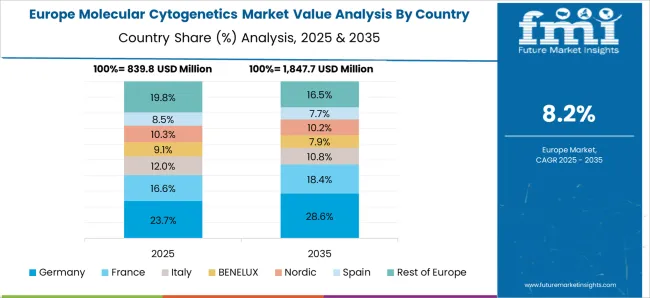
According to Future Market Insights, Europe is expected to provide immense growth opportunities for molecular cytogenetics and is expected to accumulate 19.6% revenue in 2025.
Europe is expected to witness the largest market growth, owing to the presence of a huge population in need, a high birth rate, the rising caseload of pre and postnatal disorders, and an increasing number of cases of different types of cancer.
The growth of the market in the region is attributed to the increasing research and development activities, rise in government intervention, growing awareness regarding cancer molecular biomarkers, and improving healthcare infrastructure in the region.
Asia is expected to show high growth rates in the next five years in the molecular cytogenetics market. Some of the factors driving the growth of molecular cytogenetics in emerging markets are the increasing demand for genetic tests, advancements in healthcare infrastructure, and a large patient pool in countries such as India and China.
Also, the large number of research centers in China and India and Research and Development (R&D) centers in Japan will lead to a rise in demand for high-quality of molecular cytogenetics. Japan is the major contributor to the global molecular cytogenetics market mainly due to the well-established collaborations between manufacturers and research laboratories.
Also, the role of personalized medicine in the treatment of genetic or other disorders is gaining pace in developed countries and this factor is anticipated to unfold novel opportunities for the key players during the forecast period.
The new entrants in the molecular cytogenetics market are continually indulging in several collaborations and highly investing in research and development activities to provide more convenient solutions to industry verticals. Some of the major start-ups that are leading the development of the market are -Cepheid, Map my Genome, and Medgenome.
Some of the key participants present in the global molecular cytogenetics market include Thermo Fisher Scientific Inc., GeneDx, CytoTest Inc., Empire Genomics, Abbott Laboratories, Agilent Technologies, Biological Industries, and PerkinElmer Inc. among others.
Attributed to the presence of such a high number of participants, the market is highly competitive. While global players such as Thermo Fisher Scientific Inc., GeneDx, CytoTest Inc., Empire Genomics, and Abbott Laboratories account for considerable market size, several regional-level players are also operating across key growth regions, particularly in the Asia Pacific.
| Report Attribute | Details |
|---|---|
| Growth Rate | CAGR of 8.9% from 2025 to 2035 |
| Expected Market Value (2025) | USD 3.6 billion |
| Anticipated Forecast Value (2035) | USD 8.4 billion |
| Base Year for Estimation | 2024 |
| Historical Data | 2020 to 2024 |
| Forecast Period | 2025 to 2035 |
| Quantitative Units | Revenue in USD Million and CAGR from 2025 to 2035 |
| Report Coverage | Revenue Forecast, Volume Forecast, Company Ranking, Competitive Landscape, Growth Factors, Trends, and Pricing Analysis |
| Segments Covered | Technique Type, Product Type, End User, Region |
| Regions Covered | North America; Latin America; Europe; Asia Pacific; Middle East and Africa |
| Key Countries Profiled | The USA, Canada, Mexico, Brazil, Germany, Italy, France, The United Kingdom, Spain, China, Japan, South Korea, Malaysia, Singapore, Australia, GCC, South Africa, Israel |
| Key Companies Profiled | Thermo Fisher Scientific Inc.; GeneDx; CytoTest Inc.; Empire Genomics; Abbott Laboratories; Agilent Technologies; Biological Industries; PerkinElmer Inc.; Bio-RAD Laboratories Inc.; F. Hoffmann-La Roche AG |
| Customization | Available Upon Request |
The global molecular cytogenetics market is estimated to be valued at USD 3.6 billion in 2025.
The market size for the molecular cytogenetics market is projected to reach USD 8.4 billion by 2035.
The molecular cytogenetics market is expected to grow at a 8.9% CAGR between 2025 and 2035.
The key product types in molecular cytogenetics market are fluorescence in situ hybridization, genomic in situ hybridization, multicolour fluorescence in situ hybridization, multiplex fluorescence in situ hybridization, spectral karyotyping, comparative genomic hybridization, array comparative genomic hybridization and other molecular cytogenetic techniques.
In terms of product type, reagents & kits segment to command 57.3% share in the molecular cytogenetics market in 2025.


Full Research Suite comprises of:
Market outlook & trends analysis
Interviews & case studies
Strategic recommendations
Vendor profiles & capabilities analysis
5-year forecasts
8 regions and 60+ country-level data splits
Market segment data splits
12 months of continuous data updates
DELIVERED AS:
PDF EXCEL ONLINE
Molecular Diagnostic Market Size and Share Forecast Outlook 2025 to 2035
Molecular Respiratory Panels Market Size and Share Forecast Outlook 2025 to 2035
Molecular Diagnostics In Pharmacogenomics Market Size and Share Forecast Outlook 2025 to 2035
Molecular Biomarkers For Cancer Detection Market Size and Share Forecast Outlook 2025 to 2035
Molecular Biology Enzymes, Kits & Reagents Market Trends and Forecast 2025 to 2035
Molecular Spectroscopy Market Insights - Growth & Forecast 2025 to 2035
Molecular Breast Imaging Market – Trends & Forecast 2025 to 2035
Molecular Quality Controls Market Overview - Trends & Forecast 2025 to 2035
Molecular Imaging Market is segmented by modality type, application and end user from 2025 to 2035
Molecular Microbiology Market
Low Molecular Weight Chondroitin Sulfate Sodium Market Size and Share Forecast Outlook 2025 to 2035
13X Molecular Sieve Activated Powder Market Size and Share Forecast Outlook 2025 to 2035
High Molecular Ammonium Polyphosphate Market Size and Share Forecast Outlook 2025 to 2035
Orthomolecular Medicine Market
Viral Molecular Diagnostics Market Size and Share Forecast Outlook 2025 to 2035
At-home Molecular Testing Market Size and Share Forecast Outlook 2025 to 2035
Airborne Molecular Contamination Control Services Market Forecast and Outlook 2025 to 2035
Automated Molecular Diagnostics Testing System Market Size and Share Forecast Outlook 2025 to 2035
Multiplex Molecular Diagnostics Market Size and Share Forecast Outlook 2025 to 2035
Veterinary Molecular Diagnostics Market Growth - Trends & Forecast 2025 to 2035

Thank you!
You will receive an email from our Business Development Manager. Please be sure to check your SPAM/JUNK folder too.
Chat With
MaRIA