Veterinary Molecular Diagnostics Market Size and Share Forecast Outlook 2025 to 2035

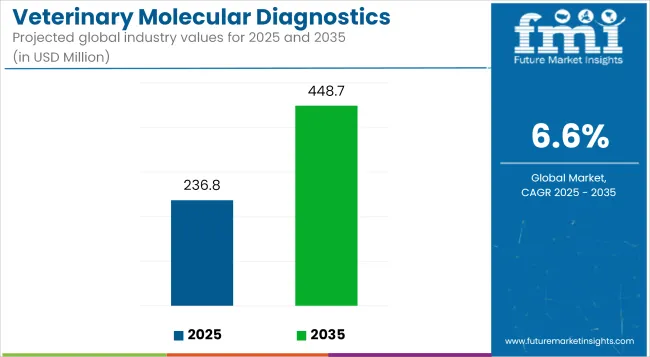
The global Veterinary Molecular Diagnostics Market is estimated to be valued at USD 236.8 Million in 2025 and is projected to reach USD 448.7 Million by 2035, registering a CAGR of 6.6% over the forecast period.
Quick Stats for Veterinary Molecular Diagnostics Market

  • Industry Value (2025): USD 236.8 million
  • Forecast Value (2035): USD 448.7 million
  • Forecast CAGR: 6.6%
  • Leading Segment in 2025: PCR Kits (68.5% share)
  • Key Growth Region: North America, Europe, Asia-Pacific
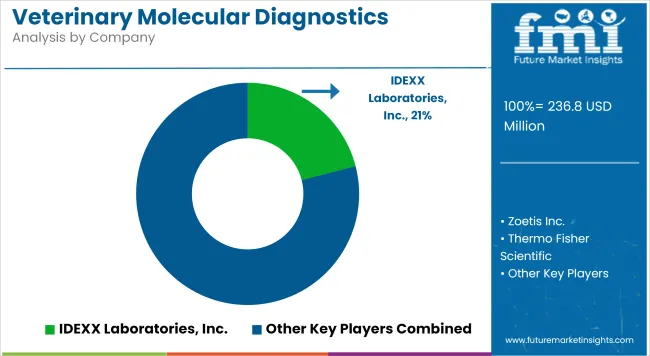
  • Top Key Players: IDEXX Laboratories, Inc., Zoetis Inc., Thermo Fisher Scientific, Bio-Rad Laboratories, Inc., QIAGEN N.V., bioMérieux

Veterinary Molecular Diagnostics Market Industry Value Analysis

Metric Value
Market Size in 2025 USD 236.8 Million
Projected Market Size in 2035 USD 448.7 Million
CAGR (2025 to 2035) 6.6%

The veterinary molecular diagnostics market is experiencing strong expansion, driven by heightened awareness of zoonotic diseases, the rise in companion animal ownership, and the need for early and accurate pathogen detection in livestock.

Advancements in PCR and next-generation sequencing technologies have improved diagnostic precision, allowing veterinarians to implement targeted treatment protocols and strengthen biosecurity measures. Regulatory authorities have increasingly supported the adoption of molecular testing frameworks to improve disease surveillance and outbreak control.

Veterinary healthcare providers are prioritizing diagnostic tools that enable rapid turnaround times and multiplex detection of pathogens, which has accelerated the integration of molecular assays into routine veterinary workflows. Continued investment in molecular assay development, strong veterinary infrastructure growth in emerging economies, and expansion of livestock disease management programs are expected to sustain market momentum and create new avenues for innovation and market penetration.
Analyzing Veterinary Molecular Diagnostics Market by Top Investment Segments

PCR Kits Leading the Product Type Segment

Veterinary Molecular Diagnostics Market Analysis By Product Type

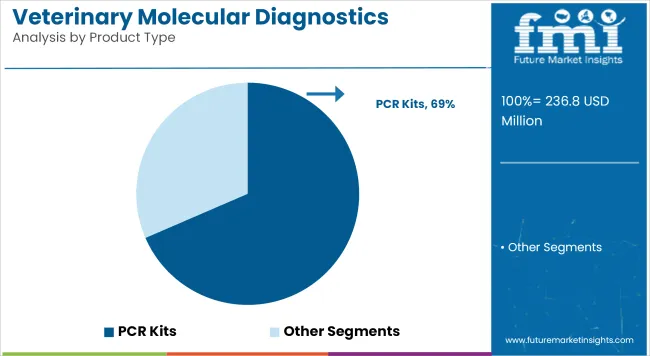
In 2025, PCR kits are anticipated to account for 68.5% of the revenue share in the veterinary molecular diagnostics market. This segment’s leadership has been attributed to their high sensitivity, specificity, and adaptability across a broad range of infectious diseases affecting companion and production animals.

The growth trajectory has been supported by regulatory endorsement of PCR-based testing as a standard of care in veterinary diagnostic laboratories. Veterinarians have demonstrated a clear preference for PCR assays due to their rapid turnaround times and capability for multiplex pathogen detection in a single workflow.

Additionally, the scalability and consistent performance of PCR kits have made them indispensable in both centralized laboratories and point-of-care settings. Continuous product innovation, including lyophilized reagents and user-friendly workflows, has reinforced PCR kits’ position as the primary diagnostic modality in the market.
Veterinary Hospitals as the Dominant End User

Veterinary Molecular Diagnostics Market Analysis By End User

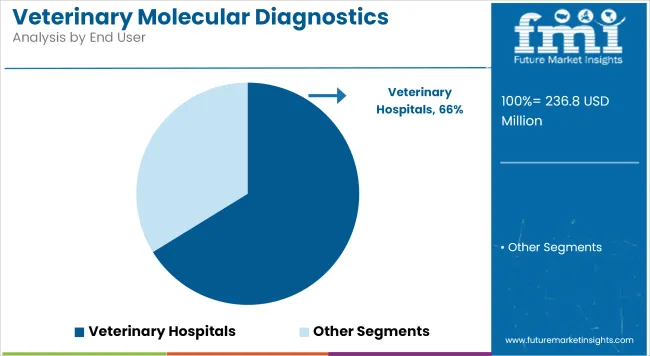
Veterinary hospitals are projected to contribute 66.2% of the end-user revenue share in 2025. This dominance has been driven by their comprehensive diagnostic capabilities, strong purchasing power, and established infrastructure for high-throughput molecular testing. Veterinary hospitals have increasingly integrated molecular assays into standard diagnostic protocols to improve clinical outcomes and reduce treatment delays.

Additionally, collaborations between veterinary hospitals and diagnostic companies have enabled access to customized testing panels and specialized training programs. This environment has strengthened the role of veterinary hospitals as primary centers for molecular diagnostic services, supporting sustained growth and continuous technology uptake.

Companion Animals Driving Growth in Veterinary Molecular Diagnostics

In 2025, companion animals are expected to account for 38.9% of the revenue share in the veterinary molecular diagnostics market. This segment's dominance has been attributed to the increasing pet ownership globally, along with the growing demand for advanced diagnostic tools for companion animals, particularly dogs and cats.

The rise in the prevalence of infectious diseases, genetic disorders, and chronic conditions in companion animals has led to an increased reliance on molecular diagnostics for accurate and timely diagnosis. Technologies such as PCR, sequencing, and other molecular methods allow for the detection of pathogens, genetic mutations, and infectious agents with high sensitivity, driving their adoption in veterinary practices.

Moreover, companion animal owners' increasing focus on their pets' health and well-being, paired with the growing trend of personalized care, has led to a surge in demand for molecular diagnostics. The rising number of veterinary clinics and hospitals offering specialized diagnostic services and the integration of molecular diagnostics into routine check-ups have further bolstered the market.

Challenges and Opportunities

Challenges

High cost of molecular testing, limited infrastructure especially in rural areas, and shortage of competent workforce

Despite the ever-increasing demand, veterinary molecular testing is very expensive and out of reach for many small clinics or farms with a limited number of livestock. Laboratory infrastructure is inadequate in many regions, but mainly in terms of cold-chain dependent PCR and NGS based platforms.

There is, therefore, continued technologic restrain of adoption due to the shortage of trained veterinary molecular biologists as well as diagnostic technicians. WHO has stated that capacity building through improved veterinary laboratories and a trained workforce is vital for zoonotic disease control and early outbreak response.

Opportunities

Zoonotic surveillance, portable diagnostics, and livestock genomics

Better opportunities were opened for veterinary molecular diagnostics with the global drive around One Health and the prevention of disease caused through zoonosis. These had resulted in funding of molecular surveillance for diseases such as rabies, avian influenza, or African swine fever by national governments and international health agencies.

In the areas of clinical and field point-of-care testing, portable PCR analyzers, isothermal amplification devices, and lab-on-chip platforms have seen further developments. Furthermore, under the auspices of breeding programs such as the International Institute for Animal Health, molecular diagnostics have also been used for assessing disease resistance and wellness testing for companion animals. WHO states that early molecular detection of animal diseases aids in the prevention of cross-species transmission and in safeguarding global health.
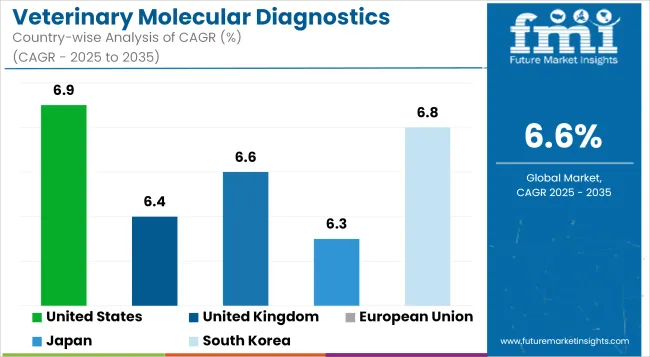
Country-Wise Outlook

Veterinary Molecular Diagnostics Market Cagr Analysis By Country

United States

As with most markets in the United States, the veterinary molecular diagnostics market is slowly developing. Increased pet ownership, heightened vigilance for livestock diseases, and rising demand for rapid, accurate diagnosis tools have been key factors drawing investments into the veterinary molecular diagnostics arena.

Mostly deployed to detect zoonotic diseases, parasitic infections, and genetic diseases in companion and farm animals, molecular techniques such as PCR, RT-PCR, and DNA sequencing have seen heavy use. The USA has made significant investments through the OECD in developing veterinary laboratory networks and biosecurity infrastructure and has made their operations smoother and faster in responding to any animal health threat. Their scope is further aided by expanding applications in precision animal health and herd management systems.

Country CAGR (2025 to 2035)
United States 6.9%

United Kingdom

UK veterinary molecular diagnostics are thus given impetus by the government welfare initiatives that become accessory in animal health surveillance and disease eradication in livestock. The Animal and Plant Health Agency and the private laboratories are putting in place molecular modalities for both antimicrobial resistance surveillance and infections at farms.

Expansion of equine and companion animal care is driving demand for diagnostic innovation, particularly PCR-based testing, according to OECD. Rapid diagnostics for respiratory, dermatological and vector-borne diseases are being developed from collaborative efforts between veterinary colleges and biotech startups.

Country CAGR (2025 to 2035)
United Kingdom 6.4%

European Union

The EU veterinary molecular diagnostics market shows favorable development, particularly with the health safety regulation directed to agriculture, disease control programs, and public funding. Countries such as Germany, France, and the Netherlands are main consumers of the technologies, namely, PCR, qPCR, or next-generation sequencing (NGS), with regards to livestock and poultry health monitoring.

According to UN, the EU Food Safety Authority promotes molecular diagnostics for real-time disease tracing as well as antibiotic stewardship. An increasing awareness of zoonosis and traceability in food production from animals also drives the market.

Country CAGR (2025 to 2035)
European Union 6.6%

Japan

Emerging pet ownership and priority given by the Japanese veterinary molecular diagnostics market attention for food safety and emerging animal diseases control have brought the much-needed boost to this market. Molecular surveillance systems are being developed under the Japanese Ministry of Agriculture, Forestry and Fisheries for avian influenza, swine fever, and infectious diseases in companion animals.

As per OECD, high-welfare standards in veterinary services and the increasing care given to pets enhanced the adoption of real-time PCR and genetic panels. Domestic companies are also innovating multiplex testing platforms for point-of-care veterinary clinics.

Country CAGR (2025 to 2035)
Japan 6.3%

South Korea

The veterinary molecular diagnostics market in South Korea is undergoing rapid development thanks to biosecurity programs funded by the government and the expanding veterinary diagnostic infrastructure. According to OECD, the authorities in Korea have increased genomic-based surveillance tools to cope with livestock disease emergencies, including zoonotic threats.

In such diagnosis, molecular assays for canine parvovirus, feline leukemia, and tick-borne diseases are now routine practice in veterinary clinics. Local diagnostic companies are developing portable PCR analyzers and kits perfectly adapted to both field and clinical diagnostics.

Country CAGR (2025 to 2035)
South Korea 6.8%

Competitive Outlook

Veterinary Molecular Diagnostics Market Analysis By Company

The veterinary molecular diagnostics market is specialized and rapidly evolving, driven by increasing demand for early, accurate detection of infectious diseases, genetic disorders, and zoonoses in companion and production animals. Leading companies are investing in PCR assays, real-time qPCR platforms, syndromic panels, and next-generation sequencing solutions to expand their test menus and improve diagnostic accuracy.

Strategic acquisitions, veterinary laboratory partnerships, and regulatory approvals are key factors towards broadening market reach and building customer loyalty among clinics and reference labs. Additionally, rising awareness of antimicrobial stewardship and biosecurity is fueling adoption globally. Emphasis on automation, faster turnaround times, and integration with practice management software is reshaping competitive differentiation.

  • In 2025, bioMérieux introduces VETFIRE™, a new PCR kit for equine respiratory diseases. This cutting-edge diagnostic uses advanced PCR to simultaneously detect seven pathogens in under 20 minutes, ensuring faster, highly accurate results for veterinarians.
  • In 2025, Alveo Technologies and Royal GD formalized a long-term partnership to enhance animal health diagnostics. Their collaboration, initiated with the avian influenza test, focuses on rapidly detecting emerging diseases and ensuring food safety.

Companies

  • IDEXX Laboratories, Inc.
  • Zoetis Inc.
  • Neogen Corporation
  • Thermo Fisher Scientific
  • bioMérieux
  • QIAGEN N.V.
  • Heska Corporation
  • Biomedica Medizinprodukte GmbH & Co KG
  • Novacyt Group
  • Randox Laboratories Ltd.
  • Bioneer
  • Pacific Biosciences
  • IDVet
  • Biochek B.V.
  • Ingenetix GmbH
  • GD Animal Health
  • Boehringer Ingelheim

Key Segmentation

By Product Type:

  • PCR Kits
  • RT-PCR Kits
  • RAPD-PCR Kits
  • INAAT Kits
  • Microarray Kits
  • DNA Sequencing Kits

By Species Type:

  • Livestock Animals
  • Equine
  • Porcine
  • Poultry
  • Cattle
  • Aquatic
  • Ovine
  • Companion Animals
  • Canine
  • Feline
  • Avian

By Disease Type:

  • Anaplasma spp.
  • Ehrlichia spp.
  • New Castle Disease
  • Influenza
  • Porcine Reproductive & Respiratory Syndrome (PRRS)
  • Others

By End User:

  • Veterinary Hospitals
  • Clinical Laboratories
  • Veterinary Research Institutes

By Region:

  • North America
  • Latin America
  • Europe
  • Asia Pacific
  • Middle East and Africa

Table of Content

  1. Executive Summary
  2. Industry Introduction, including Taxonomy and Market Definition
  3. Market Trends and Success Factors, including Macro-economic Factors, Market Dynamics, and Recent Industry Developments
  4. Market Demand Analysis 2020 to 2024 and Forecast 2025 to 2035, including Historical Analysis and Future Projections
  5. Pricing Analysis
  6. Market Analysis 2020 to 2024 and Forecast 2025 to 2035
    • Product Type
    • Species Type
    • Disease Type
    • End User
  7. Market Analysis 2020 to 2024 and Forecast 2025 to 2035, By Product Type
    • PCR Kits
    • RT-PCR Kits
    • RAPD-PCR Kits
    • INAAT Kits
    • Microarray Kits
    • DNA Sequencing Kits
  8. Market Analysis 2020 to 2024 and Forecast 2025 to 2035, By Species Type
    • Livestock Animals
      • Equine
      • Porcine
      • Poultry
      • Cattle
      • Aquatic
      • Ovine
    • Companion Animals
      • Canine
      • Feline
      • Avian
  9. Market Analysis 2020 to 2024 and Forecast 2025 to 2035, By Disease Type
    • Anaplasma spp.
    • Ehrlichia spp.
    • New Castle Disease
    • Influenza
    • Porcine Reproductive & Respiratory Syndrome (PRRS)
    • Others
  10. Market Analysis 2020 to 2024 and Forecast 2025 to 2035, By End User
    • Veterinary Hospitals
    • Clinical Laboratories
    • Veterinary Research Institutes
  11. Market Analysis 2020 to 2024 and Forecast 2025 to 2035, By Region
    • North America
    • Latin America
    • Western Europe
    • Eastern Europe
    • East Asia
    • South Asia Pacific
    • Middle East and Africa
  12. North America Sales Analysis 2020 to 2024 and Forecast 2025 to 2035, by Key Segments and Countries
  13. Latin America Sales Analysis 2020 to 2024 and Forecast 2025 to 2035, by Key Segments and Countries
  14. Western Europe Sales Analysis 2020 to 2024 and Forecast 2025 to 2035, by Key Segments and Countries
  15. Eastern Europe Sales Analysis 2020 to 2024 and Forecast 2025 to 2035, by Key Segments and Countries
  16. East Asia Sales Analysis 2020 to 2024 and Forecast 2025 to 2035, by Key Segments and Countries
  17. South Asia Pacific Sales Analysis 2020 to 2024 and Forecast 2025 to 2035, by Key Segments and Countries
  18. Middle East and Africa Sales Analysis 2020 to 2024 and Forecast 2025 to 2035, by Key Segments and Countries
  19. Sales Forecast 2025 to 2035 by Product Type, Species Type, Disease Type, and End User for 30 Countries
  20. Competition Outlook, including Market Structure Analysis, Company Share Analysis by Key Players, and Competition Dashboard
  21. Company Profile
    • bioMérieux SA
    • IDEXX Laboratories, Inc.
    • Neogen Europe, Ltd.
    • Veterinary Molecular Diagnostics, Inc.
    • Thermo Fisher Scientific, Inc.
    • Qiagen N.V.
    • Zoetis
    • Heska Corp.
    • Agrolabo S.p.A.
    • Covetrus

List of Tables

  • Table 1: Global Market Value (USD Million) Forecast by Region, 2020 to 2035
  • Table 2: Global Market Value (USD Million) Forecast by Product, 2020 to 2035
  • Table 3: Global Market Value (USD Million) Forecast by Disease, 2020 to 2035
  • Table 4: Global Market Value (USD Million) Forecast by Species, 2020 to 2035
  • Table 5: Global Market Value (USD Million) Forecast by End User, 2020 to 2035
  • Table 6: North America Market Value (USD Million) Forecast by Country, 2020 to 2035
  • Table 7: North America Market Value (USD Million) Forecast by Product, 2020 to 2035
  • Table 8: North America Market Value (USD Million) Forecast by Disease, 2020 to 2035
  • Table 9: North America Market Value (USD Million) Forecast by Species, 2020 to 2035
  • Table 10: North America Market Value (USD Million) Forecast by End User, 2020 to 2035
  • Table 11: Latin America Market Value (USD Million) Forecast by Country, 2020 to 2035
  • Table 12: Latin America Market Value (USD Million) Forecast by Product, 2020 to 2035
  • Table 13: Latin America Market Value (USD Million) Forecast by Disease, 2020 to 2035
  • Table 14: Latin America Market Value (USD Million) Forecast by Species, 2020 to 2035
  • Table 15: Latin America Market Value (USD Million) Forecast by End User, 2020 to 2035
  • Table 16: Europe Market Value (USD Million) Forecast by Country, 2020 to 2035
  • Table 17: Europe Market Value (USD Million) Forecast by Product, 2020 to 2035
  • Table 18: Europe Market Value (USD Million) Forecast by Disease, 2020 to 2035
  • Table 19: Europe Market Value (USD Million) Forecast by Species, 2020 to 2035
  • Table 20: Europe Market Value (USD Million) Forecast by End User, 2020 to 2035
  • Table 21: South Asia Market Value (USD Million) Forecast by Country, 2020 to 2035
  • Table 22: South Asia Market Value (USD Million) Forecast by Product, 2020 to 2035
  • Table 23: South Asia Market Value (USD Million) Forecast by Disease, 2020 to 2035
  • Table 24: South Asia Market Value (USD Million) Forecast by Species, 2020 to 2035
  • Table 25: South Asia Market Value (USD Million) Forecast by End User, 2020 to 2035
  • Table 26: East Asia Market Value (USD Million) Forecast by Country, 2020 to 2035
  • Table 27: East Asia Market Value (USD Million) Forecast by Product, 2020 to 2035
  • Table 28: East Asia Market Value (USD Million) Forecast by Disease, 2020 to 2035
  • Table 29: East Asia Market Value (USD Million) Forecast by Species, 2020 to 2035
  • Table 30: East Asia Market Value (USD Million) Forecast by End User, 2020 to 2035
  • Table 31: Oceania Market Value (USD Million) Forecast by Country, 2020 to 2035
  • Table 32: Oceania Market Value (USD Million) Forecast by Product, 2020 to 2035
  • Table 33: Oceania Market Value (USD Million) Forecast by Disease, 2020 to 2035
  • Table 34: Oceania Market Value (USD Million) Forecast by Species, 2020 to 2035
  • Table 35: Oceania Market Value (USD Million) Forecast by End User, 2020 to 2035
  • Table 36: MEA Market Value (USD Million) Forecast by Country, 2020 to 2035
  • Table 37: MEA Market Value (USD Million) Forecast by Product, 2020 to 2035
  • Table 38: MEA Market Value (USD Million) Forecast by Disease, 2020 to 2035
  • Table 39: MEA Market Value (USD Million) Forecast by Species, 2020 to 2035
  • Table 40: MEA Market Value (USD Million) Forecast by End User, 2020 to 2035

List of Figures

  • Figure 1: Global Market Value (USD Million) by Product, 2025 to 2035
  • Figure 2: Global Market Value (USD Million) by Disease, 2025 to 2035
  • Figure 3: Global Market Value (USD Million) by Species, 2025 to 2035
  • Figure 4: Global Market Value (USD Million) by End User, 2025 to 2035
  • Figure 5: Global Market Value (USD Million) by Region, 2025 to 2035
  • Figure 6: Global Market Value (USD Million) Analysis by Region, 2020 to 2035
  • Figure 7: Global Market Value Share (%) and BPS Analysis by Region, 2025 to 2035
  • Figure 8: Global Market Y-o-Y Growth (%) Projections by Region, 2025 to 2035
  • Figure 9: Global Market Value (USD Million) Analysis by Product, 2020 to 2035
  • Figure 10: Global Market Value Share (%) and BPS Analysis by Product, 2025 to 2035
  • Figure 11: Global Market Y-o-Y Growth (%) Projections by Product, 2025 to 2035
  • Figure 12: Global Market Value (USD Million) Analysis by Disease, 2020 to 2035
  • Figure 13: Global Market Value Share (%) and BPS Analysis by Disease, 2025 to 2035
  • Figure 14: Global Market Y-o-Y Growth (%) Projections by Disease, 2025 to 2035
  • Figure 15: Global Market Value (USD Million) Analysis by Species, 2020 to 2035
  • Figure 16: Global Market Value Share (%) and BPS Analysis by Species, 2025 to 2035
  • Figure 17: Global Market Y-o-Y Growth (%) Projections by Species, 2025 to 2035
  • Figure 18: Global Market Value (USD Million) Analysis by End User, 2020 to 2035
  • Figure 19: Global Market Value Share (%) and BPS Analysis by End User, 2025 to 2035
  • Figure 20: Global Market Y-o-Y Growth (%) Projections by End User, 2025 to 2035
  • Figure 21: Global Market Attractiveness by Product, 2025 to 2035
  • Figure 22: Global Market Attractiveness by Disease, 2025 to 2035
  • Figure 23: Global Market Attractiveness by Species, 2025 to 2035
  • Figure 24: Global Market Attractiveness by End User, 2025 to 2035
  • Figure 25: Global Market Attractiveness by Region, 2025 to 2035
  • Figure 26: North America Market Value (USD Million) by Product, 2025 to 2035
  • Figure 27: North America Market Value (USD Million) by Disease, 2025 to 2035
  • Figure 28: North America Market Value (USD Million) by Species, 2025 to 2035
  • Figure 29: North America Market Value (USD Million) by End User, 2025 to 2035
  • Figure 30: North America Market Value (USD Million) by Country, 2025 to 2035
  • Figure 31: North America Market Value (USD Million) Analysis by Country, 2020 to 2035
  • Figure 32: North America Market Value Share (%) and BPS Analysis by Country, 2025 to 2035
  • Figure 33: North America Market Y-o-Y Growth (%) Projections by Country, 2025 to 2035
  • Figure 34: North America Market Value (USD Million) Analysis by Product, 2020 to 2035
  • Figure 35: North America Market Value Share (%) and BPS Analysis by Product, 2025 to 2035
  • Figure 36: North America Market Y-o-Y Growth (%) Projections by Product, 2025 to 2035
  • Figure 37: North America Market Value (USD Million) Analysis by Disease, 2020 to 2035
  • Figure 38: North America Market Value Share (%) and BPS Analysis by Disease, 2025 to 2035
  • Figure 39: North America Market Y-o-Y Growth (%) Projections by Disease, 2025 to 2035
  • Figure 40: North America Market Value (USD Million) Analysis by Species, 2020 to 2035
  • Figure 41: North America Market Value Share (%) and BPS Analysis by Species, 2025 to 2035
  • Figure 42: North America Market Y-o-Y Growth (%) Projections by Species, 2025 to 2035
  • Figure 43: North America Market Value (USD Million) Analysis by End User, 2020 to 2035
  • Figure 44: North America Market Value Share (%) and BPS Analysis by End User, 2025 to 2035
  • Figure 45: North America Market Y-o-Y Growth (%) Projections by End User, 2025 to 2035
  • Figure 46: North America Market Attractiveness by Product, 2025 to 2035
  • Figure 47: North America Market Attractiveness by Disease, 2025 to 2035
  • Figure 48: North America Market Attractiveness by Species, 2025 to 2035
  • Figure 49: North America Market Attractiveness by End User, 2025 to 2035
  • Figure 50: North America Market Attractiveness by Country, 2025 to 2035
  • Figure 51: Latin America Market Value (USD Million) by Product, 2025 to 2035
  • Figure 52: Latin America Market Value (USD Million) by Disease, 2025 to 2035
  • Figure 53: Latin America Market Value (USD Million) by Species, 2025 to 2035
  • Figure 54: Latin America Market Value (USD Million) by End User, 2025 to 2035
  • Figure 55: Latin America Market Value (USD Million) by Country, 2025 to 2035
  • Figure 56: Latin America Market Value (USD Million) Analysis by Country, 2020 to 2035
  • Figure 57: Latin America Market Value Share (%) and BPS Analysis by Country, 2025 to 2035
  • Figure 58: Latin America Market Y-o-Y Growth (%) Projections by Country, 2025 to 2035
  • Figure 59: Latin America Market Value (USD Million) Analysis by Product, 2020 to 2035
  • Figure 60: Latin America Market Value Share (%) and BPS Analysis by Product, 2025 to 2035
  • Figure 61: Latin America Market Y-o-Y Growth (%) Projections by Product, 2025 to 2035
  • Figure 62: Latin America Market Value (USD Million) Analysis by Disease, 2020 to 2035
  • Figure 63: Latin America Market Value Share (%) and BPS Analysis by Disease, 2025 to 2035
  • Figure 64: Latin America Market Y-o-Y Growth (%) Projections by Disease, 2025 to 2035
  • Figure 65: Latin America Market Value (USD Million) Analysis by Species, 2020 to 2035
  • Figure 66: Latin America Market Value Share (%) and BPS Analysis by Species, 2025 to 2035
  • Figure 67: Latin America Market Y-o-Y Growth (%) Projections by Species, 2025 to 2035
  • Figure 68: Latin America Market Value (USD Million) Analysis by End User, 2020 to 2035
  • Figure 69: Latin America Market Value Share (%) and BPS Analysis by End User, 2025 to 2035
  • Figure 70: Latin America Market Y-o-Y Growth (%) Projections by End User, 2025 to 2035
  • Figure 71: Latin America Market Attractiveness by Product, 2025 to 2035
  • Figure 72: Latin America Market Attractiveness by Disease, 2025 to 2035
  • Figure 73: Latin America Market Attractiveness by Species, 2025 to 2035
  • Figure 74: Latin America Market Attractiveness by End User, 2025 to 2035
  • Figure 75: Latin America Market Attractiveness by Country, 2025 to 2035
  • Figure 76: Europe Market Value (USD Million) by Product, 2025 to 2035
  • Figure 77: Europe Market Value (USD Million) by Disease, 2025 to 2035
  • Figure 78: Europe Market Value (USD Million) by Species, 2025 to 2035
  • Figure 79: Europe Market Value (USD Million) by End User, 2025 to 2035
  • Figure 80: Europe Market Value (USD Million) by Country, 2025 to 2035
  • Figure 81: Europe Market Value (USD Million) Analysis by Country, 2020 to 2035
  • Figure 82: Europe Market Value Share (%) and BPS Analysis by Country, 2025 to 2035
  • Figure 83: Europe Market Y-o-Y Growth (%) Projections by Country, 2025 to 2035
  • Figure 84: Europe Market Value (USD Million) Analysis by Product, 2020 to 2035
  • Figure 85: Europe Market Value Share (%) and BPS Analysis by Product, 2025 to 2035
  • Figure 86: Europe Market Y-o-Y Growth (%) Projections by Product, 2025 to 2035
  • Figure 87: Europe Market Value (USD Million) Analysis by Disease, 2020 to 2035
  • Figure 88: Europe Market Value Share (%) and BPS Analysis by Disease, 2025 to 2035
  • Figure 89: Europe Market Y-o-Y Growth (%) Projections by Disease, 2025 to 2035
  • Figure 90: Europe Market Value (USD Million) Analysis by Species, 2020 to 2035
  • Figure 91: Europe Market Value Share (%) and BPS Analysis by Species, 2025 to 2035
  • Figure 92: Europe Market Y-o-Y Growth (%) Projections by Species, 2025 to 2035
  • Figure 93: Europe Market Value (USD Million) Analysis by End User, 2020 to 2035
  • Figure 94: Europe Market Value Share (%) and BPS Analysis by End User, 2025 to 2035
  • Figure 95: Europe Market Y-o-Y Growth (%) Projections by End User, 2025 to 2035
  • Figure 96: Europe Market Attractiveness by Product, 2025 to 2035
  • Figure 97: Europe Market Attractiveness by Disease, 2025 to 2035
  • Figure 98: Europe Market Attractiveness by Species, 2025 to 2035
  • Figure 99: Europe Market Attractiveness by End User, 2025 to 2035
  • Figure 100: Europe Market Attractiveness by Country, 2025 to 2035
  • Figure 101: South Asia Market Value (USD Million) by Product, 2025 to 2035
  • Figure 102: South Asia Market Value (USD Million) by Disease, 2025 to 2035
  • Figure 103: South Asia Market Value (USD Million) by Species, 2025 to 2035
  • Figure 104: South Asia Market Value (USD Million) by End User, 2025 to 2035
  • Figure 105: South Asia Market Value (USD Million) by Country, 2025 to 2035
  • Figure 106: South Asia Market Value (USD Million) Analysis by Country, 2020 to 2035
  • Figure 107: South Asia Market Value Share (%) and BPS Analysis by Country, 2025 to 2035
  • Figure 108: South Asia Market Y-o-Y Growth (%) Projections by Country, 2025 to 2035
  • Figure 109: South Asia Market Value (USD Million) Analysis by Product, 2020 to 2035
  • Figure 110: South Asia Market Value Share (%) and BPS Analysis by Product, 2025 to 2035
  • Figure 111: South Asia Market Y-o-Y Growth (%) Projections by Product, 2025 to 2035
  • Figure 112: South Asia Market Value (USD Million) Analysis by Disease, 2020 to 2035
  • Figure 113: South Asia Market Value Share (%) and BPS Analysis by Disease, 2025 to 2035
  • Figure 114: South Asia Market Y-o-Y Growth (%) Projections by Disease, 2025 to 2035
  • Figure 115: South Asia Market Value (USD Million) Analysis by Species, 2020 to 2035
  • Figure 116: South Asia Market Value Share (%) and BPS Analysis by Species, 2025 to 2035
  • Figure 117: South Asia Market Y-o-Y Growth (%) Projections by Species, 2025 to 2035
  • Figure 118: South Asia Market Value (USD Million) Analysis by End User, 2020 to 2035
  • Figure 119: South Asia Market Value Share (%) and BPS Analysis by End User, 2025 to 2035
  • Figure 120: South Asia Market Y-o-Y Growth (%) Projections by End User, 2025 to 2035
  • Figure 121: South Asia Market Attractiveness by Product, 2025 to 2035
  • Figure 122: South Asia Market Attractiveness by Disease, 2025 to 2035
  • Figure 123: South Asia Market Attractiveness by Species, 2025 to 2035
  • Figure 124: South Asia Market Attractiveness by End User, 2025 to 2035
  • Figure 125: South Asia Market Attractiveness by Country, 2025 to 2035
  • Figure 126: East Asia Market Value (USD Million) by Product, 2025 to 2035
  • Figure 127: East Asia Market Value (USD Million) by Disease, 2025 to 2035
  • Figure 128: East Asia Market Value (USD Million) by Species, 2025 to 2035
  • Figure 129: East Asia Market Value (USD Million) by End User, 2025 to 2035
  • Figure 130: East Asia Market Value (USD Million) by Country, 2025 to 2035
  • Figure 131: East Asia Market Value (USD Million) Analysis by Country, 2020 to 2035
  • Figure 132: East Asia Market Value Share (%) and BPS Analysis by Country, 2025 to 2035
  • Figure 133: East Asia Market Y-o-Y Growth (%) Projections by Country, 2025 to 2035
  • Figure 134: East Asia Market Value (USD Million) Analysis by Product, 2020 to 2035
  • Figure 135: East Asia Market Value Share (%) and BPS Analysis by Product, 2025 to 2035
  • Figure 136: East Asia Market Y-o-Y Growth (%) Projections by Product, 2025 to 2035
  • Figure 137: East Asia Market Value (USD Million) Analysis by Disease, 2020 to 2035
  • Figure 138: East Asia Market Value Share (%) and BPS Analysis by Disease, 2025 to 2035
  • Figure 139: East Asia Market Y-o-Y Growth (%) Projections by Disease, 2025 to 2035
  • Figure 140: East Asia Market Value (USD Million) Analysis by Species, 2020 to 2035
  • Figure 141: East Asia Market Value Share (%) and BPS Analysis by Species, 2025 to 2035
  • Figure 142: East Asia Market Y-o-Y Growth (%) Projections by Species, 2025 to 2035
  • Figure 143: East Asia Market Value (USD Million) Analysis by End User, 2020 to 2035
  • Figure 144: East Asia Market Value Share (%) and BPS Analysis by End User, 2025 to 2035
  • Figure 145: East Asia Market Y-o-Y Growth (%) Projections by End User, 2025 to 2035
  • Figure 146: East Asia Market Attractiveness by Product, 2025 to 2035
  • Figure 147: East Asia Market Attractiveness by Disease, 2025 to 2035
  • Figure 148: East Asia Market Attractiveness by Species, 2025 to 2035
  • Figure 149: East Asia Market Attractiveness by End User, 2025 to 2035
  • Figure 150: East Asia Market Attractiveness by Country, 2025 to 2035
  • Figure 151: Oceania Market Value (USD Million) by Product, 2025 to 2035
  • Figure 152: Oceania Market Value (USD Million) by Disease, 2025 to 2035
  • Figure 153: Oceania Market Value (USD Million) by Species, 2025 to 2035
  • Figure 154: Oceania Market Value (USD Million) by End User, 2025 to 2035
  • Figure 155: Oceania Market Value (USD Million) by Country, 2025 to 2035
  • Figure 156: Oceania Market Value (USD Million) Analysis by Country, 2020 to 2035
  • Figure 157: Oceania Market Value Share (%) and BPS Analysis by Country, 2025 to 2035
  • Figure 158: Oceania Market Y-o-Y Growth (%) Projections by Country, 2025 to 2035
  • Figure 159: Oceania Market Value (USD Million) Analysis by Product, 2020 to 2035
  • Figure 160: Oceania Market Value Share (%) and BPS Analysis by Product, 2025 to 2035
  • Figure 161: Oceania Market Y-o-Y Growth (%) Projections by Product, 2025 to 2035
  • Figure 162: Oceania Market Value (USD Million) Analysis by Disease, 2020 to 2035
  • Figure 163: Oceania Market Value Share (%) and BPS Analysis by Disease, 2025 to 2035
  • Figure 164: Oceania Market Y-o-Y Growth (%) Projections by Disease, 2025 to 2035
  • Figure 165: Oceania Market Value (USD Million) Analysis by Species, 2020 to 2035
  • Figure 166: Oceania Market Value Share (%) and BPS Analysis by Species, 2025 to 2035
  • Figure 167: Oceania Market Y-o-Y Growth (%) Projections by Species, 2025 to 2035
  • Figure 168: Oceania Market Value (USD Million) Analysis by End User, 2020 to 2035
  • Figure 169: Oceania Market Value Share (%) and BPS Analysis by End User, 2025 to 2035
  • Figure 170: Oceania Market Y-o-Y Growth (%) Projections by End User, 2025 to 2035
  • Figure 171: Oceania Market Attractiveness by Product, 2025 to 2035
  • Figure 172: Oceania Market Attractiveness by Disease, 2025 to 2035
  • Figure 173: Oceania Market Attractiveness by Species, 2025 to 2035
  • Figure 174: Oceania Market Attractiveness by End User, 2025 to 2035
  • Figure 175: Oceania Market Attractiveness by Country, 2025 to 2035
  • Figure 176: MEA Market Value (USD Million) by Product, 2025 to 2035
  • Figure 177: MEA Market Value (USD Million) by Disease, 2025 to 2035
  • Figure 178: MEA Market Value (USD Million) by Species, 2025 to 2035
  • Figure 179: MEA Market Value (USD Million) by End User, 2025 to 2035
  • Figure 180: MEA Market Value (USD Million) by Country, 2025 to 2035
  • Figure 181: MEA Market Value (USD Million) Analysis by Country, 2020 to 2035
  • Figure 182: MEA Market Value Share (%) and BPS Analysis by Country, 2025 to 2035
  • Figure 183: MEA Market Y-o-Y Growth (%) Projections by Country, 2025 to 2035
  • Figure 184: MEA Market Value (USD Million) Analysis by Product, 2020 to 2035
  • Figure 185: MEA Market Value Share (%) and BPS Analysis by Product, 2025 to 2035
  • Figure 186: MEA Market Y-o-Y Growth (%) Projections by Product, 2025 to 2035
  • Figure 187: MEA Market Value (USD Million) Analysis by Disease, 2020 to 2035
  • Figure 188: MEA Market Value Share (%) and BPS Analysis by Disease, 2025 to 2035
  • Figure 189: MEA Market Y-o-Y Growth (%) Projections by Disease, 2025 to 2035
  • Figure 190: MEA Market Value (USD Million) Analysis by Species, 2020 to 2035
  • Figure 191: MEA Market Value Share (%) and BPS Analysis by Species, 2025 to 2035
  • Figure 192: MEA Market Y-o-Y Growth (%) Projections by Species, 2025 to 2035
  • Figure 193: MEA Market Value (USD Million) Analysis by End User, 2020 to 2035
  • Figure 194: MEA Market Value Share (%) and BPS Analysis by End User, 2025 to 2035
  • Figure 195: MEA Market Y-o-Y Growth (%) Projections by End User, 2025 to 2035
  • Figure 196: MEA Market Attractiveness by Product, 2025 to 2035
  • Figure 197: MEA Market Attractiveness by Disease, 2025 to 2035
  • Figure 198: MEA Market Attractiveness by Species, 2025 to 2035
  • Figure 199: MEA Market Attractiveness by End User, 2025 to 2035
  • Figure 200: MEA Market Attractiveness by Country, 2025 to 2035

Frequently Asked Questions

What was the overall size of the veterinary molecular diagnostics market in 2025?

The overall market size for the veterinary molecular diagnostics market was approximately USD 236.8 million in 2025.

How big is the veterinary molecular diagnostics market expected to be in 2035?

The veterinary molecular diagnostics market is expected to reach approximately USD 448.7 Million by 2035.

What will drive the demand for the veterinary molecular diagnostics market during the forecast period?

The demand for veterinary molecular diagnostics is rising due to the increasing prevalence of zoonotic diseases, growing awareness among pet owners about animal health, and advancements in molecular diagnostic techniques. The rising demand for animal-derived food products and the need for early disease diagnosis in livestock have also contributed to the growth of this market.

List the top 5 countries contributing to the veterinary molecular diagnostics market.

The top 5 countries driving the development of the veterinary molecular diagnostics market are the United States, Germany, France, Japan, and China.

Which segment in the product type and end-user is expected to lead in the veterinary molecular diagnostics market?

PCR kits and veterinary hospitals are expected to command significant shares over the assessment period.

Explore Similar Insights

Future Market Insights

Veterinary Molecular Diagnostics Market