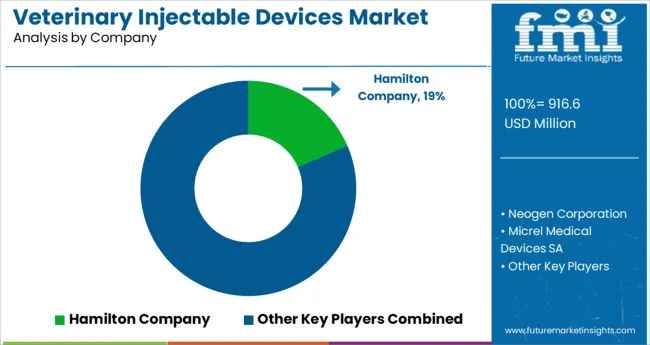
The Veterinary Injectable Devices Market is estimated to be valued at USD 916.6 million in 2025 and is projected to reach USD 1150.7 million by 2035, registering a compound annual growth rate (CAGR) of 2.3% over the forecast period.
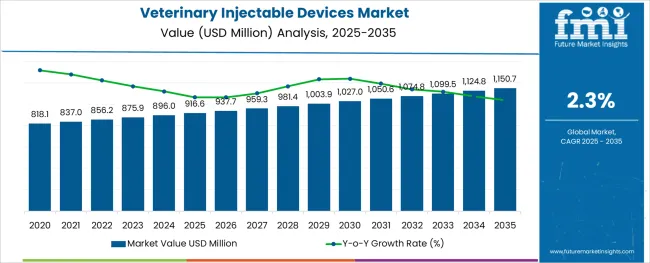
The veterinary injectable devices market is witnessing sustained growth as animal health care systems expand across both companion and livestock segments. Increased global emphasis on veterinary vaccinations, preventive treatments, and disease management protocols is driving demand for reliable, easy-to-use injection tools. Technological advancements in safety-engineered devices, ergonomic designs, and dosage precision are improving user compliance and treatment outcomes.
Rising pet ownership, growing expenditure on animal health, and widespread livestock immunization campaigns are fueling market expansion. Simultaneously, regulatory guidelines emphasizing sterile delivery, reusable device validation, and reduction in cross-contamination risk are pushing manufacturers toward design innovation.
Material optimization and automation-compatible formats are further increasing adoption across high-volume veterinary practices. As demand from veterinary hospitals, clinics, and mobile veterinary services continues to grow, injectable device providers are expected to focus on scalable solutions, intuitive usability, and broad compatibility with a wide range of drug formulations.
The market is segmented by Product Type, Material Type, and End User and region. By Product Type, the market is divided into Syringes, Needles, Needle-Free Injection System, and Others. In terms of Material Type, the market is classified into Plastic, Glass, Metals, and Others.
Based on End User, the market is segmented into Veterinary Hospitals, Veterinary Clinics, Animal Research Institutes, and Others. Regionally, the market is classified into North America, Latin America, Western Europe, Eastern Europe, Balkan & Baltic Countries, Russia & Belarus, Central Asia, East Asia, South Asia & Pacific, and the Middle East & Africa.
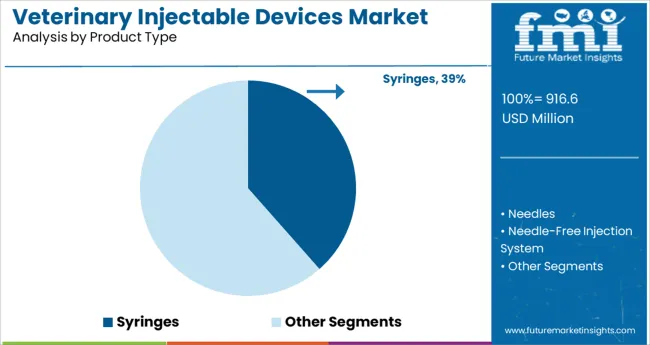
Syringes are projected to account for 38.5% of the total product type revenue share in 2025, marking them as the leading segment in the veterinary injectable devices market. Their dominance is attributed to their broad applicability across therapeutic, vaccination, and diagnostic procedures in both small and large animals.
The availability of fixed-dose, variable-dose, and prefilled syringe configurations has allowed veterinarians to cater to a range of clinical needs with efficiency and precision. Manufacturers have focused on improving safety features such as needle guards and auto-disable options, which has enhanced user safety and compliance with best practices.
Syringes also provide high usability across multiple veterinary drug classes and facilitate accurate dosing, making them indispensable in day-to-day clinical workflows. Their widespread availability, low cost, and compatibility with emerging drug delivery standards continue to position them as the preferred injectable device across veterinary settings.
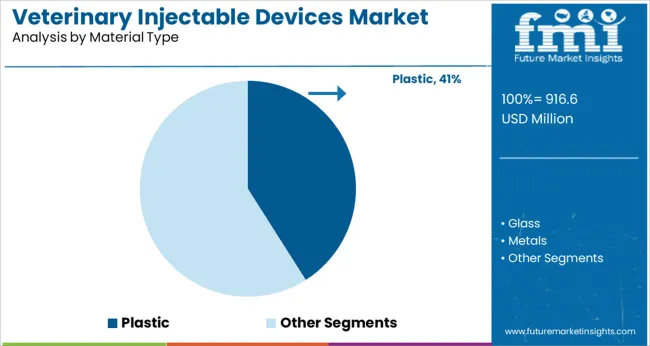
Plastic-based devices are expected to hold 41.0% of the market share by material type in 2025, establishing them as the most widely used category. Their popularity is driven by the balance they offer between cost, performance, and safety.
Plastic materials provide the necessary flexibility for designing lightweight, ergonomic, and disposable products that meet both clinician needs and patient safety standards. The ability to manufacture at scale while incorporating features such as tamper resistance, transparent barrels for visibility, and molded dose markings has enhanced plastic’s utility in veterinary injection applications.
Additionally, innovations in medical-grade plastic compounds have improved biocompatibility and durability, allowing for expanded use in both single-use and limited-reuse formats. Veterinary hospitals and field services prefer plastic devices for their sterility assurance and logistical convenience, reinforcing their share within the market.
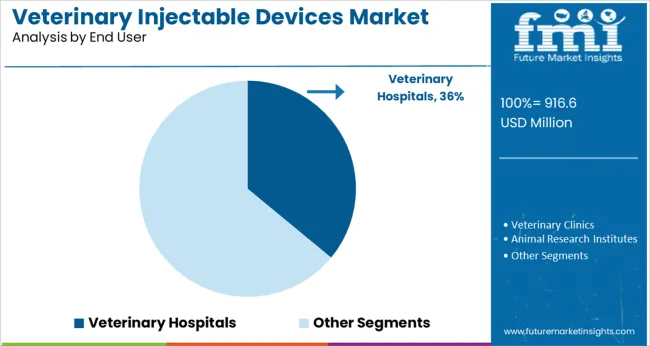
Veterinary hospitals are anticipated to represent 36.0% of the total revenue share by end user in 2025, making them the leading channel in the veterinary injectable devices market. This prominence is linked to the comprehensive range of medical procedures conducted in hospital settings, where injectable therapies play a key role in treatment protocols.
Veterinary hospitals typically handle higher caseloads and complex cases, necessitating a consistent supply of reliable injection devices that support diverse clinical applications including anesthesia, vaccination, fluid administration, and chronic disease treatment. These institutions are often early adopters of enhanced safety technologies and comply with stricter infection control and procedural documentation standards.
Their access to purchasing networks and centralized procurement practices also enables bulk procurement of high-performance injectable devices. As veterinary care becomes more specialized and technology-driven, hospitals are expected to maintain a dominant position, driving continuous adoption of precision injection solutions.
As animals play an important role in the human environment, so it is important to keep the animals healthy and prevent the spread of diseases to humans. For such purposes, generally, drugs are administered to animals using injections.
The easy administration of drugs through injections as compared to the oral route has set the veterinary injectable devices market trends positively in the present-day animal healthcare sector.
Several veterinary doctors also prefer injectable devices as this route of administration shows rapid action. Further advancement in animal medication innovations for rare diseases is poised to create huge opportunities for the veterinary injectable devices market in the future.
The veterinary injectable devices market is expected to show significant growth over the forecast period owing to the increasing prevalence of various diseases among animals. Growing healthcare expenditure on animals by farmers is also a major factor that is influencing the growth of veterinary injectable devices market opportunities.
Syringes and needles are the highest revenue-generating segments of veterinary injectable devices and are expected to be continuing to dominate the veterinary injectable devices market over the forecast period. The market of needle-free veterinary injectable systems is popularizing and is expected to show significant growth over the forecast period.
Plastic is the material of choice for veterinary injectable devices as it is used for the manufacturing of disposable injectable devices. The Plastic segment is expected to keep dominating the veterinary injectable devices market due to low prices and increased use of disposable injections.
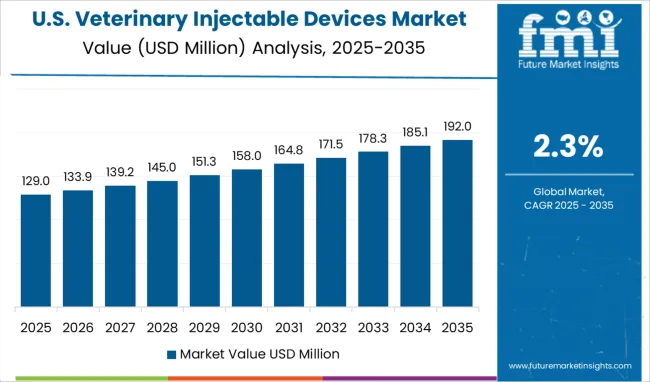
As per the veterinary injectable devices market analysis report by FMI, North America holds a market share of 31% of the overall sales in 2025.
North America is the most attractive and highest revenue-generating veterinary injectable devices market due to the presence of better veterinary healthcare facilities. Increased expenditure on companion animals in the USA and have also contributed to gaining the momentum for veterinary injectable devices market future trends in the region.
North America is one of the biggest meat-consuming markets and there are strict laws regarding that meat should be from healthy animals further augmenting the veterinary injectable devices market share in the region.
According to the new research report on veterinary injectable device market adoption trends, Asia Pacific is likely to generate a revenue share of 25% of the overall market in 2025.
The Asia Pacific is expected to be the fastest-growing veterinary injectable devices market during the forecast period due to increasing animal healthcare infrastructure and presence of large no of farm animals, and the emergence of big poultry businesses.
Poultry and farm animals are always at a higher risk of getting the disease as compared to companion animals. The death of farm animals and poultry will lead to financial losses. So, vaccination is done among farm animals through government support to prevent them from disease and is expected to lead to increased sales of veterinary injectable devices in the regional market
A lot of opportunities have surfaced in the regional veterinary injectable devices market around the world, owing to which several start-ups have come up in the last couple of years. These new veterinary injectable device market players are majorly targeting online consumers for the use of such devices in home care settings.
Some of the recent entrants in the veterinary injectable devices market are Hanke Sass Wolf, Zovix Pharmaceuticals, MSD Animal Health, and Zoeis Animal Health.
A major focus of these companies is on the development of disposable and needle-free syringes. Along with product innovation veterinary injectable devices market players are also focussing on spreading awareness about the benefits of animal medication as their major strategy.
ICU Medical Inc. acquired Smiths Medical of USA in January 2025. Smiths Medical produced and supplied syringes and ambulatory infusion devices and other animal care products for the market of the USA and adjacent countries.
| Attributes | Details |
|---|---|
| Growth Rate | CAGR of 2.3% from 2025 to 2035. |
| The base year for Estimation | 2025 |
| Historical Data Available for | 2020 to 2024 |
| Forecast Period | 2025 to 2035 |
| Quantitative Units | Revenue in USD Million and CAGR from 2025 to 2035 |
| Report Coverage | Revenue Forecast, Volume Forecast, Company Ranking, Competitive Landscape, Growth Factors, Trends, and Pricing Analysis |
| Segments Covered | Product Type, Material Type, End User, Others |
| Regions Covered | North America, Latin America, Asia Pacific, Japan, Western Europe, Eastern Europe, Middle East &, Africa |
| Key Countries Profiled | United States of America, Canada, Brazil, Argentina, Germany, United Kingdom, France, Spain, Italy, Nordics, BENELUX, Australia &, New Zealand, China, India, GCC Countries, South Africa |
| Key Companies Profiled | Hamilton Company, Neogen Corporation, Micrel Medical Devices SA, Serumwerk Bernburg AG, PBS Animal Health, Medtronic Public Limited Company, Allflex USA, Inc. |
| Customization | Available upon Request |
The global veterinary injectable devices market is estimated to be valued at USD 916.6 million in 2025.
It is projected to reach USD 1150.7 million by 2035.
The market is expected to grow at a 2.3% CAGR between 2025 and 2035.
The key product types are syringes, needles, needle-free injection system and others.
plastic segment is expected to dominate with a 41.0% industry share in 2025.


Our Research Products

The "Full Research Suite" delivers actionable market intel, deep dives on markets or technologies, so clients act faster, cut risk, and unlock growth.

The Leaderboard benchmarks and ranks top vendors, classifying them as Established Leaders, Leading Challengers, or Disruptors & Challengers.

Locates where complements amplify value and substitutes erode it, forecasting net impact by horizon

We deliver granular, decision-grade intel: market sizing, 5-year forecasts, pricing, adoption, usage, revenue, and operational KPIs—plus competitor tracking, regulation, and value chains—across 60 countries broadly.

Spot the shifts before they hit your P&L. We track inflection points, adoption curves, pricing moves, and ecosystem plays to show where demand is heading, why it is changing, and what to do next across high-growth markets and disruptive tech

Real-time reads of user behavior. We track shifting priorities, perceptions of today’s and next-gen services, and provider experience, then pace how fast tech moves from trial to adoption, blending buyer, consumer, and channel inputs with social signals (#WhySwitch, #UX).

Partner with our analyst team to build a custom report designed around your business priorities. From analysing market trends to assessing competitors or crafting bespoke datasets, we tailor insights to your needs.
Supplier Intelligence
Discovery & Profiling
Capacity & Footprint
Performance & Risk
Compliance & Governance
Commercial Readiness
Who Supplies Whom
Scorecards & Shortlists
Playbooks & Docs
Category Intelligence
Definition & Scope
Demand & Use Cases
Cost Drivers
Market Structure
Supply Chain Map
Trade & Policy
Operating Norms
Deliverables
Buyer Intelligence
Account Basics
Spend & Scope
Procurement Model
Vendor Requirements
Terms & Policies
Entry Strategy
Pain Points & Triggers
Outputs
Pricing Analysis
Benchmarks
Trends
Should-Cost
Indexation
Landed Cost
Commercial Terms
Deliverables
Brand Analysis
Positioning & Value Prop
Share & Presence
Customer Evidence
Go-to-Market
Digital & Reputation
Compliance & Trust
KPIs & Gaps
Outputs
Full Research Suite comprises of:
Market outlook & trends analysis
Interviews & case studies
Strategic recommendations
Vendor profiles & capabilities analysis
5-year forecasts
8 regions and 60+ country-level data splits
Market segment data splits
12 months of continuous data updates
DELIVERED AS:
PDF EXCEL ONLINE
Veterinary Point of Care Diagnostics Market Size and Share Forecast Outlook 2025 to 2035
Veterinary Allergy Diagnostics Market Size and Share Forecast Outlook 2025 to 2035
Veterinary TSE Testing Market Size and Share Forecast Outlook 2025 to 2035
Veterinary Dermatology Market Forecast Outlook 2025 to 2035
Veterinary Telemedicine Market Size and Share Forecast Outlook 2025 to 2035
Veterinary Dietary Supplements Market Size and Share Forecast Outlook 2025 to 2035
Veterinary Imaging Market Forecast and Outlook 2025 to 2035
Veterinary CRISPR-Based Detection Kits Market Size and Share Forecast Outlook 2025 to 2035
Veterinary Pregnancy Test Kit Market Forecast and Outlook 2025 to 2035
Veterinary X-Ray Illuminators Market Size and Share Forecast Outlook 2025 to 2035
Veterinary Scales Market Size and Share Forecast Outlook 2025 to 2035
Veterinary Grooming Aids Market Size and Share Forecast Outlook 2025 to 2035
Veterinary Micro-fibre Endoscope Market Size and Share Forecast Outlook 2025 to 2035
Veterinary Faecal Filters Market Size and Share Forecast Outlook 2025 to 2035
Veterinary Dental Equipment Market Size and Share Forecast Outlook 2025 to 2035
Veterinary Rapid Test Market Size and Share Forecast Outlook 2025 to 2035
Veterinary Therapeutic Diet Market Size and Share Forecast Outlook 2025 to 2035
Veterinary Glucometers Market Size and Share Forecast Outlook 2025 to 2035
Veterinary Pain Management Drugs Market Size and Share Forecast Outlook 2025 to 2035
Veterinary Anesthesia Machines Market Size and Share Forecast Outlook 2025 to 2035

Thank you!
You will receive an email from our Business Development Manager. Please be sure to check your SPAM/JUNK folder too.
Chat With
MaRIA