Veterinary Glucometers Market Outlook (2023 to 2033)

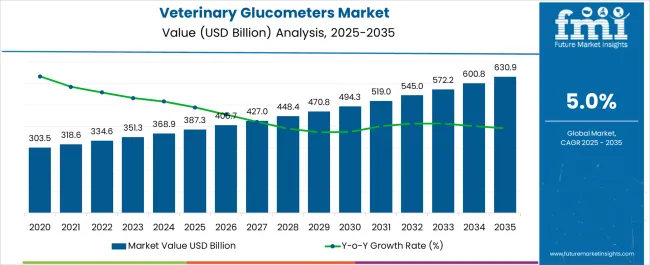
The veterinary glucometers market size is projected to be valued at USD 351.3 million in 2023 and is expected to rise to USD 574.9 million by 2033. The sales of veterinary glucometers are predicted to expand at a significant CAGR of 5.0% during the forecast period.

The veterinary glucometers market refers to the industry involved in the manufacturing, distribution, and sales of devices used to measure blood glucose levels in animals. These glucometers are specifically designed for veterinary use and play a crucial role in monitoring and managing diabetes in pets and other animals.

Glucometers for veterinary purposes are similar to those used in human healthcare, but they are adapted to accommodate the specific needs and characteristics of animals. These devices are capable of accurately measuring blood glucose levels in various species, including dogs, cats, horses, and livestock.

The demand for veterinary glucometers has been increasing due to the growing prevalence of diabetes and other metabolic disorders in animals. Pet owners, veterinarians, and animal healthcare professionals rely on these devices to monitor blood sugar levels in diabetic animals, make informed treatment decisions, and ensure the overall well-being of their patients.

In recent years, there have been advancements in veterinary glucometer technology, leading to the development of user-friendly and efficient devices. Further, these new models often come with features such as easy-to-read displays, wireless connectivity for data transfer, and enhanced accuracy in glucose measurements.

The veterinary glucometers market is influenced by factors such as the rise in pet ownership, increasing awareness about animal health, and the growing demand for advanced veterinary care. Furthermore, veterinary clinics, animal hospitals, and research institutions are key end-users of these devices, contributing to the market's growth.

Attributes Details
Market CAGR 5.0%
Market Valuation (2023) USD 351.3 million
Market Valuation (2033) USD 574.9 million

Veterinary Glucometers Market is Boosted by Rising Pet Obesity Rates

Obesity is the main risk factor for developing diabetes. The main element influencing the adoption of veterinary glucometers is thought to be the rise in the number of obese dogs. Around 35% of pets, according to statistics from the American Veterinary Medical Association, are obese or overweight.

Diabetes and liver disease are two conditions that can develop in overweight animals. If untreated, these disorders could be lethal. Therefore, during the projection period, key players are likely to witness a considerable increase in sales of veterinary glucometers due to the rising incidence of obese pet populations that are at great risk of getting diabetes.

Increased awareness of animal health presents a profitable opportunity for manufacturers in the market. In addition, factors like an increase in the prevalence of diabetes in animals and a rise in the demand for livestock products also contribute to market growth. However, the market growth is constrained by the absence of veterinary infrastructure facilities in poor countries.

2018 to 2022 Veterinary Glucometers Market Outlook in Comparison to 2023 to 2033 Growth Forecast

Market to Witness an absolute dollar Growth of USD 238.7 million between Comparison Periods

During the period from 2018 to 2022, the veterinary glucometers market experienced significant growth, driven by factors such as the increasing prevalence of diabetes in animals, rising pet ownership, and growing awareness about animal health. Further, the market witnessed a steady increase in demand for veterinary glucometers as pet owners and veterinarians recognized the importance of monitoring blood glucose levels in animals.

Looking ahead, the growth forecast for the market from 2023 to 2033 remains positive. The market is expected to continue its upward trajectory, propelled by factors such as the expanding pet population, advancements in veterinary care, and the increasing adoption of glucose monitoring devices in animal healthcare settings.

The forecast indicates that the market is likely to witness substantial growth during the forecast period. This growth can be attributed to the rising incidence of diabetes and other metabolic disorders in animals, which necessitates effective monitoring and management of blood glucose levels. Additionally, the growing awareness among pet owners about the importance of regular glucose monitoring is expected to contribute to the market's expansion.

Country-wise Analysis

What is North America Growth Outlook for the Veterinary Glucometers Market?

North America is expected to lead the market with better healthcare facilities and growing advancing technology in the region. North America’s market holds a significant share in the veterinary glucometers market with 44.5% of the global market share. Further, the rising demand is mainly rising in the North American region due to the changing lifestyle of pets and animals, especially the native lifestyle being the big problem.

How is Europe Performing in the Veterinary Glucometers Market?

The European veterinary glucometers market expands at a steady CAGR for veterinary glucometers with a global market share of 32.7%. The second large market is held by the Europe market followed by Asia Pacific due to increasing awareness of veterinary diseases.

The market in this region is anticipated to be one of the significantly growing markets due growing animal population and rising diseases among animals due to inactive lifestyles and poor management. Covid-19 has also fueled the sales, as they are convenient for homes, especially when other animal clinics were closed.

China has been Experiencing a Significant Growth of 7.3% in the Veterinary Glucometers Market.

The country's expanding pet population, increasing awareness about animal health, and the growing prevalence of diabetes in animals have contributed to the rising demand for veterinary glucometers.

Furthermore, advancements in veterinary care and the availability of technologically advanced glucometers have also played a role in driving the market growth in China. These innovative devices offer features such as accurate glucose measurement, user-friendly interfaces, and convenient data management, catering specifically to the needs of veterinary professionals and pet owners.

Category-wise Insights Veterinary Glucometers Market

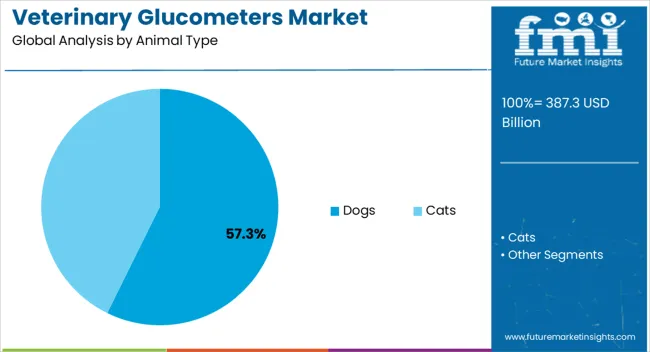
Dogs Hold a Significant Share of 61.10% in the Veterinary Glucometers Market.

Dogs require regular monitoring of their blood glucose levels, especially those with diabetes or at risk of developing the condition as it is one of the most common pets and a popular choice among households.

Given the significant role that dogs play in the veterinary glucometers market, manufacturers and suppliers continually strive to develop innovative products tailored to meet the specific needs of canine diabetes management. The aim is to provide reliable and user-friendly glucometers that enhance the monitoring and care of dogs with diabetes, ultimately improving their health outcomes and overall well-being.

Growing Focus on Veterinary Glucometers is Leading the Segment Growth

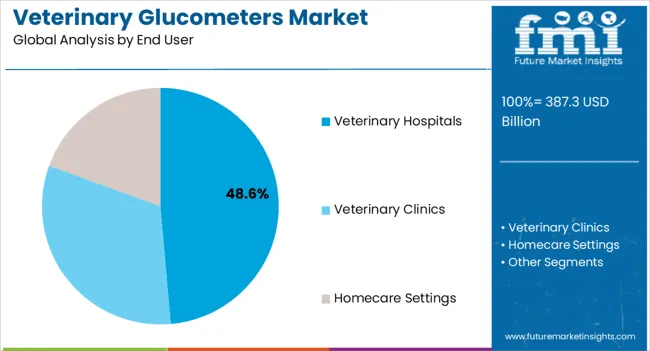
Veterinary hospitals hold a prominent share of 41.60% in the veterinary glucometers market. These establishments play a crucial role in providing healthcare services to animals, including diagnosis, treatment, and monitoring of various medical conditions.

Veterinary hospitals prioritize the well-being and health of animals, and glucometers play a vital role in facilitating effective diabetes management. By accurately measuring blood glucose levels, veterinary hospitals can provide optimal care and support to animals with diabetes, ensuring their overall health and improving their quality of life.
How Key Players are Contributing to the Veterinary Glucometers Market?

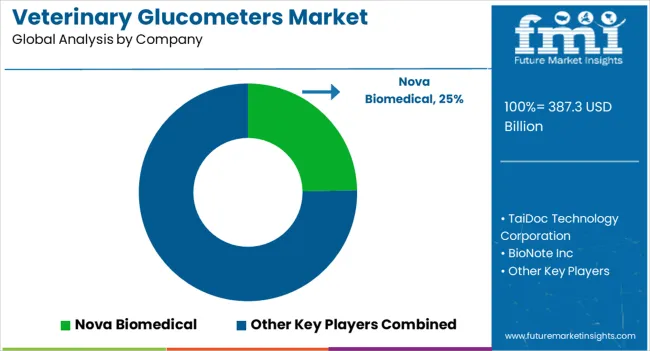
Key participants have added cutting-edge technology along with the latest animal healthcare technology like fast results. COVID-19 has also pushed brands to adopt the technology to make monitoring convenient. As the market rises and thrives on its growth prospects, the competition among the key players keeps on increasing, making the market dynamic.

Recent Mergers and Product Launches

  • Pro zinc (protamine zinc recombinant human insulin) was introduced by Boehringer Ingelheim International GmbH in August 2020 as a daily single-dose medication for dogs with diabetes.
  • In August 2019, Zoetis said that partner firms Merck Animal Health and Purina continue to support its Diabetes Pet Care Alliance initiative.
  • Nova Biomedical introduced Ketone/Glucose Meter known as Nova Vet under its Nova biomedical section that measures blood beta-hydroxybutyrate (BHB) that gives the results in just 10 seconds. These fuels the sales of veterinary glucometers.
  • TaiDoc Technology Corporation has added new modern vet glucose monitoring machines that have a reaction time of 5 seconds with a memory of 400 sets. These fuels the sales of veterinary glucometers.

Scope of Report

Attributes Details
Forecast Period 2023 to 2033
Historical Data Available for 2018 to 2022
Market Analysis USD million for Value
Key Countries Covered The United States, Canada, Germany, The United Kingdom, France, Italy, Spain, Russia, China, Japan, South Korea, India, Thailand, Malaysia, Indonesia, Australia, New Zealand, GCC Countries, Türkiye, Northern Africa, and South Africa
Key Segments Covered End User, Animal Type, Region
Key Companies Profiled Neogen, Zoetis, Merck, Boehringer Ingelheim, Elanco, Dechra Pharmaceuticals, IDEXX Laboratories, B. Braun Vet Care, and Medtronic
Report Coverage Market Forecast, Company Share Analysis, Competition Intelligence, DROT Analysis, Market Dynamics and Challenges, and Strategic Growth Initiatives
Customization & Pricing Available upon Request

Key segments

By Animal Type:

  • Dogs
  • Cats

By End User:

  • Veterinary Hospitals
  • Veterinary Clinics
  • Homecare Settings

By Region:

  • North America
  • Latin America
  • Europe
  • South Asia & Pacific
  • East Asia
  • The Middle East & Africa (MEA)

Table of Content

  • 1. Executive Summary
  • 2. Market Overview
  • 3. Market Background
  • 4. Global Market Analysis 2018 to 2022 and Forecast, 2023 to 2033
  • 5. Global Market Analysis 2018 to 2022 and Forecast 2023 to 2033, By Animal Type
    • 5.1. Dogs
    • 5.2. Cats
  • 6. Global Market Analysis 2018 to 2022 and Forecast 2023 to 2033, By End User
    • 6.1. Veterinary Hospitals
    • 6.2. Veterinary Clinics
    • 6.3. Homecare Settings
  • 7. Global Market Analysis 2018 to 2022 and Forecast 2023 to 2033, By Region
    • 7.1. North America
    • 7.2. Latin America
    • 7.3. Western Europe
    • 7.4. Eastern Europe
    • 7.5. South Asia and Pacific
    • 7.6. East Asia
    • 7.7. Middle East and Africa
  • 8. North America Market Analysis 2018 to 2022 and Forecast 2023 to 2033, By Country
  • 9. Latin America Market Analysis 2018 to 2022 and Forecast 2023 to 2033, By Country
  • 10. Western Europe Market Analysis 2018 to 2022 and Forecast 2023 to 2033, By Country
  • 11. Eastern Europe Market Analysis 2018 to 2022 and Forecast 2023 to 2033, By Country
  • 12. South Asia and Pacific Market Analysis 2018 to 2022 and Forecast 2023 to 2033, By Country
  • 13. East Asia Market Analysis 2018 to 2022 and Forecast 2023 to 2033, By Country
  • 14. Middle East and Africa Market Analysis 2018 to 2022 and Forecast 2023 to 2033, By Country
  • 15. Key Countries Market Analysis
  • 16. Market Structure Analysis
  • 17. Competition Analysis
    • 17.1. Nova Biomedical
    • 17.2. TaiDoc Technology Corporation
    • 17.3. BioNote Inc
    • 17.4. Woodley Equipment Company Ltd
    • 17.5. i-SENS, Inc.
    • 17.6. MED TRUST
    • 17.7. UltiMed, Inc.
    • 17.8. Biotest Medical Corp
    • 17.9. Zoetis
    • 17.10. Data Sciences International
  • 18. Assumptions & Acronyms Used
  • 19. Research Methodology

List of Tables

Table 1: Global Market Value (US$ Million) Forecast by Region, 2018 to 2033

Table 2: Global Market Volume (Units) Forecast by Region, 2018 to 2033

Table 3: Global Market Value (US$ Million) Forecast by Animal Type, 2018 to 2033

Table 4: Global Market Volume (Units) Forecast by Animal Type, 2018 to 2033

Table 5: Global Market Value (US$ Million) Forecast by End User, 2018 to 2033

Table 6: Global Market Volume (Units) Forecast by End User, 2018 to 2033

Table 7: North America Market Value (US$ Million) Forecast by Country, 2018 to 2033

Table 8: North America Market Volume (Units) Forecast by Country, 2018 to 2033

Table 9: North America Market Value (US$ Million) Forecast by Animal Type, 2018 to 2033

Table 10: North America Market Volume (Units) Forecast by Animal Type, 2018 to 2033

Table 11: North America Market Value (US$ Million) Forecast by End User, 2018 to 2033

Table 12: North America Market Volume (Units) Forecast by End User, 2018 to 2033

Table 13: Latin America Market Value (US$ Million) Forecast by Country, 2018 to 2033

Table 14: Latin America Market Volume (Units) Forecast by Country, 2018 to 2033

Table 15: Latin America Market Value (US$ Million) Forecast by Animal Type, 2018 to 2033

Table 16: Latin America Market Volume (Units) Forecast by Animal Type, 2018 to 2033

Table 17: Latin America Market Value (US$ Million) Forecast by End User, 2018 to 2033

Table 18: Latin America Market Volume (Units) Forecast by End User, 2018 to 2033

Table 19: Western Europe Market Value (US$ Million) Forecast by Country, 2018 to 2033

Table 20: Western Europe Market Volume (Units) Forecast by Country, 2018 to 2033

Table 21: Western Europe Market Value (US$ Million) Forecast by Animal Type, 2018 to 2033

Table 22: Western Europe Market Volume (Units) Forecast by Animal Type, 2018 to 2033

Table 23: Western Europe Market Value (US$ Million) Forecast by End User, 2018 to 2033

Table 24: Western Europe Market Volume (Units) Forecast by End User, 2018 to 2033

Table 25: Eastern Europe Market Value (US$ Million) Forecast by Country, 2018 to 2033

Table 26: Eastern Europe Market Volume (Units) Forecast by Country, 2018 to 2033

Table 27: Eastern Europe Market Value (US$ Million) Forecast by Animal Type, 2018 to 2033

Table 28: Eastern Europe Market Volume (Units) Forecast by Animal Type, 2018 to 2033

Table 29: Eastern Europe Market Value (US$ Million) Forecast by End User, 2018 to 2033

Table 30: Eastern Europe Market Volume (Units) Forecast by End User, 2018 to 2033

Table 31: South Asia and Pacific Market Value (US$ Million) Forecast by Country, 2018 to 2033

Table 32: South Asia and Pacific Market Volume (Units) Forecast by Country, 2018 to 2033

Table 33: South Asia and Pacific Market Value (US$ Million) Forecast by Animal Type, 2018 to 2033

Table 34: South Asia and Pacific Market Volume (Units) Forecast by Animal Type, 2018 to 2033

Table 35: South Asia and Pacific Market Value (US$ Million) Forecast by End User, 2018 to 2033

Table 36: South Asia and Pacific Market Volume (Units) Forecast by End User, 2018 to 2033

Table 37: East Asia Market Value (US$ Million) Forecast by Country, 2018 to 2033

Table 38: East Asia Market Volume (Units) Forecast by Country, 2018 to 2033

Table 39: East Asia Market Value (US$ Million) Forecast by Animal Type, 2018 to 2033

Table 40: East Asia Market Volume (Units) Forecast by Animal Type, 2018 to 2033

Table 41: East Asia Market Value (US$ Million) Forecast by End User, 2018 to 2033

Table 42: East Asia Market Volume (Units) Forecast by End User, 2018 to 2033

Table 43: Middle East and Africa Market Value (US$ Million) Forecast by Country, 2018 to 2033

Table 44: Middle East and Africa Market Volume (Units) Forecast by Country, 2018 to 2033

Table 45: Middle East and Africa Market Value (US$ Million) Forecast by Animal Type, 2018 to 2033

Table 46: Middle East and Africa Market Volume (Units) Forecast by Animal Type, 2018 to 2033

Table 47: Middle East and Africa Market Value (US$ Million) Forecast by End User, 2018 to 2033

Table 48: Middle East and Africa Market Volume (Units) Forecast by End User, 2018 to 2033

List of Figures

Figure 1: Global Market Value (US$ Million) by Animal Type, 2023 to 2033

Figure 2: Global Market Value (US$ Million) by End User, 2023 to 2033

Figure 3: Global Market Value (US$ Million) by Region, 2023 to 2033

Figure 4: Global Market Value (US$ Million) Analysis by Region, 2018 to 2033

Figure 5: Global Market Volume (Units) Analysis by Region, 2018 to 2033

Figure 6: Global Market Value Share (%) and BPS Analysis by Region, 2023 to 2033

Figure 7: Global Market Y-o-Y Growth (%) Projections by Region, 2023 to 2033

Figure 8: Global Market Value (US$ Million) Analysis by Animal Type, 2018 to 2033

Figure 9: Global Market Volume (Units) Analysis by Animal Type, 2018 to 2033

Figure 10: Global Market Value Share (%) and BPS Analysis by Animal Type, 2023 to 2033

Figure 11: Global Market Y-o-Y Growth (%) Projections by Animal Type, 2023 to 2033

Figure 12: Global Market Value (US$ Million) Analysis by End User, 2018 to 2033

Figure 13: Global Market Volume (Units) Analysis by End User, 2018 to 2033

Figure 14: Global Market Value Share (%) and BPS Analysis by End User, 2023 to 2033

Figure 15: Global Market Y-o-Y Growth (%) Projections by End User, 2023 to 2033

Figure 16: Global Market Attractiveness by Animal Type, 2023 to 2033

Figure 17: Global Market Attractiveness by End User, 2023 to 2033

Figure 18: Global Market Attractiveness by Region, 2023 to 2033

Figure 19: North America Market Value (US$ Million) by Animal Type, 2023 to 2033

Figure 20: North America Market Value (US$ Million) by End User, 2023 to 2033

Figure 21: North America Market Value (US$ Million) by Country, 2023 to 2033

Figure 22: North America Market Value (US$ Million) Analysis by Country, 2018 to 2033

Figure 23: North America Market Volume (Units) Analysis by Country, 2018 to 2033

Figure 24: North America Market Value Share (%) and BPS Analysis by Country, 2023 to 2033

Figure 25: North America Market Y-o-Y Growth (%) Projections by Country, 2023 to 2033

Figure 26: North America Market Value (US$ Million) Analysis by Animal Type, 2018 to 2033

Figure 27: North America Market Volume (Units) Analysis by Animal Type, 2018 to 2033

Figure 28: North America Market Value Share (%) and BPS Analysis by Animal Type, 2023 to 2033

Figure 29: North America Market Y-o-Y Growth (%) Projections by Animal Type, 2023 to 2033

Figure 30: North America Market Value (US$ Million) Analysis by End User, 2018 to 2033

Figure 31: North America Market Volume (Units) Analysis by End User, 2018 to 2033

Figure 32: North America Market Value Share (%) and BPS Analysis by End User, 2023 to 2033

Figure 33: North America Market Y-o-Y Growth (%) Projections by End User, 2023 to 2033

Figure 34: North America Market Attractiveness by Animal Type, 2023 to 2033

Figure 35: North America Market Attractiveness by End User, 2023 to 2033

Figure 36: North America Market Attractiveness by Country, 2023 to 2033

Figure 37: Latin America Market Value (US$ Million) by Animal Type, 2023 to 2033

Figure 38: Latin America Market Value (US$ Million) by End User, 2023 to 2033

Figure 39: Latin America Market Value (US$ Million) by Country, 2023 to 2033

Figure 40: Latin America Market Value (US$ Million) Analysis by Country, 2018 to 2033

Figure 41: Latin America Market Volume (Units) Analysis by Country, 2018 to 2033

Figure 42: Latin America Market Value Share (%) and BPS Analysis by Country, 2023 to 2033

Figure 43: Latin America Market Y-o-Y Growth (%) Projections by Country, 2023 to 2033

Figure 44: Latin America Market Value (US$ Million) Analysis by Animal Type, 2018 to 2033

Figure 45: Latin America Market Volume (Units) Analysis by Animal Type, 2018 to 2033

Figure 46: Latin America Market Value Share (%) and BPS Analysis by Animal Type, 2023 to 2033

Figure 47: Latin America Market Y-o-Y Growth (%) Projections by Animal Type, 2023 to 2033

Figure 48: Latin America Market Value (US$ Million) Analysis by End User, 2018 to 2033

Figure 49: Latin America Market Volume (Units) Analysis by End User, 2018 to 2033

Figure 50: Latin America Market Value Share (%) and BPS Analysis by End User, 2023 to 2033

Figure 51: Latin America Market Y-o-Y Growth (%) Projections by End User, 2023 to 2033

Figure 52: Latin America Market Attractiveness by Animal Type, 2023 to 2033

Figure 53: Latin America Market Attractiveness by End User, 2023 to 2033

Figure 54: Latin America Market Attractiveness by Country, 2023 to 2033

Figure 55: Western Europe Market Value (US$ Million) by Animal Type, 2023 to 2033

Figure 56: Western Europe Market Value (US$ Million) by End User, 2023 to 2033

Figure 57: Western Europe Market Value (US$ Million) by Country, 2023 to 2033

Figure 58: Western Europe Market Value (US$ Million) Analysis by Country, 2018 to 2033

Figure 59: Western Europe Market Volume (Units) Analysis by Country, 2018 to 2033

Figure 60: Western Europe Market Value Share (%) and BPS Analysis by Country, 2023 to 2033

Figure 61: Western Europe Market Y-o-Y Growth (%) Projections by Country, 2023 to 2033

Figure 62: Western Europe Market Value (US$ Million) Analysis by Animal Type, 2018 to 2033

Figure 63: Western Europe Market Volume (Units) Analysis by Animal Type, 2018 to 2033

Figure 64: Western Europe Market Value Share (%) and BPS Analysis by Animal Type, 2023 to 2033

Figure 65: Western Europe Market Y-o-Y Growth (%) Projections by Animal Type, 2023 to 2033

Figure 66: Western Europe Market Value (US$ Million) Analysis by End User, 2018 to 2033

Figure 67: Western Europe Market Volume (Units) Analysis by End User, 2018 to 2033

Figure 68: Western Europe Market Value Share (%) and BPS Analysis by End User, 2023 to 2033

Figure 69: Western Europe Market Y-o-Y Growth (%) Projections by End User, 2023 to 2033

Figure 70: Western Europe Market Attractiveness by Animal Type, 2023 to 2033

Figure 71: Western Europe Market Attractiveness by End User, 2023 to 2033

Figure 72: Western Europe Market Attractiveness by Country, 2023 to 2033

Figure 73: Eastern Europe Market Value (US$ Million) by Animal Type, 2023 to 2033

Figure 74: Eastern Europe Market Value (US$ Million) by End User, 2023 to 2033

Figure 75: Eastern Europe Market Value (US$ Million) by Country, 2023 to 2033

Figure 76: Eastern Europe Market Value (US$ Million) Analysis by Country, 2018 to 2033

Figure 77: Eastern Europe Market Volume (Units) Analysis by Country, 2018 to 2033

Figure 78: Eastern Europe Market Value Share (%) and BPS Analysis by Country, 2023 to 2033

Figure 79: Eastern Europe Market Y-o-Y Growth (%) Projections by Country, 2023 to 2033

Figure 80: Eastern Europe Market Value (US$ Million) Analysis by Animal Type, 2018 to 2033

Figure 81: Eastern Europe Market Volume (Units) Analysis by Animal Type, 2018 to 2033

Figure 82: Eastern Europe Market Value Share (%) and BPS Analysis by Animal Type, 2023 to 2033

Figure 83: Eastern Europe Market Y-o-Y Growth (%) Projections by Animal Type, 2023 to 2033

Figure 84: Eastern Europe Market Value (US$ Million) Analysis by End User, 2018 to 2033

Figure 85: Eastern Europe Market Volume (Units) Analysis by End User, 2018 to 2033

Figure 86: Eastern Europe Market Value Share (%) and BPS Analysis by End User, 2023 to 2033

Figure 87: Eastern Europe Market Y-o-Y Growth (%) Projections by End User, 2023 to 2033

Figure 88: Eastern Europe Market Attractiveness by Animal Type, 2023 to 2033

Figure 89: Eastern Europe Market Attractiveness by End User, 2023 to 2033

Figure 90: Eastern Europe Market Attractiveness by Country, 2023 to 2033

Figure 91: South Asia and Pacific Market Value (US$ Million) by Animal Type, 2023 to 2033

Figure 92: South Asia and Pacific Market Value (US$ Million) by End User, 2023 to 2033

Figure 93: South Asia and Pacific Market Value (US$ Million) by Country, 2023 to 2033

Figure 94: South Asia and Pacific Market Value (US$ Million) Analysis by Country, 2018 to 2033

Figure 95: South Asia and Pacific Market Volume (Units) Analysis by Country, 2018 to 2033

Figure 96: South Asia and Pacific Market Value Share (%) and BPS Analysis by Country, 2023 to 2033

Figure 97: South Asia and Pacific Market Y-o-Y Growth (%) Projections by Country, 2023 to 2033

Figure 98: South Asia and Pacific Market Value (US$ Million) Analysis by Animal Type, 2018 to 2033

Figure 99: South Asia and Pacific Market Volume (Units) Analysis by Animal Type, 2018 to 2033

Figure 100: South Asia and Pacific Market Value Share (%) and BPS Analysis by Animal Type, 2023 to 2033

Figure 101: South Asia and Pacific Market Y-o-Y Growth (%) Projections by Animal Type, 2023 to 2033

Figure 102: South Asia and Pacific Market Value (US$ Million) Analysis by End User, 2018 to 2033

Figure 103: South Asia and Pacific Market Volume (Units) Analysis by End User, 2018 to 2033

Figure 104: South Asia and Pacific Market Value Share (%) and BPS Analysis by End User, 2023 to 2033

Figure 105: South Asia and Pacific Market Y-o-Y Growth (%) Projections by End User, 2023 to 2033

Figure 106: South Asia and Pacific Market Attractiveness by Animal Type, 2023 to 2033

Figure 107: South Asia and Pacific Market Attractiveness by End User, 2023 to 2033

Figure 108: South Asia and Pacific Market Attractiveness by Country, 2023 to 2033

Figure 109: East Asia Market Value (US$ Million) by Animal Type, 2023 to 2033

Figure 110: East Asia Market Value (US$ Million) by End User, 2023 to 2033

Figure 111: East Asia Market Value (US$ Million) by Country, 2023 to 2033

Figure 112: East Asia Market Value (US$ Million) Analysis by Country, 2018 to 2033

Figure 113: East Asia Market Volume (Units) Analysis by Country, 2018 to 2033

Figure 114: East Asia Market Value Share (%) and BPS Analysis by Country, 2023 to 2033

Figure 115: East Asia Market Y-o-Y Growth (%) Projections by Country, 2023 to 2033

Figure 116: East Asia Market Value (US$ Million) Analysis by Animal Type, 2018 to 2033

Figure 117: East Asia Market Volume (Units) Analysis by Animal Type, 2018 to 2033

Figure 118: East Asia Market Value Share (%) and BPS Analysis by Animal Type, 2023 to 2033

Figure 119: East Asia Market Y-o-Y Growth (%) Projections by Animal Type, 2023 to 2033

Figure 120: East Asia Market Value (US$ Million) Analysis by End User, 2018 to 2033

Figure 121: East Asia Market Volume (Units) Analysis by End User, 2018 to 2033

Figure 122: East Asia Market Value Share (%) and BPS Analysis by End User, 2023 to 2033

Figure 123: East Asia Market Y-o-Y Growth (%) Projections by End User, 2023 to 2033

Figure 124: East Asia Market Attractiveness by Animal Type, 2023 to 2033

Figure 125: East Asia Market Attractiveness by End User, 2023 to 2033

Figure 126: East Asia Market Attractiveness by Country, 2023 to 2033

Figure 127: Middle East and Africa Market Value (US$ Million) by Animal Type, 2023 to 2033

Figure 128: Middle East and Africa Market Value (US$ Million) by End User, 2023 to 2033

Figure 129: Middle East and Africa Market Value (US$ Million) by Country, 2023 to 2033

Figure 130: Middle East and Africa Market Value (US$ Million) Analysis by Country, 2018 to 2033

Figure 131: Middle East and Africa Market Volume (Units) Analysis by Country, 2018 to 2033

Figure 132: Middle East and Africa Market Value Share (%) and BPS Analysis by Country, 2023 to 2033

Figure 133: Middle East and Africa Market Y-o-Y Growth (%) Projections by Country, 2023 to 2033

Figure 134: Middle East and Africa Market Value (US$ Million) Analysis by Animal Type, 2018 to 2033

Figure 135: Middle East and Africa Market Volume (Units) Analysis by Animal Type, 2018 to 2033

Figure 136: Middle East and Africa Market Value Share (%) and BPS Analysis by Animal Type, 2023 to 2033

Figure 137: Middle East and Africa Market Y-o-Y Growth (%) Projections by Animal Type, 2023 to 2033

Figure 138: Middle East and Africa Market Value (US$ Million) Analysis by End User, 2018 to 2033

Figure 139: Middle East and Africa Market Volume (Units) Analysis by End User, 2018 to 2033

Figure 140: Middle East and Africa Market Value Share (%) and BPS Analysis by End User, 2023 to 2033

Figure 141: Middle East and Africa Market Y-o-Y Growth (%) Projections by End User, 2023 to 2033

Figure 142: Middle East and Africa Market Attractiveness by Animal Type, 2023 to 2033

Figure 143: Middle East and Africa Market Attractiveness by End User, 2023 to 2033

Figure 144: Middle East and Africa Market Attractiveness by Country, 2023 to 2033

Frequently Asked Questions

What is the Veterinary Glucometers market CAGR for 2033?

The veterinary glucometers market CAGR for 2033 is 5.0%.

How Big Will the Veterinary Glucometers Market by 2033?

The market is estimated to reach US$ 574.9 million by 2033.

Who are the Key Veterinary Glucometers Market Players?

Zoetis, Abbott, and Woodley Equipment Company Ltd are key market players.

What is the Current Market Valuation of the Veterinary Glucometers Market?

The market is estimated to secure a valuation of US$ 351.3 million in 2023.

Which Region Holds a Significant Share of the Veterinary Glucometers Market?

North America holds a significant share of the market.

Explore Similar Insights

Future Market Insights

Veterinary Glucometers Market