Veterinary Computed Tomography Scanner Market Size and Share Forecast Outlook 2025 to 2035

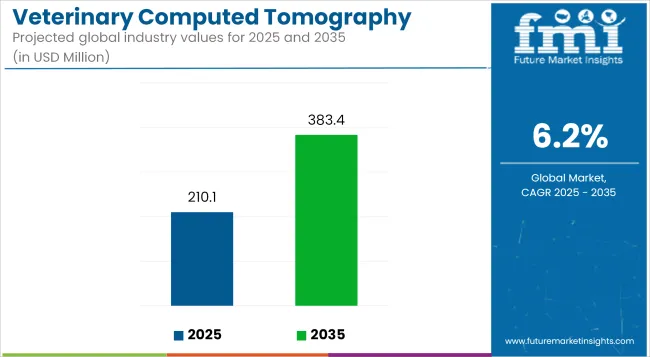
The Veterinary Computed Tomography Scanner Market is estimated to reach USD 210.1 Million by 2025. Between 2025 and 2035, the market is expected to grow at a CAGR of 6.2%, reaching a total value of USD 383.4 Million by the end of the assessment period.
Quick Stats for Veterinary Computed Tomography Scanner Market

  • Industry Value (2025): USD 210.1 million
  • Forecast Value (2035): USD 383.4 million
  • Forecast CAGR: 6.2%
  • Leading Segment in 2025: Stationary Multi-slice CT Scanners (46.9% market share)
  • Key Growth Region: North America, Asia-Pacific, Europe
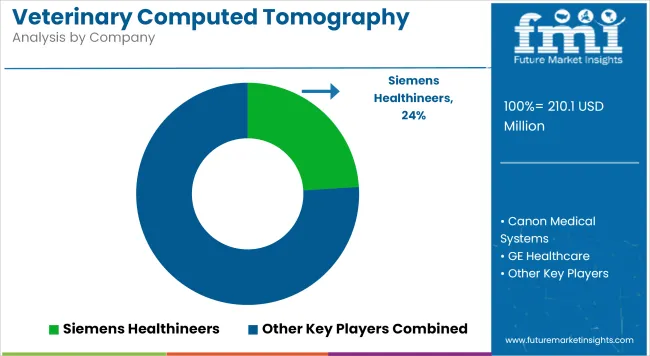
  • Top Key Players: Siemens Healthineers, Canon Medical Systems, GE Healthcare, Animage LLC, Asto CT, Inc., Epica Animal Health, Samsung Electronics Co. Ltd (Neurologica Corporation)

Veterinary Computed Tomography Scanner Market Industry Value Analysis

Metric Value
Market Size (2025E) USD 210.1 Million
Market Value (2035F) USD 383.4 Million
CAGR (2025 to 2035) 6.2%

The veterinary computed tomography (CT) scanner market is experiencing steady expansion, supported by growing demand for advanced diagnostic capabilities in companion animal care. Rising pet ownership and increased spending on veterinary services have encouraged practices to invest in high-resolution imaging systems to improve diagnostic accuracy and treatment planning.

Veterinary hospitals and specialty clinics are adopting CT technology to address complex clinical cases involving oncology, neurology, and orthopedics, where conventional imaging modalities have limitations. Regulatory approvals and safety certifications have further supported adoption across developed regions, while emerging markets are gradually investing in modern imaging infrastructure. Ongoing technological innovation in image reconstruction software and multi-slice configurations is expected to drive performance improvements and workflow efficiency.
Analyzing Veterinary Computed Tomography Scanner Market by Top Investment Segments

Stationary Multi-slice CT Scanners Leading the Type Segment

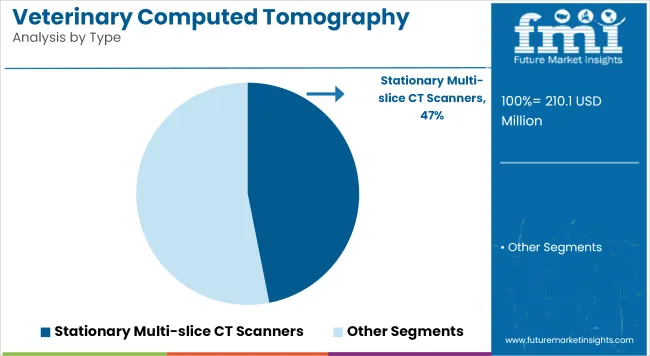
Veterinary Computed Tomography Scanner Market Analysis By Type

In 2025, stationary multi-slice CT scanners are anticipated to hold a 46.9% revenue share in the veterinary computed tomography scanner market. This leadership has been attributed to their superior imaging resolution and the capability to capture detailed cross-sectional images rapidly. Clinical demand for accurate visualization of complex anatomical structures has been observed to drive investment in multi-slice configurations, which enable faster throughput and improved diagnostic confidence.

Veterinary facilities have favored stationary systems for their compatibility with high-volume workflows and their ability to support a broad range of applications, including trauma assessment and oncology staging. Additionally, advancements in workstation integration and 3D rendering capabilities have reinforced the segment’s appeal. Collectively, these factors have established stationary multi-slice CT scanners as the preferred modality in practices seeking comprehensive imaging solutions.
Small Animals as the Dominant Animal Group

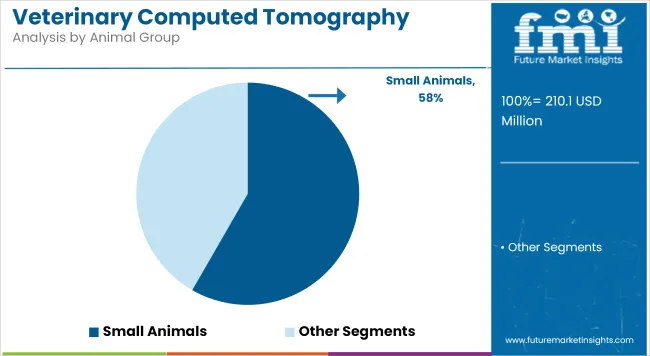
Veterinary Computed Tomography Scanner Market Analysis By Animal Group

Small animals are projected to account for 58.3% of the market share in 2025. This dominance has been supported by the rising prevalence of chronic conditions in companion animals and a heightened emphasis on preventive and specialty care. Practices have increasingly adopted CT imaging for small animal patients to improve early diagnosis and treatment planning in neurological, orthopedic, and oncological cases.

The segment has benefited from increased pet insurance penetration and higher discretionary spending by owners on advanced diagnostics. Manufacturers have developed CT systems specifically configured for small animal anatomy, enhancing positioning accuracy and reducing anesthesia time. These developments, coupled with heightened clinical awareness of the benefits of cross-sectional imaging, have strengthened the segment’s growth trajectory.

Veterinary Hospitals Leading the Veterinary Computed Tomography Scanner Market

In 2025, veterinary hospitals are expected to hold a dominant 57.9% revenue share in the veterinary computed tomography (CT) scanner market. This segment's growth has been driven by the increasing demand for advanced imaging techniques to diagnose a variety of animal health conditions.

Veterinary hospitals are equipped with specialized CT scanners that provide detailed, high-resolution images, enabling accurate diagnoses for conditions such as trauma, cancer, and neurological disorders in animals. The integration of CT scanning into veterinary hospitals has allowed for more precise and non-invasive diagnostic capabilities, which is critical in providing comprehensive care for both companion animals and livestock.

Moreover, as veterinary medicine continues to adopt more sophisticated technologies, CT scanners have become essential tools in emergency and specialty veterinary care, facilitating faster decision-making and treatment planning. Increased investment by veterinary hospitals in advanced diagnostic technologies, combined with the growing recognition of the importance of early and accurate disease detection, has further contributed to the expansion of this segment.

Challenges and Opportunities

Challenges

High Equipment Costs and Limited Awareness in Emerging Markets

High cost of equipment and maintenance is one of the major challenges of the veterinary CT scanner market, which makes it inaccessible to smaller veterinary practices and emerging markets. Lack of awareness about the benefits of advanced diagnostic imaging also holds back adoption in less economically developed countries.

Opportunities

Technological Innovations and Growing Preventive Care Demand

Emerging developments like compact and cost-effective CT scanners which are meant for veterinary use would benefit growth in this field. Preventive health care and early disease detection almost propel the application areas even wider. Collaboration between developing world manufacturers and veterinary services to provide affordable solutions and teaching would open up new market opportunities.
Country-wise Insights

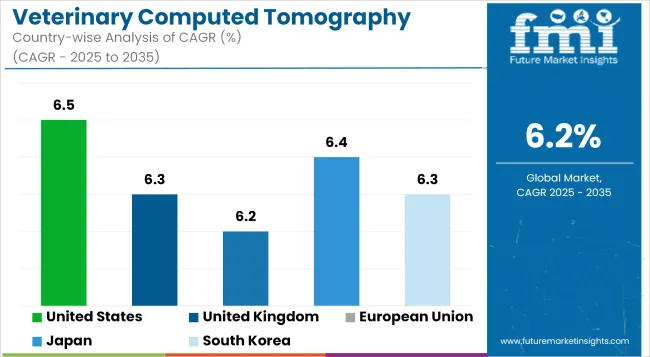
Veterinary Computed Tomography Scanner Market Cagr Analysis By Country

United States

A rapid expansion in the veterinary CT scanner market is occurring in the USA due to increases in pet ownership and advances in understanding diagnostic imaging for animals. More and more veterinarians are resorting to CT scanning for the precise diagnosis of specific diseases, including tumors, fractures, and trauma, in pets as well as livestock.

Market growth is spurred by advanced veterinary healthcare facilities coupled with investment in the technology of animal health. Further, the existing trend toward pet insurance provision and much more spending on pet healthcare is anticipated to propel the market demand for ultra-modern imaging systems. Safety and effectiveness measures by regulatory bodies like the FDA add to market confidence toward CT scanners in veterinary applications.

Country CAGR (2025 to 2035)
United States 6.5%

United Kingdom

The UK veterinary ct scanner market is experiencing a steady growth path propelled by the increasing acceptance of high-tech veterinary diagnostic techniques. The willingness of pet owners to spend on animal healthcare and the proliferation of specialty veterinary clinics are also factors promoting market growth.

Regulatory safety and compliance of the devices concerned are taken care of by the veterinary medicines directorate (VMD). Rapid improvements in CT imaging technology, including shorter scan time and enhanced image resolution, have enabled better diagnostic and treatment planning accuracy for veterinary personnel. This trend is now boosted further by interest in pet health insurance and awareness of animal health.

Country CAGR (2025 to 2035)
United Kingdom 6.3%

European Union

The veterinary computed tomography market is almost steady in the European Union primarily due to the increase in pet ownership and the rise in acceptability of advanced veterinary care facilities. The contributions of Germany, France, and the Netherlands in this bright field of development in veterinary healthcare make this market grow on a larger scale. European Medicines Agency (EMA) regulations state the high standards that are needed for safety and efficacy in veterinary CT scanners as they were approved.

Promising advancements in their technology such as 3D imaging and low-radiation exposure have been awe-inspiring in the ranks of the profession of veterinary diagnostics. This has led to the huge growth of the market because of increased demand for quick diagnosis and treatment of animal diseases across the region.

Country CAGR (2025 to 2035)
European Union 6.2%

Japan

The growing number of companion animals and increased awareness about pet health and well-being are some of the factors driving growth in the veterinary CT scanner market in Japan. The regulation of veterinary medical devices in the country is done by the Ministry of Health, Labour, and Welfare and ensures that there are strict safety standards and quality as well. Implementation of advanced imaging technology in veterinary clinics and hospitals has been increasing, so diagnostics and outcomes from treatment improved.

The Japanese veterinary professional has focused on precision medicine and minimally invasive diagnostics, which increases the market for such instruments, including CT scanners. In addition, increased investments in veterinary healthcare infrastructure and research stimulate the expansion of markets.

Country CAGR (2025 to 2035)
Japan 6.4%

South Korea

The South Korea market for veterinary CT scanning has been growing due to the increasing ownership of pets on the one hand and advancements in veterinary healthcare services on the other. Medical devices, including veterinary imaging systems, are regulated for safety and efficacy under the Ministry of Food and Drug Safety (MFDS).

Owing to the sound electronics and IT sectors, advanced imaging technologies are integrated into veterinary diagnostics among all other low fields. CT scanners are also increasingly used in animal healthcare practice to get highly detailed images for diagnosis of difficult health conditions in pets and livestock.

Growing public awareness on health matters and increasing spending on pet care are key market drivers. Furthermore, the state promotion of animal welfare and smart health care technologies is beneficial in developing the market.

Country CAGR (2025 to 2035)
South Korea 6.3%

Competitive Outlook

Veterinary Computed Tomography Scanner Market Analysis By Company

The veterinary computed tomography scanner market is increasingly competitive as pet ownership grows and demand rises for advanced imaging in companion animal and equine care. Leading manufacturers are investing in compact, high-resolution systems designed specifically for veterinary practices, as well as large-bore scanners for livestock and equine applications.

Strategic collaborations with specialty clinics, regulatory clearances, and product line expansions are strengthening competitive positioning. Additionally, emphasis on faster scan times, lower radiation doses, and integration with veterinary PACS and 3D planning software is driving innovation. Companies are also focusing on affordability and service contracts to support adoption in mid-sized practices and emerging markets.

  • In 2025, Insight Mobile Veterinary Diagnostics launched Australia's first mobile veterinary CT. Equipped with a human-quality Samsung Neurologica scanner in a truck, it brings advanced imaging directly to animal patients in Victoria.
  • In 2024, Patterson Veterinary's MyVet Imaging CT system, showcased at IVECCS 2024, delivers cutting-edge, high-quality 3D imaging. Its compact design enables precise diagnostics for animals, improving patient outcomes.

Companies

  • GE Healthcare
  • Toshiba Medical Systems Corporation
  • Siemens AG
  • Koninklijke Philips N.V.
  • Epica Medical Innovations
  • Samsung Electronics Co. Ltd. (Neurologica Corporation)
  • Hitachi, Ltd.
  • Animage
  • LLC
  • QR S.R.L.
  • Gin ApS

Key segments

By Type:

  • Portable CT Scanners
  • Stationary Multi-slice CT Scanners
  • Mid-end CT Scanners
  • High-end CT Scanners
  • Low-end CT Scanners

By Animal Group:

  • Large Animals (Horses, Cattles)
  • Small Animals (Cats, Dogs, Etc.)
  • Others

By Application:

  • Neurology
  • Oncology
  • Orthopedics and Traumatology
  • Other Applications

By End User:

  • Veterinary Hospitals and Clinics
  • Academic Institutes and Teaching Hospitals

By Region:

  • North America
  • Latin America
  • Asia Pacific
  • Middle East and Africa
  • Europe

Table of Content

  1. Executive Summary
  2. Industry Introduction, including Taxonomy and Market Definition
  3. Market Trends and Success Factors, including Macro-economic Factors, Market Dynamics, and Recent Industry Developments
  4. Global Market Demand Analysis 2020 to 2024 and Forecast 2025 to 2035, including Historical Analysis and Future Projections
  5. Pricing Analysis
  6. Global Market Analysis 2020 to 2024 and Forecast 2025 to 2035
    • Type
    • Animal Group
    • Application
    • End User
  7. Global Market Analysis 2020 to 2024 and Forecast 2025 to 2035, By Type
    • Portable CT Scanners
    • Stationary Multi-slice CT Scanners
    • Mid-end CT Scanners
    • High-end CT Scanners
    • Low-end CT Scanners
  8. Global Market Analysis 2020 to 2024 and Forecast 2025 to 2035, By Animal Group
    • Large Animals (Horses, Cattles)
    • Small Animals (Cats, Dogs, Etc.)
    • Others
  9. Global Market Analysis 2020 to 2024 and Forecast 2025 to 2035, By Application
    • Neurology
    • Oncology
    • Orthopedics and Traumatology
    • Other Applications
  10. Global Market Analysis 2020 to 2024 and Forecast 2025 to 2035, By End User
    • Veterinary Hospitals and Clinics
    • Academic Institutes and Teaching Hospitals
  11. Global Market Analysis 2020 to 2024 and Forecast 2025 to 2035, By Region
    • North America
    • Latin America
    • Western Europe
    • Eastern Europe
    • East Asia
    • South Asia Pacific
    • Middle East and Africa
  12. North America Sales Analysis 2020 to 2024 and Forecast 2025 to 2035, by Key Segments and Countries
  13. Latin America Sales Analysis 2020 to 2024 and Forecast 2025 to 2035, by Key Segments and Countries
  14. Western Europe Sales Analysis 2020 to 2024 and Forecast 2025 to 2035, by Key Segments and Countries
  15. Eastern Europe Sales Analysis 2020 to 2024 and Forecast 2025 to 2035, by Key Segments and Countries
  16. East Asia Sales Analysis 2020 to 2024 and Forecast 2025 to 2035, by Key Segments and Countries
  17. South Asia Pacific Sales Analysis 2020 to 2024 and Forecast 2025 to 2035, by Key Segments and Countries
  18. Middle East and Africa Sales Analysis 2020 to 2024 and Forecast 2025 to 2035, by Key Segments and Countries
  19. Sales Forecast 2025 to 2035 by Type, Animal Group, Application, and End User for 30 Countries
  20. Competition Outlook, including Market Structure Analysis, Company Share Analysis by Key Players, and Competition Dashboard
  21. Company Profile
    • GE Healthcare
    • Toshiba Medical Systems Corporation
    • Siemens AG
    • Koninklijke Philips N.V
    • Epica Medical Innovations
    • Samsung Electronics Co. Ltd. (Neurologica Corporation)
    • Hitachi, Ltd.
    • Animage, LLC
    • QR S.R.L.
    • Gin ApS

List of Tables

  • Table 1: Global Market Value (USD Million) Forecast by Region, 2020 to 2035
  • Table 2: Global Market Value (USD Million) Forecast by Type, 2020 to 2035
  • Table 3: Global Market Value (USD Million) Forecast by Animal Group, 2020 to 2035
  • Table 4: Global Market Value (USD Million) Forecast by Application, 2020 to 2035
  • Table 5: Global Market Value (USD Million) Forecast by End User, 2020 to 2035
  • Table 6: North America Market Value (USD Million) Forecast by Country, 2020 to 2035
  • Table 7: North America Market Value (USD Million) Forecast by Type, 2020 to 2035
  • Table 8: North America Market Value (USD Million) Forecast by Animal Group, 2020 to 2035
  • Table 9: North America Market Value (USD Million) Forecast by Application, 2020 to 2035
  • Table 10: North America Market Value (USD Million) Forecast by End User, 2020 to 2035
  • Table 11: Latin America Market Value (USD Million) Forecast by Country, 2020 to 2035
  • Table 12: Latin America Market Value (USD Million) Forecast by Type, 2020 to 2035
  • Table 13: Latin America Market Value (USD Million) Forecast by Animal Group, 2020 to 2035
  • Table 14: Latin America Market Value (USD Million) Forecast by Application, 2020 to 2035
  • Table 15: Latin America Market Value (USD Million) Forecast by End User, 2020 to 2035
  • Table 16: Western Europe Market Value (USD Million) Forecast by Country, 2020 to 2035
  • Table 17: Western Europe Market Value (USD Million) Forecast by Type, 2020 to 2035
  • Table 18: Western Europe Market Value (USD Million) Forecast by Animal Group, 2020 to 2035
  • Table 19: Western Europe Market Value (USD Million) Forecast by Application, 2020 to 2035
  • Table 20: Western Europe Market Value (USD Million) Forecast by End User, 2020 to 2035
  • Table 21: Eastern Europe Market Value (USD Million) Forecast by Country, 2020 to 2035
  • Table 22: Eastern Europe Market Value (USD Million) Forecast by Type, 2020 to 2035
  • Table 23: Eastern Europe Market Value (USD Million) Forecast by Animal Group, 2020 to 2035
  • Table 24: Eastern Europe Market Value (USD Million) Forecast by Application, 2020 to 2035
  • Table 25: Eastern Europe Market Value (USD Million) Forecast by End User, 2020 to 2035
  • Table 26: South Asia and Pacific Market Value (USD Million) Forecast by Country, 2020 to 2035
  • Table 27: South Asia and Pacific Market Value (USD Million) Forecast by Type, 2020 to 2035
  • Table 28: South Asia and Pacific Market Value (USD Million) Forecast by Animal Group, 2020 to 2035
  • Table 29: South Asia and Pacific Market Value (USD Million) Forecast by Application, 2020 to 2035
  • Table 30: South Asia and Pacific Market Value (USD Million) Forecast by End User, 2020 to 2035
  • Table 31: East Asia Market Value (USD Million) Forecast by Country, 2020 to 2035
  • Table 32: East Asia Market Value (USD Million) Forecast by Type, 2020 to 2035
  • Table 33: East Asia Market Value (USD Million) Forecast by Animal Group, 2020 to 2035
  • Table 34: East Asia Market Value (USD Million) Forecast by Application, 2020 to 2035
  • Table 35: East Asia Market Value (USD Million) Forecast by End User, 2020 to 2035
  • Table 36: Middle East and Africa Market Value (USD Million) Forecast by Country, 2020 to 2035
  • Table 37: Middle East and Africa Market Value (USD Million) Forecast by Type, 2020 to 2035
  • Table 38: Middle East and Africa Market Value (USD Million) Forecast by Animal Group, 2020 to 2035
  • Table 39: Middle East and Africa Market Value (USD Million) Forecast by Application, 2020 to 2035
  • Table 40: Middle East and Africa Market Value (USD Million) Forecast by End User, 2020 to 2035

List of Figures

  • Figure 1: Global Market Value (USD Million) by Type, 2025 to 2035
  • Figure 2: Global Market Value (USD Million) by Animal Group, 2025 to 2035
  • Figure 3: Global Market Value (USD Million) by Application, 2025 to 2035
  • Figure 4: Global Market Value (USD Million) by End User, 2025 to 2035
  • Figure 5: Global Market Value (USD Million) by Region, 2025 to 2035
  • Figure 6: Global Market Value (USD Million) Analysis by Region, 2020 to 2035
  • Figure 7: Global Market Value Share (%) and BPS Analysis by Region, 2025 to 2035
  • Figure 8: Global Market Y-o-Y Growth (%) Projections by Region, 2025 to 2035
  • Figure 9: Global Market Value (USD Million) Analysis by Type, 2020 to 2035
  • Figure 10: Global Market Value Share (%) and BPS Analysis by Type, 2025 to 2035
  • Figure 11: Global Market Y-o-Y Growth (%) Projections by Type, 2025 to 2035
  • Figure 12: Global Market Value (USD Million) Analysis by Animal Group, 2020 to 2035
  • Figure 13: Global Market Value Share (%) and BPS Analysis by Animal Group, 2025 to 2035
  • Figure 14: Global Market Y-o-Y Growth (%) Projections by Animal Group, 2025 to 2035
  • Figure 15: Global Market Value (USD Million) Analysis by Application, 2020 to 2035
  • Figure 16: Global Market Value Share (%) and BPS Analysis by Application, 2025 to 2035
  • Figure 17: Global Market Y-o-Y Growth (%) Projections by Application, 2025 to 2035
  • Figure 18: Global Market Value (USD Million) Analysis by End User, 2020 to 2035
  • Figure 19: Global Market Value Share (%) and BPS Analysis by End User, 2025 to 2035
  • Figure 20: Global Market Y-o-Y Growth (%) Projections by End User, 2025 to 2035
  • Figure 21: Global Market Attractiveness by Type, 2025 to 2035
  • Figure 22: Global Market Attractiveness by Animal Group, 2025 to 2035
  • Figure 23: Global Market Attractiveness by Application, 2025 to 2035
  • Figure 24: Global Market Attractiveness by End User, 2025 to 2035
  • Figure 25: Global Market Attractiveness by Region, 2025 to 2035
  • Figure 26: North America Market Value (USD Million) by Type, 2025 to 2035
  • Figure 27: North America Market Value (USD Million) by Animal Group, 2025 to 2035
  • Figure 28: North America Market Value (USD Million) by Application, 2025 to 2035
  • Figure 29: North America Market Value (USD Million) by End User, 2025 to 2035
  • Figure 30: North America Market Value (USD Million) by Country, 2025 to 2035
  • Figure 31: North America Market Value (USD Million) Analysis by Country, 2020 to 2035
  • Figure 32: North America Market Value Share (%) and BPS Analysis by Country, 2025 to 2035
  • Figure 33: North America Market Y-o-Y Growth (%) Projections by Country, 2025 to 2035
  • Figure 34: North America Market Value (USD Million) Analysis by Type, 2020 to 2035
  • Figure 35: North America Market Value Share (%) and BPS Analysis by Type, 2025 to 2035
  • Figure 36: North America Market Y-o-Y Growth (%) Projections by Type, 2025 to 2035
  • Figure 37: North America Market Value (USD Million) Analysis by Animal Group, 2020 to 2035
  • Figure 38: North America Market Value Share (%) and BPS Analysis by Animal Group, 2025 to 2035
  • Figure 39: North America Market Y-o-Y Growth (%) Projections by Animal Group, 2025 to 2035
  • Figure 40: North America Market Value (USD Million) Analysis by Application, 2020 to 2035
  • Figure 41: North America Market Value Share (%) and BPS Analysis by Application, 2025 to 2035
  • Figure 42: North America Market Y-o-Y Growth (%) Projections by Application, 2025 to 2035
  • Figure 43: North America Market Value (USD Million) Analysis by End User, 2020 to 2035
  • Figure 44: North America Market Value Share (%) and BPS Analysis by End User, 2025 to 2035
  • Figure 45: North America Market Y-o-Y Growth (%) Projections by End User, 2025 to 2035
  • Figure 46: North America Market Attractiveness by Type, 2025 to 2035
  • Figure 47: North America Market Attractiveness by Animal Group, 2025 to 2035
  • Figure 48: North America Market Attractiveness by Application, 2025 to 2035
  • Figure 49: North America Market Attractiveness by End User, 2025 to 2035
  • Figure 50: North America Market Attractiveness by Country, 2025 to 2035
  • Figure 51: Latin America Market Value (USD Million) by Type, 2025 to 2035
  • Figure 52: Latin America Market Value (USD Million) by Animal Group, 2025 to 2035
  • Figure 53: Latin America Market Value (USD Million) by Application, 2025 to 2035
  • Figure 54: Latin America Market Value (USD Million) by End User, 2025 to 2035
  • Figure 55: Latin America Market Value (USD Million) by Country, 2025 to 2035
  • Figure 56: Latin America Market Value (USD Million) Analysis by Country, 2020 to 2035
  • Figure 57: Latin America Market Value Share (%) and BPS Analysis by Country, 2025 to 2035
  • Figure 58: Latin America Market Y-o-Y Growth (%) Projections by Country, 2025 to 2035
  • Figure 59: Latin America Market Value (USD Million) Analysis by Type, 2020 to 2035
  • Figure 60: Latin America Market Value Share (%) and BPS Analysis by Type, 2025 to 2035
  • Figure 61: Latin America Market Y-o-Y Growth (%) Projections by Type, 2025 to 2035
  • Figure 62: Latin America Market Value (USD Million) Analysis by Animal Group, 2020 to 2035
  • Figure 63: Latin America Market Value Share (%) and BPS Analysis by Animal Group, 2025 to 2035
  • Figure 64: Latin America Market Y-o-Y Growth (%) Projections by Animal Group, 2025 to 2035
  • Figure 65: Latin America Market Value (USD Million) Analysis by Application, 2020 to 2035
  • Figure 66: Latin America Market Value Share (%) and BPS Analysis by Application, 2025 to 2035
  • Figure 67: Latin America Market Y-o-Y Growth (%) Projections by Application, 2025 to 2035
  • Figure 68: Latin America Market Value (USD Million) Analysis by End User, 2020 to 2035
  • Figure 69: Latin America Market Value Share (%) and BPS Analysis by End User, 2025 to 2035
  • Figure 70: Latin America Market Y-o-Y Growth (%) Projections by End User, 2025 to 2035
  • Figure 71: Latin America Market Attractiveness by Type, 2025 to 2035
  • Figure 72: Latin America Market Attractiveness by Animal Group, 2025 to 2035
  • Figure 73: Latin America Market Attractiveness by Application, 2025 to 2035
  • Figure 74: Latin America Market Attractiveness by End User, 2025 to 2035
  • Figure 75: Latin America Market Attractiveness by Country, 2025 to 2035
  • Figure 76: Western Europe Market Value (USD Million) by Type, 2025 to 2035
  • Figure 77: Western Europe Market Value (USD Million) by Animal Group, 2025 to 2035
  • Figure 78: Western Europe Market Value (USD Million) by Application, 2025 to 2035
  • Figure 79: Western Europe Market Value (USD Million) by End User, 2025 to 2035
  • Figure 80: Western Europe Market Value (USD Million) by Country, 2025 to 2035
  • Figure 81: Western Europe Market Value (USD Million) Analysis by Country, 2020 to 2035
  • Figure 82: Western Europe Market Value Share (%) and BPS Analysis by Country, 2025 to 2035
  • Figure 83: Western Europe Market Y-o-Y Growth (%) Projections by Country, 2025 to 2035
  • Figure 84: Western Europe Market Value (USD Million) Analysis by Type, 2020 to 2035
  • Figure 85: Western Europe Market Value Share (%) and BPS Analysis by Type, 2025 to 2035
  • Figure 86: Western Europe Market Y-o-Y Growth (%) Projections by Type, 2025 to 2035
  • Figure 87: Western Europe Market Value (USD Million) Analysis by Animal Group, 2020 to 2035
  • Figure 88: Western Europe Market Value Share (%) and BPS Analysis by Animal Group, 2025 to 2035
  • Figure 89: Western Europe Market Y-o-Y Growth (%) Projections by Animal Group, 2025 to 2035
  • Figure 90: Western Europe Market Value (USD Million) Analysis by Application, 2020 to 2035
  • Figure 91: Western Europe Market Value Share (%) and BPS Analysis by Application, 2025 to 2035
  • Figure 92: Western Europe Market Y-o-Y Growth (%) Projections by Application, 2025 to 2035
  • Figure 93: Western Europe Market Value (USD Million) Analysis by End User, 2020 to 2035
  • Figure 94: Western Europe Market Value Share (%) and BPS Analysis by End User, 2025 to 2035
  • Figure 95: Western Europe Market Y-o-Y Growth (%) Projections by End User, 2025 to 2035
  • Figure 96: Western Europe Market Attractiveness by Type, 2025 to 2035
  • Figure 97: Western Europe Market Attractiveness by Animal Group, 2025 to 2035
  • Figure 98: Western Europe Market Attractiveness by Application, 2025 to 2035
  • Figure 99: Western Europe Market Attractiveness by End User, 2025 to 2035
  • Figure 100: Western Europe Market Attractiveness by Country, 2025 to 2035
  • Figure 101: Eastern Europe Market Value (USD Million) by Type, 2025 to 2035
  • Figure 102: Eastern Europe Market Value (USD Million) by Animal Group, 2025 to 2035
  • Figure 103: Eastern Europe Market Value (USD Million) by Application, 2025 to 2035
  • Figure 104: Eastern Europe Market Value (USD Million) by End User, 2025 to 2035
  • Figure 105: Eastern Europe Market Value (USD Million) by Country, 2025 to 2035
  • Figure 106: Eastern Europe Market Value (USD Million) Analysis by Country, 2020 to 2035
  • Figure 107: Eastern Europe Market Value Share (%) and BPS Analysis by Country, 2025 to 2035
  • Figure 108: Eastern Europe Market Y-o-Y Growth (%) Projections by Country, 2025 to 2035
  • Figure 109: Eastern Europe Market Value (USD Million) Analysis by Type, 2020 to 2035
  • Figure 110: Eastern Europe Market Value Share (%) and BPS Analysis by Type, 2025 to 2035
  • Figure 111: Eastern Europe Market Y-o-Y Growth (%) Projections by Type, 2025 to 2035
  • Figure 112: Eastern Europe Market Value (USD Million) Analysis by Animal Group, 2020 to 2035
  • Figure 113: Eastern Europe Market Value Share (%) and BPS Analysis by Animal Group, 2025 to 2035
  • Figure 114: Eastern Europe Market Y-o-Y Growth (%) Projections by Animal Group, 2025 to 2035
  • Figure 115: Eastern Europe Market Value (USD Million) Analysis by Application, 2020 to 2035
  • Figure 116: Eastern Europe Market Value Share (%) and BPS Analysis by Application, 2025 to 2035
  • Figure 117: Eastern Europe Market Y-o-Y Growth (%) Projections by Application, 2025 to 2035
  • Figure 118: Eastern Europe Market Value (USD Million) Analysis by End User, 2020 to 2035
  • Figure 119: Eastern Europe Market Value Share (%) and BPS Analysis by End User, 2025 to 2035
  • Figure 120: Eastern Europe Market Y-o-Y Growth (%) Projections by End User, 2025 to 2035
  • Figure 121: Eastern Europe Market Attractiveness by Type, 2025 to 2035
  • Figure 122: Eastern Europe Market Attractiveness by Animal Group, 2025 to 2035
  • Figure 123: Eastern Europe Market Attractiveness by Application, 2025 to 2035
  • Figure 124: Eastern Europe Market Attractiveness by End User, 2025 to 2035
  • Figure 125: Eastern Europe Market Attractiveness by Country, 2025 to 2035
  • Figure 126: South Asia and Pacific Market Value (USD Million) by Type, 2025 to 2035
  • Figure 127: South Asia and Pacific Market Value (USD Million) by Animal Group, 2025 to 2035
  • Figure 128: South Asia and Pacific Market Value (USD Million) by Application, 2025 to 2035
  • Figure 129: South Asia and Pacific Market Value (USD Million) by End User, 2025 to 2035
  • Figure 130: South Asia and Pacific Market Value (USD Million) by Country, 2025 to 2035
  • Figure 131: South Asia and Pacific Market Value (USD Million) Analysis by Country, 2020 to 2035
  • Figure 132: South Asia and Pacific Market Value Share (%) and BPS Analysis by Country, 2025 to 2035
  • Figure 133: South Asia and Pacific Market Y-o-Y Growth (%) Projections by Country, 2025 to 2035
  • Figure 134: South Asia and Pacific Market Value (USD Million) Analysis by Type, 2020 to 2035
  • Figure 135: South Asia and Pacific Market Value Share (%) and BPS Analysis by Type, 2025 to 2035
  • Figure 136: South Asia and Pacific Market Y-o-Y Growth (%) Projections by Type, 2025 to 2035
  • Figure 137: South Asia and Pacific Market Value (USD Million) Analysis by Animal Group, 2020 to 2035
  • Figure 138: South Asia and Pacific Market Value Share (%) and BPS Analysis by Animal Group, 2025 to 2035
  • Figure 139: South Asia and Pacific Market Y-o-Y Growth (%) Projections by Animal Group, 2025 to 2035
  • Figure 140: South Asia and Pacific Market Value (USD Million) Analysis by Application, 2020 to 2035
  • Figure 141: South Asia and Pacific Market Value Share (%) and BPS Analysis by Application, 2025 to 2035
  • Figure 142: South Asia and Pacific Market Y-o-Y Growth (%) Projections by Application, 2025 to 2035
  • Figure 143: South Asia and Pacific Market Value (USD Million) Analysis by End User, 2020 to 2035
  • Figure 144: South Asia and Pacific Market Value Share (%) and BPS Analysis by End User, 2025 to 2035
  • Figure 145: South Asia and Pacific Market Y-o-Y Growth (%) Projections by End User, 2025 to 2035
  • Figure 146: South Asia and Pacific Market Attractiveness by Type, 2025 to 2035
  • Figure 147: South Asia and Pacific Market Attractiveness by Animal Group, 2025 to 2035
  • Figure 148: South Asia and Pacific Market Attractiveness by Application, 2025 to 2035
  • Figure 149: South Asia and Pacific Market Attractiveness by End User, 2025 to 2035
  • Figure 150: South Asia and Pacific Market Attractiveness by Country, 2025 to 2035
  • Figure 151: East Asia Market Value (USD Million) by Type, 2025 to 2035
  • Figure 152: East Asia Market Value (USD Million) by Animal Group, 2025 to 2035
  • Figure 153: East Asia Market Value (USD Million) by Application, 2025 to 2035
  • Figure 154: East Asia Market Value (USD Million) by End User, 2025 to 2035
  • Figure 155: East Asia Market Value (USD Million) by Country, 2025 to 2035
  • Figure 156: East Asia Market Value (USD Million) Analysis by Country, 2020 to 2035
  • Figure 157: East Asia Market Value Share (%) and BPS Analysis by Country, 2025 to 2035
  • Figure 158: East Asia Market Y-o-Y Growth (%) Projections by Country, 2025 to 2035
  • Figure 159: East Asia Market Value (USD Million) Analysis by Type, 2020 to 2035
  • Figure 160: East Asia Market Value Share (%) and BPS Analysis by Type, 2025 to 2035
  • Figure 161: East Asia Market Y-o-Y Growth (%) Projections by Type, 2025 to 2035
  • Figure 162: East Asia Market Value (USD Million) Analysis by Animal Group, 2020 to 2035
  • Figure 163: East Asia Market Value Share (%) and BPS Analysis by Animal Group, 2025 to 2035
  • Figure 164: East Asia Market Y-o-Y Growth (%) Projections by Animal Group, 2025 to 2035
  • Figure 165: East Asia Market Value (USD Million) Analysis by Application, 2020 to 2035
  • Figure 166: East Asia Market Value Share (%) and BPS Analysis by Application, 2025 to 2035
  • Figure 167: East Asia Market Y-o-Y Growth (%) Projections by Application, 2025 to 2035
  • Figure 168: East Asia Market Value (USD Million) Analysis by End User, 2020 to 2035
  • Figure 169: East Asia Market Value Share (%) and BPS Analysis by End User, 2025 to 2035
  • Figure 170: East Asia Market Y-o-Y Growth (%) Projections by End User, 2025 to 2035
  • Figure 171: East Asia Market Attractiveness by Type, 2025 to 2035
  • Figure 172: East Asia Market Attractiveness by Animal Group, 2025 to 2035
  • Figure 173: East Asia Market Attractiveness by Application, 2025 to 2035
  • Figure 174: East Asia Market Attractiveness by End User, 2025 to 2035
  • Figure 175: East Asia Market Attractiveness by Country, 2025 to 2035
  • Figure 176: Middle East and Africa Market Value (USD Million) by Type, 2025 to 2035
  • Figure 177: Middle East and Africa Market Value (USD Million) by Animal Group, 2025 to 2035
  • Figure 178: Middle East and Africa Market Value (USD Million) by Application, 2025 to 2035
  • Figure 179: Middle East and Africa Market Value (USD Million) by End User, 2025 to 2035
  • Figure 180: Middle East and Africa Market Value (USD Million) by Country, 2025 to 2035
  • Figure 181: Middle East and Africa Market Value (USD Million) Analysis by Country, 2020 to 2035
  • Figure 182: Middle East and Africa Market Value Share (%) and BPS Analysis by Country, 2025 to 2035
  • Figure 183: Middle East and Africa Market Y-o-Y Growth (%) Projections by Country, 2025 to 2035
  • Figure 184: Middle East and Africa Market Value (USD Million) Analysis by Type, 2020 to 2035
  • Figure 185: Middle East and Africa Market Value Share (%) and BPS Analysis by Type, 2025 to 2035
  • Figure 186: Middle East and Africa Market Y-o-Y Growth (%) Projections by Type, 2025 to 2035
  • Figure 187: Middle East and Africa Market Value (USD Million) Analysis by Animal Group, 2020 to 2035
  • Figure 188: Middle East and Africa Market Value Share (%) and BPS Analysis by Animal Group, 2025 to 2035
  • Figure 189: Middle East and Africa Market Y-o-Y Growth (%) Projections by Animal Group, 2025 to 2035
  • Figure 190: Middle East and Africa Market Value (USD Million) Analysis by Application, 2020 to 2035
  • Figure 191: Middle East and Africa Market Value Share (%) and BPS Analysis by Application, 2025 to 2035
  • Figure 192: Middle East and Africa Market Y-o-Y Growth (%) Projections by Application, 2025 to 2035
  • Figure 193: Middle East and Africa Market Value (USD Million) Analysis by End User, 2020 to 2035
  • Figure 194: Middle East and Africa Market Value Share (%) and BPS Analysis by End User, 2025 to 2035
  • Figure 195: Middle East and Africa Market Y-o-Y Growth (%) Projections by End User, 2025 to 2035
  • Figure 196: Middle East and Africa Market Attractiveness by Type, 2025 to 2035
  • Figure 197: Middle East and Africa Market Attractiveness by Animal Group, 2025 to 2035
  • Figure 198: Middle East and Africa Market Attractiveness by Application, 2025 to 2035
  • Figure 199: Middle East and Africa Market Attractiveness by End User, 2025 to 2035
  • Figure 200: Middle East and Africa Market Attractiveness by Country, 2025 to 2035

Frequently Asked Questions

What was the overall size of the veterinary computed tomography scanner market in 2025?

The overall market size for the veterinary computed tomography scanner market was USD 210.1 million in 2025.

How big is the veterinary computed tomography scanner market expected to be in 2035?

The market is expected to reach USD 383.4 million in 2035.

What will drive the demand for the veterinary computed tomography scanner market during the forecast period?

Demand will be driven by increasing pet ownership, rising prevalence of animal diseases, advancements in veterinary imaging technologies, and growing adoption of advanced diagnostic tools.

List the top 5 countries contributing to the veterinary computed tomography scanner market?

The top 5 contributing countries are USA, UK, Europe, Japan, and South Korea.

Which segment in type is expected to lead the veterinary computed tomography scanner market?

The Stationary Multi-slice CT Scanners segment is expected to lead the market due to its faster imaging capabilities and better image resolution.

Explore Similar Insights

Future Market Insights

Veterinary Computed Tomography Scanner Market