Veterinary Boluses Market Size and Share Forecast Outlook 2025 to 2035

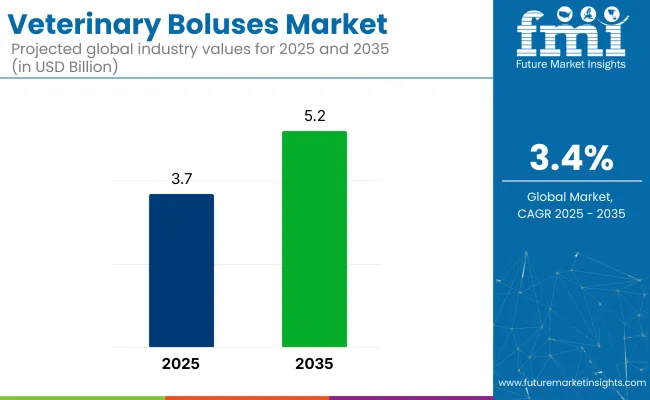
The veterinary boluses market is anticipated to witness steady growth over the next decade, with its industry value projected to rise from approximately USD 3.7 billion in 2025 to USD 5.2 billion by 2035. This growth corresponds to a CAGR of 3.4% during this period.
Quick Stats for the Veterinary Boluses Market

  • Industry Value (2025): USD 3.7 billion
  • Forecast Value (2035): USD 5.2 billion
  • Forecast CAGR: 3.4%
  • Leading Segment in 2025: Farm Animal (63.5% share)
  • Key Growth Region: Asia Pacific (China)
  • Top Key Players: Zoetis, Merck Animal Health, Boehringer Ingelheim Animal Health, Elanco Animal Health, and Virbac

Veterinary Boluses Market

The increase in industry size reflects the growing importance of veterinary boluses in maintaining animal health and improving livestock productivity. They are widely used to deliver essential nutrients and medications efficiently to animals, which has made them a crucial component in the animal healthcare sector.

In a joint statement, NOAH CEO Dawn Howard emphasized that an agreement on veterinary medicines is ‘achievable and urgently needed,’ while Animal Health Europe's Roxane Feller highlighted the importance of guaranteed access to veterinary medicines in safeguarding animal health, food security, and public health.

The industry holds a specialized share within its parent markets. In the animal health market, its share is approximately 3-5%, as veterinary boluses are a specific form of medication used for various animal health issues. Within the veterinary pharmaceuticals market, the share is around 2-3%, as boluses represent one of the many pharmaceutical products used for treating animals.

In the livestock market, the share is about 5-7%, as boluses are commonly used to improve the health and productivity of livestock. Within the animal feed market, the share is approximately 1-2%, as veterinary boluses are often used alongside feed to address deficiencies. In the veterinary diagnostics market, the share is around 1-2%, as boluses may be used in conjunction with diagnostic treatments.

Veterinary Boluses Market Analyzed by Top Investment Segments

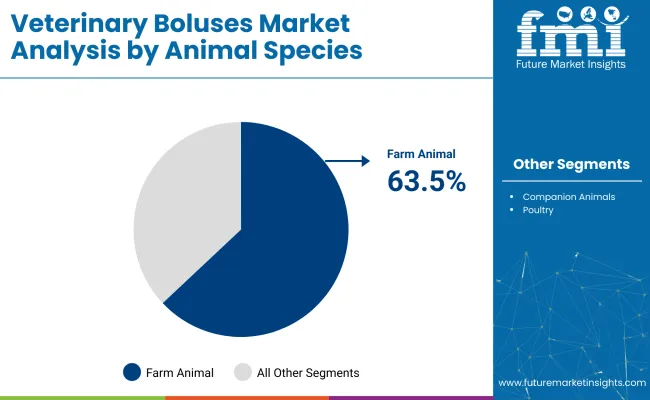
The industry is projected to grow, with anthelmintic boluses leading the drug class with 42.2% industry share in 2025. Immediate-release boluses will capture 48.9%, farm animals will dominate species at 63.5%, and commercial livestock farms will account for 41% of the sales channel share.
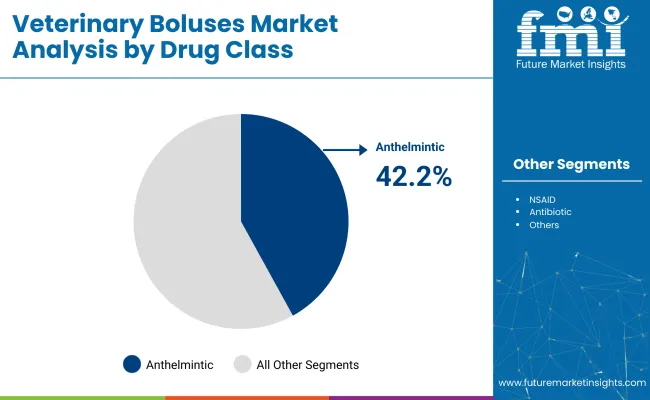
Anthelmintic boluses dominate the drug class with 42.2% industry share

Veterinary Boluses Market Analysis By Drug Class

Anthelmintic boluses are expected to dominate the industry, capturing 42.2% of the industry share in 2025. These boluses are essential for controlling parasitic infections, which can severely impact livestock health and productivity. Worms and other parasites cause weight loss, reduced milk production, and, in extreme cases, death.

The growing demand for animal products and the expansion of livestock farming further increase the demand for anthelmintic boluses. Stringent regulations regarding animal health reinforce the preference for anthelmintic treatments, making these boluses the most widely used and trusted segment in the industry.

  • Vital for controlling parasitic infections in livestock, ensuring health and productivity
  • Increased livestock farming and stringent regulations drive industry demand
  • Widely used and trusted for their effectiveness in controlling parasitic diseases

Immediate-Release Boluses Capture the Majority of the Formulation Segment at 48.9%

Immediate-release boluses are projected to capture 48.9% of the industry share in 2025, making them the dominant formulation type. These boluses provide quick delivery of essential nutrients and medications, which is crucial in urgent animal health situations. The rapid dissolution of these boluses ensures that animals receive necessary treatments without delay, improving their health outcomes.

The preference for immediate-release boluses is driven by their ease of use, fast results, and the growing emphasis on animal welfare. Timely treatment of health complications through immediate-release boluses helps improve livestock productivity, contributing to their widespread adoption.
  • Quick nutrient and medication delivery ensures rapid health intervention
  • Preferred for ease of use and fast-acting results, enhancing animal welfare
  • Supports livestock productivity by addressing health issues promptly

Farm Animals Account for the Largest Share in the Species Segment at 63.5%

Veterinary Boluses Market Analysis By Animal Species

Farm animals are expected to dominate the species segment, holding 63.5% of the industry share in 2025. The large scale of livestock farming globally contributes to the industry’s growth, as the health and productivity of farm animals such as cattle, sheep, goats, and buffalo are critical for food security and agricultural economies.

Veterinary boluses are widely used to provide essential nutrients, prevent diseases, and improve growth and digestion in farm animals. The increasing demand for high-quality animal products has driven farmers to adopt advanced health solutions like boluses, which ensure optimal animal care in large-scale operations.

  • Dominated by large-scale livestock farming, especially for milk, meat, and other products
  • Veterinary boluses provide essential nutrients and prevent diseases in farm animals
  • Rising demand for quality animal products pushes farmers to adopt boluses

Commercial Livestock Farms Lead Sales Channel with 41% Industry Share

The commercial livestock farms segment is projected to hold 41% of the industry share in 2025. These farms operate on a large scale, requiring efficient and effective animal health management solutions to maintain herd productivity and profitability.

The boluses are particularly suited for these farms, as they allow for systematic management of animal health, preventing disease outbreaks and nutritional deficiencies without frequent handling. By providing a reliable method for delivering essential nutrients and medications over time, boluses support the health of large animal populations while ensuring minimal disruption to farm operations.

  • Commercial farms require efficient health management for large-scale operations
  • Boluses deliver essential nutrients and medications over time, minimizing handling
  • Effective in preventing disease outbreaks and supporting herd productivity

Top Veterinary Boluses Market Dynamics

The industry is growing due to rising demand for improved animal health and productivity, driven by global needs for animal-derived products. Innovations in bolus formulations and strong regulatory support are enhancing treatment efficiency and adoption, particularly in commercial farming.

Growing Demand for Animal Health and Productivity

The industry is expanding due to rising global demand for meat, milk, and other animal products, driving farmers to adopt effective solutions for improving livestock health and productivity. Boluses help prevent diseases, control parasitic infections, and supplement essential nutrients, leading to enhanced animal growth and output. As awareness of preventive care and animal welfare increases among farmers and veterinarians, the demand continues to grow, supporting industry expansion.

  • Rising global demand for animal products is increasing the adoption of veterinary boluses.
  • Boluses prevent diseases, control infections, and improve animal growth, boosting productivity.
  • Increased awareness of preventive care and animal welfare is driving industry growth.

Advancements in Formulation and Regulatory Support

Continuous innovations in bolus formulations, such as immediate-release and controlled-release types, are providing tailored treatment options to meet diverse animal health needs. These advancements improve treatment efficiency and ease of administration, particularly in large-scale commercial farms. Strong regulatory support and initiatives aimed at promoting livestock health and food safety are fostering the adoption. As livestock farming becomes more commercialized, these factors contribute to steady industry growth.
  • Innovations in bolus formulations provide tailored treatment options for different health needs.
  • Regulatory support and government initiatives are driving adoption, particularly in commercial farming.
  • The increasing commercialization of livestock farming is supporting steady industry growth.

Analyzing Top Countries Manufacturing, Distributing, and Supplying Veterinary Boluses

Country Wise Analysis Of Veterinary Boluses Market

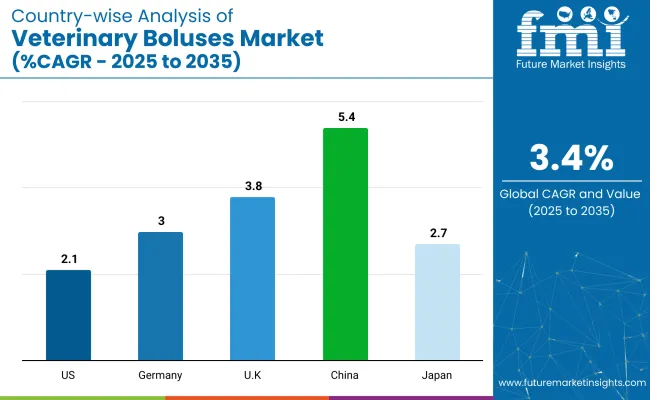
Countries CAGR (2025 to 2035)
United States 2.1%
Germany 3%
United Kingdom 3.8%
China 5.4%
Japan 2.7%

The industry demand is projected to rise at a 3.4% CAGR from 2025 to 2035. Of the five profiled countries out of 40 covered, China leads at 5.4%, followed by the United Kingdom at 3.8%, and Germany at 3%, while the United States posts 2.1% and Japan records 2.7%.

These rates translate to a growth premium of +59% for China, +12% for the United Kingdom, and -11% for Germany versus the baseline, while the United States and Japan trail with slower growth. Divergence reflects local catalysts: expanding agricultural and livestock sectors in China, increasing demand in livestock care, and more steady growth in developed industries such as the United States and Japan, where established industries and demand stability lead to slower growth.

Growth Analysis of Veterinary Boluses Market in the United States

Sales of veterinary boluses in the United States are projected to grow at a CAGR of 2.1% between 2025 and 2035. Growth has been supported by a highly mechanized livestock sector, particularly in dairy operations, where long-acting veterinary dosage forms reduce labor input and dosing variability.

Regulatory frameworks that govern animal welfare and drug residue thresholds in meat and milk encourage preventive healthcare strategies. Adoption of boluses is accelerating as herd sizes increase and producers seek shelf-stable, precision-release formats that support productivity across dairy and beef supply chains.

  • Boluses are integrated into herd health protocols to align with USDA veterinary compliance audits.
  • Commercial feedlots adopt trace-mineral and dewormer boluses for uniform nutrient delivery.
  • Tele-veterinary tools facilitate bolus prescription and dosage tracking across dispersed ranching operations.

Veterinary Boluses Market Growth Outlook in Germany

Demand for veterinary boluses in Germany is expected to grow at a CAGR of 3% from 2025 to 2035. Veterinary practice in Germany increasingly emphasizes antimicrobial stewardship, encouraging bolus formats as an alternative to repeated antibiotic use. Dairy cooperatives in Bavaria and Lower Saxony are investing in biosecurity measures that include traceable veterinary interventions.

Boluses deliver standardized, long-term mineral supplementation, improving livestock resilience under rotational grazing systems. Adoption is further driven by research grants and public-private collaborations focused on smart farming tools.

  • Digital bolus monitoring systems are being piloted to assess real-time rumen activity.
  • Veterinary retailers offer mineral bolus assortments tailored to organic-certification guidelines.
  • State subsidies back bolus usage under programs targeting antibiotic use reduction.

Future Outlook for Veterinary Boluses Market in the United Kingdom

Industry demand in the United Kingdom is projected to rise at a CAGR of 3.8% during 2025 to 2035. Uptake is influenced by modernization in livestock management, where boluses address seasonal nutritional gaps and parasite control across hill grazing zones. Post-Brexit regulatory reforms have encouraged traceability and on-farm medication recording, fostering interest in long-duration veterinary formats. Adoption is being seen across mixed-farming systems, particularly where smallholder operations prioritize low-intervention animal care practices.

  • Bolus-based supplements are deployed in pasture-fed beef schemes to comply with Red Tractor standards.
  • Sheep farmers adopt copper and selenium boluses for lambing season optimization.
  • UK veterinary colleges conduct bolus trials for integrated parasite control in wetland grazing areas.

Demand Forecast for Veterinary Boluses Market in China

Industry in China is set to record a CAGR of 5.4% between 2025 and 2035. Industrial-scale pig and cattle operations are incorporating bolus delivery to manage health protocols with fewer labor inputs. National policy supporting safe meat production and antimicrobial resistance control has boosted usage. Boluses are preferred in regions with workforce shortages, offering compliance-friendly dosage control. Expansion of dairy clusters in provinces like Heilongjiang and Inner Mongolia has driven volume growth.

  • Controlled-release boluses replace repeated dosing in verticalized poultry-livestock farming systems.
  • Provincial grants support R&D in slow-dissolving bolus shells for local ruminant breeds.
  • Integration of bolus schedules in livestock ERP systems enhances dosing consistency and documentation.

Analysis of Veterinary Boluses Market in Japan

Veterinary boluses demand in Japan is forecasted to grow at a CAGR of 2.7% through 2035. Strong traceability regulations and emphasis on food safety standards have supported adoption of controlled-dose veterinary formats. Boluses are favored for reducing dosing frequency in regions with a declining farm workforce. Usage has expanded across small dairy operations and high-value beef farms aiming to meet stringent meat export standards. Veterinary manufacturers are localizing bolus formulations to match Japanese dietary and climatic requirements.
  • Labor-light boluses are adopted across aging-farmer communities in Tohoku and Kyushu.
  • Japan’s veterinary code prioritizes low-residue bolus formats in certified export slaughterhouses.
  • Bolus-packaged vitamin blends are used in cattle for summer stress mitigation in humid zones.

Leading Veterinary Boluses Suppliers

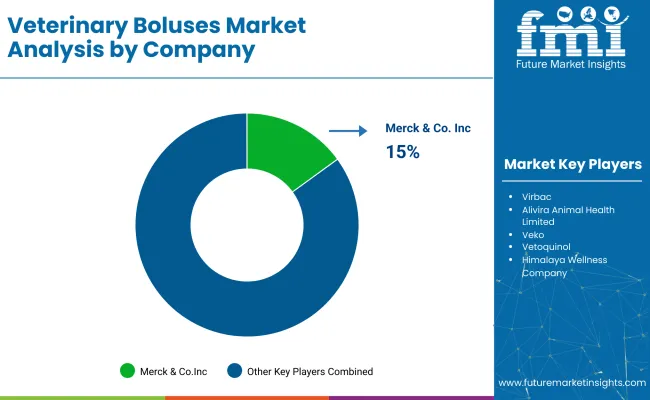
Veterinary Boluses Market Analysis By Company

Leading Company - Merck & Co., Inc.

Industry Share - 15%

The global industry features a competitive landscape with dominant players, key players, and emerging players. Dominant players such as Merck & Co., Inc., Zoetis Services LLC, and Boehringer Ingelheim Animal Health lead the industry with extensive product portfolios, strong R&D capabilities, and robust distribution networks across livestock, poultry, and companion animal sectors.

Key players including Virbac, Vetoquinol, and Alivira Animal Health Limited offer specialized solutions tailored to specific applications and regional industries. Emerging players, such as AHV International B.V., AdvaCare Pharma®, and Himalaya Wellness Company, focus on innovative technologies and cost-effective solutions, expanding their presence in the global industry.

Recent Industry News

  • In May 2025, Merck Animal Health announced a major USD 895 million investment in manufacturing and R&D facilities in De Soto, Kansas. This expansion aims to meet growing demand for animal biologics and enhance R&D capabilities, with site preparation starting immediately and commercial manufacturing expected by 2030.
  • In 2024, the European Medicines Agency (EMA) recommended 25 veterinary medicines for advertising authorization, the highest number in a year. This includes bolus formulations aimed at improving animal health and productivity.

Leading Suppliers in the Veterinary Boluses Market

  • Merck & Co., Inc.
  • AdvaCare Pharma®
  • Virbac
  • Alivira Animal Health Limited
  • Veko
  • Vetoquinol
  • Himalaya Wellness Company
  • AHV International B.V
  • Zoetis Services LLC
  • Boehringer Ingelheim Animal Health
  • Bio-Vet

Research Coverage and Scope Summary

Report Attributes Details
Industry Size (2025) USD 3.7 billion
Industry Size (2035) USD 5.2 billion
CAGR (2025 to 2035) 3.4%
Base Year for Estimation 2024
Historical Period 2020 to 2024
Projections Period 2025 to 2035
Quantitative Units USD billion for value and units for volume
Drug Class Analyzed (Segment 1) Anthelmintic, Antibiotic, NSAID, Probiotic/Prebiotic, Hormonal Boluses, Nutritional Boluses, And Combination Boluses.
Formulation Covered (Segment 2) Slow-Release Boluses, Immediate-Release Boluses, and Effervescent Boluses.
Animal Species Covered (Segment 3) Farm Animals (Cattle, Sheep & Goats, Swine), Companion Animals (Canine, Feline, Equine), And Poultry.
Sales Channel Analyzed (Segment 4) Veterinary Hospitals, Veterinary Clinics, Commercial Livestock Farms, Retail Pharmacy Chains, And Online Pharmacies.
Regions Covered North America, Western Europe, East Asia, South Asia
Countries Covered United States, Canada, United Kingdom, Germany, France, Italy, Spain, Netherlands, China, Japan, South Korea, India, Pakistan, Bangladesh
Key Players Influencing the Industry Merck & Co., Inc., AdvaCare Pharma®, Virbac, Alivira Animal Health Limited, Veko, Vetoquinol, Himalaya Wellness Company, AHV International B.V., Zoetis Services LLC, Boehringer Ingelheim Animal Health, and Bio-Vet.
Additional Attributes Dollar sales, industry share, growth trends, key segments, regional demand, competitive landscape, pricing strategies, customer preferences, regulatory impact, and innovation opportunities to optimize product development and industry positioning.

Veterinary Boluses Market Analyzed by Key Investment Segments

By Drug Class:

The industry is segmented into anthelmintic, antibiotic, NSAID, probiotic/prebiotic, hormonal boluses, nutritional boluses, and combination boluses.

By Formulation:

The industry covers slow-release boluses, immediate-release boluses, and effervescent boluses.

By Animal Species:

The industry is categorized into farm animals, companion animals, and poultry. Farm animals are subdivided into cattle, sheep & goats, and swine. Companion animals are subdivided into canine, feline, and equine.

By Sales Channel:

The industry is divided into veterinary hospitals, veterinary clinics, commercial livestock farms, retail pharmacy chains, and online pharmacies.

By Region:

The industry spans North America, Western Europe, East Asia, and South Asia.

Table of Content

  1. Executive Summary
    • Global Market Outlook
    • Demand-side Trends
    • Supply-side Trends
    • Technology Roadmap Analysis
    • Analysis and Recommendations
  2. Market Overview
    • Market Coverage / Taxonomy
    • Market Definition / Scope / Limitations
  3. Market Background
    • Market Dynamics
      • Drivers
      • Restraints
      • Opportunity
      • Trends
    • Scenario Forecast
      • Demand in Optimistic Scenario
      • Demand in Likely Scenario
      • Demand in Conservative Scenario
    • Opportunity Map Analysis
    • Product Life Cycle Analysis
    • Supply Chain Analysis
      • Supply Side Participants and their Roles
        • Producers
        • Mid-Level Participants (Traders/ Agents/ Brokers)
        • Wholesalers and Distributors
      • Value Added and Value Created at Node in the Supply Chain
      • List of Raw Material Suppliers
      • List of Existing and Potential Buyer’s
    • Investment Feasibility Matrix
    • Value Chain Analysis
      • Profit Margin Analysis
      • Wholesalers and Distributors
      • Retailers
    • PESTLE and Porter’s Analysis
    • Regulatory Landscape
      • By Key Regions
      • By Key Countries
    • Regional Parent Market Outlook
    • Production and Consumption Statistics
    • Import and Export Statistics
  4. Global Market Analysis 2020 to 2024 and Forecast, 2025 to 2035
    • Historical Market Size Value (USD Million) & Volume (units) Analysis, 2020 to 2024
    • Current and Future Market Size Value (USD Million) & Volume (units) Projections, 2025 to 2035
      • Y-o-Y Growth Trend Analysis
      • Absolute $ Opportunity Analysis
  5. Global Market Pricing Analysis 2020 to 2024 and Forecast 2025 to 2035
  6. Global Market Analysis 2020 to 2024 and Forecast 2025 to 2035, By Drug Class
    • Introduction / Key Findings
    • Historical Market Size Value (USD Million) & Volume (units) Analysis By Drug Class, 2020 to 2024
    • Current and Future Market Size Value (USD Million) & Volume (units) Analysis and Forecast By Drug Class, 2025 to 2035
      • Anthelmintic
      • Antibiotic
      • NSAID
      • Probiotic/Prebiotic
      • Hormonal Boluses
      • Nutritional Boluses
      • Combination Boluses
    • Y-o-Y Growth Trend Analysis By Drug Class, 2020 to 2024
    • Absolute $ Opportunity Analysis By Drug Class, 2025 to 2035
  7. Global Market Analysis 2020 to 2024 and Forecast 2025 to 2035, By Formulation
    • Introduction / Key Findings
    • Historical Market Size Value (USD Million) & Volume (units) Analysis By Formulation, 2020 to 2024
    • Current and Future Market Size Value (USD Million) & Volume (units) Analysis and Forecast by Formulation, 2025 to 2035
      • Slow-Release Boluses
      • Immediate-Release Boluses
      • Effervescent Boluses
    • Y-o-Y Growth Trend Analysis By Formulation, 2020 to 2024
    • Absolute $ Opportunity Analysis By Formulation, 2025 to 2035
  8. Global Market Analysis 2020 to 2024 and Forecast 2025 to 2035, By Animal Species
    • Introduction / Key Findings
    • Historical Market Size Value (USD Million) & Volume (units) Analysis By Animal Species, 2020 to 2024
    • Current and Future Market Size Value (USD Million) & Volume (units) Analysis and Forecast By Animal Species, 2025 to 2035
      • Farm Animals
        • Cattle
        • Sheep & Goats
        • Swine
      • Companion Animals
        • Canine
        • Feline
        • Equine
      • Poultry
    • Y-o-Y Growth Trend Analysis By Animal Species, 2020 to 2024
    • Absolute $ Opportunity Analysis By Animal Species, 2025 to 2035
  9. Global Market Analysis 2020 to 2024 and Forecast 2025 to 2035, By Sales Channel
    • Introduction / Key Findings
    • Historical Market Size Value (USD Million) & Volume (units) Analysis By Sales Channel, 2020 to 2024
    • Current and Future Market Size Value (USD Million) & Volume (units) Analysis and Forecast By Sales Channel, 2025 to 2035
      • Veterinary Hospitals
      • Veterinary Clinics
      • Commercial Livestock Farms
      • Retail Pharmacy Chains
      • Online Pharmacies
    • Y-o-Y Growth Trend Analysis By Sales Channel, 2020 to 2024
    • Absolute $ Opportunity Analysis By Sales Channel, 2025 to 2035
  10. Global Market Analysis 2020 to 2024 and Forecast 2025 to 2035, By Region
    • Introduction
    • Historical Market Size Value (USD Million) & Volume (units) Analysis By Region, 2020 to 2024
    • Current Market Size Value (USD Million) & Volume (units) Analysis and Forecast By Region, 2025 to 2035
      • North America
      • Latin America
      • Western Europe
      • Eastern Europe
      • East Asia
      • South Asia & Pacific
      • Middle East and Africa
    • Market Attractiveness Analysis By Region
  11. North America Market Analysis 2020 to 2024 and Forecast 2025 to 2035, By Country
    • Historical Market Size Value (USD Million) & Volume (units) Trend Analysis By Market Taxonomy, 2020 to 2024
    • Market Size Value (USD Million) & Volume (units) Forecast By Market Taxonomy, 2025 to 2035
      • By Country
        • USA
        • Canada
        • Mexico
      • By Drug Class
      • By Formulation
      • By Animal Species
      • By Sales Channel
    • Market Attractiveness Analysis
      • By Country
      • By Drug Class
      • By Formulation
      • By Animal Species
      • By Sales Channel
    • Key Takeaways
  12. Latin America Market Analysis 2020 to 2024 and Forecast 2025 to 2035, By Country
    • Historical Market Size Value (USD Million) & Volume (units) Trend Analysis By Market Taxonomy, 2020 to 2024
    • Market Size Value (USD Million) & Volume (units) Forecast By Market Taxonomy, 2025 to 2035
      • By Country
        • Brazil
        • Argentina
        • Rest of LATAM
      • By Drug Class
      • By Formulation
      • By Animal Species
      • By Sales Channel
    • Market Attractiveness Analysis
      • By Country
      • By Drug Class
      • By Formulation
      • By Animal Species
      • By Sales Channel
    • Key Takeaways
  13. Western Europe Market Analysis 2020 to 2024 and Forecast 2025 to 2035, By Country
    • Historical Market Size Value (USD Million) & Volume (units) Trend Analysis By Market Taxonomy, 2020 to 2024
    • Market Size Value (USD Million) & Volume (units) Forecast By Market Taxonomy, 2025 to 2035
      • By Country
        • Germany
        • Italy
        • France
        • UK
        • Spain
        • BENELUX
        • Nordic
        • Rest of W. Europe
      • By Drug Class
      • By Formulation
      • By Animal Species
      • By Sales Channel
    • Market Attractiveness Analysis
      • By Country
      • By Drug Class
      • By Formulation
      • By Animal Species
      • By Sales Channel
    • Key Takeaways
  14. Eastern Europe Market Analysis 2020 to 2024 and Forecast 2025 to 2035, By Country
    • Historical Market Size Value (USD Million) & Volume (units) Trend Analysis By Market Taxonomy, 2020 to 2024
    • Market Size Value (USD Million) & Volume (units) Forecast By Market Taxonomy, 2025 to 2035
      • By Country
        • Russia
        • Hungary
        • Poland
        • Balkan & Baltics
        • Rest of E. Europe
      • By Drug Class
      • By Formulation
      • By Animal Species
      • By Sales Channel
    • Market Attractiveness Analysis
      • By Country
      • By Drug Class
      • By Formulation
      • By Animal Species
      • By Sales Channel
    • Key Takeaways
  15. East Asia Market Analysis 2020 to 2024 and Forecast 2025 to 2035, By Country
    • Historical Market Size Value (USD Million) & Volume (units) Trend Analysis By Market Taxonomy, 2020 to 2024
    • Market Size Value (USD Million) & Volume (units) Forecast By Market Taxonomy, 2025 to 2035
      • By Country
        • China
        • Japan
        • South Korea
      • By Drug Class
      • By Formulation
      • By Animal Species
      • By Sales Channel
    • Market Attractiveness Analysis
      • By Country
      • By Drug Class
      • By Formulation
      • By Animal Species
      • By Sales Channel
    • Key Takeaways
  16. South Asia & Pacific Market Analysis 2020 to 2024 and Forecast 2025 to 2035, By Country
    • Historical Market Size Value (USD Million) & Volume (units) Trend Analysis By Market Taxonomy, 2020 to 2024
    • Market Size Value (USD Million) & Volume (units) Forecast By Market Taxonomy, 2025 to 2035
      • By Country
        • India
        • Australia & New Zealand
        • ASEAN
        • Rest of SAP
      • By Drug Class
      • By Formulation
      • By Animal Species
      • By Sales Channel
    • Market Attractiveness Analysis
      • By Country
      • By Drug Class
      • By Formulation
      • By Animal Species
      • By Sales Channel
    • Key Takeaways
  17. Middle East and Africa Market Analysis 2020 to 2024 and Forecast 2025 to 2035, By Country
    • Historical Market Size Value (USD Million) & Volume (units) Trend Analysis By Market Taxonomy, 2020 to 2024
    • Market Size Value (USD Million) & Volume (units) Forecast By Market Taxonomy, 2025 to 2035
      • By Country
        • GCC Countries
        • Northern Africa
        • South Africa
        • Turkiye
        • Rest of MEA
      • By Drug Class
      • By Formulation
      • By Animal Species
      • By Sales Channel
    • Market Attractiveness Analysis
      • By Country
      • By Drug Class
      • By Formulation
      • By Animal Species
      • By Sales Channel
    • Key Takeaways
  18. Key Countries Market Analysis
    • USA
      • Pricing Analysis
      • Market Share Analysis, 2024
        • By Drug Class
        • By Formulation
        • By Animal Species
        • By Sales Channel
    • Canada
      • Pricing Analysis
      • Market Share Analysis, 2024
        • By Drug Class
        • By Formulation
        • By Animal Species
        • By Sales Channel
    • Brazil
      • Pricing Analysis
      • Market Share Analysis, 2024
        • By Drug Class
        • By Formulation
        • By Animal Species
        • By Sales Channel
    • Mexico
      • Pricing Analysis
      • Market Share Analysis, 2024
        • By Drug Class
        • By Formulation
        • By Animal Species
        • By Sales Channel
    • Argentina
      • Pricing Analysis
      • Market Share Analysis, 2024
        • By Drug Class
        • By Formulation
        • By Animal Species
        • By Sales Channel
  19. Market Structure Analysis
    • Competition Dashboard
    • Competition Benchmarking
    • Market Share Analysis of Top Players
      • By Regional
      • By Drug Class
      • By Formulation
      • By Animal Species
      • By Sales Channel
  20. Competition Analysis
    • Competition Deep Dive
      • Merck & Co., Inc.
        • Overview
        • Product Portfolio
        • Profitability by Market Segments (Product/Age /Sales Channel/Region)
        • Sales Footprint
        • Strategy Overview
          • Marketing Strategy
          • Product Strategy
          • Channel Strategy
      • AdvaCare Pharma®
        • Overview
        • Product Portfolio
        • Profitability by Market Segments (Product/Age /Sales Channel/Region)
        • Sales Footprint
        • Strategy Overview
          • Marketing Strategy
          • Product Strategy
          • Channel Strategy
      • Virbac
        • Overview
        • Product Portfolio
        • Profitability by Market Segments (Product/Age /Sales Channel/Region)
        • Sales Footprint
        • Strategy Overview
          • Marketing Strategy
          • Product Strategy
          • Channel Strategy
      • Alivira Animal Health Limited
        • Overview
        • Product Portfolio
        • Profitability by Market Segments (Product/Age /Sales Channel/Region)
        • Sales Footprint
        • Strategy Overview
          • Marketing Strategy
          • Product Strategy
          • Channel Strategy
      • Veko
        • Overview
        • Product Portfolio
        • Profitability by Market Segments (Product/Age /Sales Channel/Region)
        • Sales Footprint
        • Strategy Overview
          • Marketing Strategy
          • Product Strategy
          • Channel Strategy
      • Vetoquinol
        • Overview
        • Product Portfolio
        • Profitability by Market Segments (Product/Age /Sales Channel/Region)
        • Sales Footprint
        • Strategy Overview
          • Marketing Strategy
          • Product Strategy
          • Channel Strategy
      • Himalaya Wellness Company
        • Overview
        • Product Portfolio
        • Profitability by Market Segments (Product/Age /Sales Channel/Region)
        • Sales Footprint
        • Strategy Overview
          • Marketing Strategy
          • Product Strategy
          • Channel Strategy
      • AHV International B.V
        • Overview
        • Product Portfolio
        • Profitability by Market Segments (Product/Age /Sales Channel/Region)
        • Sales Footprint
        • Strategy Overview
          • Marketing Strategy
          • Product Strategy
          • Channel Strategy
      • Zoetis Services LLC
        • Overview
        • Product Portfolio
        • Profitability by Market Segments (Product/Age /Sales Channel/Region)
        • Sales Footprint
        • Strategy Overview
          • Marketing Strategy
          • Product Strategy
          • Channel Strategy
      • Boehringer Ingelheim Animal Health
        • Overview
        • Product Portfolio
        • Profitability by Market Segments (Product/Age /Sales Channel/Region)
        • Sales Footprint
        • Strategy Overview
          • Marketing Strategy
          • Product Strategy
          • Channel Strategy
      • Bio-Vet
        • Overview
        • Product Portfolio
        • Profitability by Market Segments (Product/Age /Sales Channel/Region)
        • Sales Footprint
        • Strategy Overview
          • Marketing Strategy
          • Product Strategy
          • Channel Strategy
  21. Assumptions & Acronyms Used
  22. Research Methodology

List of Tables

  • Table 1: Global Market Value (USD Million) Forecast by Region, 2020 to 2035
  • Table 2: Global Market Volume (Units) Forecast by Region, 2020 to 2035
  • Table 3: Global Market Value (USD Million) Forecast by Drug Class, 2020 to 2035
  • Table 4: Global Market Volume (Units) Forecast by Drug Class, 2020 to 2035
  • Table 5: Global Market Value (USD Million) Forecast by Formulation, 2020 to 2035
  • Table 6: Global Market Volume (Units) Forecast by Formulation, 2020 to 2035
  • Table 7: Global Market Value (USD Million) Forecast by Animal Species, 2020 to 2035
  • Table 8: Global Market Volume (Units) Forecast by Animal Species, 2020 to 2035
  • Table 9: Global Market Value (USD Million) Forecast by Sales Channel, 2020 to 2035
  • Table 10: Global Market Volume (Units) Forecast by Sales Channel, 2020 to 2035
  • Table 11: North America Market Value (USD Million) Forecast by Country, 2020 to 2035
  • Table 12: North America Market Volume (Units) Forecast by Country, 2020 to 2035
  • Table 13: North America Market Value (USD Million) Forecast by Drug Class, 2020 to 2035
  • Table 14: North America Market Volume (Units) Forecast by Drug Class, 2020 to 2035
  • Table 15: North America Market Value (USD Million) Forecast by Formulation, 2020 to 2035
  • Table 16: North America Market Volume (Units) Forecast by Formulation, 2020 to 2035
  • Table 17: North America Market Value (USD Million) Forecast by Animal Species, 2020 to 2035
  • Table 18: North America Market Volume (Units) Forecast by Animal Species, 2020 to 2035
  • Table 19: North America Market Value (USD Million) Forecast by Sales Channel, 2020 to 2035
  • Table 20: North America Market Volume (Units) Forecast by Sales Channel, 2020 to 2035
  • Table 21: Latin America Market Value (USD Million) Forecast by Country, 2020 to 2035
  • Table 22: Latin America Market Volume (Units) Forecast by Country, 2020 to 2035
  • Table 23: Latin America Market Value (USD Million) Forecast by Drug Class, 2020 to 2035
  • Table 24: Latin America Market Volume (Units) Forecast by Drug Class, 2020 to 2035
  • Table 25: Latin America Market Value (USD Million) Forecast by Formulation, 2020 to 2035
  • Table 26: Latin America Market Volume (Units) Forecast by Formulation, 2020 to 2035
  • Table 27: Latin America Market Value (USD Million) Forecast by Animal Species, 2020 to 2035
  • Table 28: Latin America Market Volume (Units) Forecast by Animal Species, 2020 to 2035
  • Table 29: Latin America Market Value (USD Million) Forecast by Sales Channel, 2020 to 2035
  • Table 30: Latin America Market Volume (Units) Forecast by Sales Channel, 2020 to 2035
  • Table 31: Western Europe Market Value (USD Million) Forecast by Country, 2020 to 2035
  • Table 32: Western Europe Market Volume (Units) Forecast by Country, 2020 to 2035
  • Table 33: Western Europe Market Value (USD Million) Forecast by Drug Class, 2020 to 2035
  • Table 34: Western Europe Market Volume (Units) Forecast by Drug Class, 2020 to 2035
  • Table 35: Western Europe Market Value (USD Million) Forecast by Formulation, 2020 to 2035
  • Table 36: Western Europe Market Volume (Units) Forecast by Formulation, 2020 to 2035
  • Table 37: Western Europe Market Value (USD Million) Forecast by Animal Species, 2020 to 2035
  • Table 38: Western Europe Market Volume (Units) Forecast by Animal Species, 2020 to 2035
  • Table 39: Western Europe Market Value (USD Million) Forecast by Sales Channel, 2020 to 2035
  • Table 40: Western Europe Market Volume (Units) Forecast by Sales Channel, 2020 to 2035
  • Table 41: Eastern Europe Market Value (USD Million) Forecast by Country, 2020 to 2035
  • Table 42: Eastern Europe Market Volume (Units) Forecast by Country, 2020 to 2035
  • Table 43: Eastern Europe Market Value (USD Million) Forecast by Drug Class, 2020 to 2035
  • Table 44: Eastern Europe Market Volume (Units) Forecast by Drug Class, 2020 to 2035
  • Table 45: Eastern Europe Market Value (USD Million) Forecast by Formulation, 2020 to 2035
  • Table 46: Eastern Europe Market Volume (Units) Forecast by Formulation, 2020 to 2035
  • Table 47: Eastern Europe Market Value (USD Million) Forecast by Animal Species, 2020 to 2035
  • Table 48: Eastern Europe Market Volume (Units) Forecast by Animal Species, 2020 to 2035
  • Table 49: Eastern Europe Market Value (USD Million) Forecast by Sales Channel, 2020 to 2035
  • Table 50: Eastern Europe Market Volume (Units) Forecast by Sales Channel, 2020 to 2035
  • Table 51: East Asia Market Value (USD Million) Forecast by Country, 2020 to 2035
  • Table 52: East Asia Market Volume (Units) Forecast by Country, 2020 to 2035
  • Table 53: East Asia Market Value (USD Million) Forecast by Drug Class, 2020 to 2035
  • Table 54: East Asia Market Volume (Units) Forecast by Drug Class, 2020 to 2035
  • Table 55: East Asia Market Value (USD Million) Forecast by Formulation, 2020 to 2035
  • Table 56: East Asia Market Volume (Units) Forecast by Formulation, 2020 to 2035
  • Table 57: East Asia Market Value (USD Million) Forecast by Animal Species, 2020 to 2035
  • Table 58: East Asia Market Volume (Units) Forecast by Animal Species, 2020 to 2035
  • Table 59: East Asia Market Value (USD Million) Forecast by Sales Channel, 2020 to 2035
  • Table 60: East Asia Market Volume (Units) Forecast by Sales Channel, 2020 to 2035
  • Table 61: South Asia & Pacific Market Value (USD Million) Forecast by Country, 2020 to 2035
  • Table 62: South Asia & Pacific Market Volume (Units) Forecast by Country, 2020 to 2035
  • Table 63: South Asia & Pacific Market Value (USD Million) Forecast by Drug Class, 2020 to 2035
  • Table 64: South Asia & Pacific Market Volume (Units) Forecast by Drug Class, 2020 to 2035
  • Table 65: South Asia & Pacific Market Value (USD Million) Forecast by Formulation, 2020 to 2035
  • Table 66: South Asia & Pacific Market Volume (Units) Forecast by Formulation, 2020 to 2035
  • Table 67: South Asia & Pacific Market Value (USD Million) Forecast by Animal Species, 2020 to 2035
  • Table 68: South Asia & Pacific Market Volume (Units) Forecast by Animal Species, 2020 to 2035
  • Table 69: South Asia & Pacific Market Value (USD Million) Forecast by Sales Channel, 2020 to 2035
  • Table 70: South Asia & Pacific Market Volume (Units) Forecast by Sales Channel, 2020 to 2035
  • Table 71: Middle East and Africa Market Value (USD Million) Forecast by Country, 2020 to 2035
  • Table 72: Middle East and Africa Market Volume (Units) Forecast by Country, 2020 to 2035
  • Table 73: Middle East and Africa Market Value (USD Million) Forecast by Drug Class, 2020 to 2035
  • Table 74: Middle East and Africa Market Volume (Units) Forecast by Drug Class, 2020 to 2035
  • Table 75: Middle East and Africa Market Value (USD Million) Forecast by Formulation, 2020 to 2035
  • Table 76: Middle East and Africa Market Volume (Units) Forecast by Formulation, 2020 to 2035
  • Table 77: Middle East and Africa Market Value (USD Million) Forecast by Animal Species, 2020 to 2035
  • Table 78: Middle East and Africa Market Volume (Units) Forecast by Animal Species, 2020 to 2035
  • Table 79: Middle East and Africa Market Value (USD Million) Forecast by Sales Channel, 2020 to 2035
  • Table 80: Middle East and Africa Market Volume (Units) Forecast by Sales Channel, 2020 to 2035

List of Figures

  • Figure 1: Global Market Volume (Units) Forecast 2020 to 2035
  • Figure 2: Global Market Pricing Analysis
  • Figure 3: Global Market Value (USD Million) Forecast 2020 to 2035
  • Figure 4: Global Market Value Share and BPS Analysis by Drug Class, 2025 and 2035
  • Figure 5: Global Market Y-o-Y Growth Comparison by Drug Class, 2025 to 2035
  • Figure 6: Global Market Attractiveness Analysis by Drug Class
  • Figure 7: Global Market Value Share and BPS Analysis by Formulation, 2025 and 2035
  • Figure 8: Global Market Y-o-Y Growth Comparison by Formulation, 2025 to 2035
  • Figure 9: Global Market Attractiveness Analysis by Formulation
  • Figure 10: Global Market Value Share and BPS Analysis by Animal Species, 2025 and 2035
  • Figure 11: Global Market Y-o-Y Growth Comparison by Animal Species, 2025 to 2035
  • Figure 12: Global Market Attractiveness Analysis by Animal Species
  • Figure 13: Global Market Value Share and BPS Analysis by Sales Channel, 2025 and 2035
  • Figure 14: Global Market Y-o-Y Growth Comparison by Sales Channel, 2025 to 2035
  • Figure 15: Global Market Attractiveness Analysis by Sales Channel
  • Figure 16: Global Market Value (USD Million) Share and BPS Analysis by Region, 2025 and 2035
  • Figure 17: Global Market Y-o-Y Growth Comparison by Region, 2025 to 2035
  • Figure 18: Global Market Attractiveness Analysis by Region
  • Figure 19: North America Market Incremental $ Opportunity, 2025 to 2035
  • Figure 20: Latin America Market Incremental $ Opportunity, 2025 to 2035
  • Figure 21: Western Europe Market Incremental $ Opportunity, 2025 to 2035
  • Figure 22: Eastern Europe Market Incremental $ Opportunity, 2025 to 2035
  • Figure 23: East Asia Market Incremental $ Opportunity, 2025 to 2035
  • Figure 24: South Asia & Pacific Market Incremental $ Opportunity, 2025 to 2035
  • Figure 25: Middle East and Africa Market Incremental $ Opportunity, 2025 to 2035
  • Figure 26: North America Market Value Share and BPS Analysis by Country, 2025 and 2035
  • Figure 27: North America Market Value Share and BPS Analysis by Drug Class, 2025 and 2035
  • Figure 28: North America Market Y-o-Y Growth Comparison by Drug Class, 2025 to 2035
  • Figure 29: North America Market Attractiveness Analysis by Drug Class
  • Figure 30: North America Market Value Share and BPS Analysis by Formulation, 2025 and 2035
  • Figure 31: North America Market Y-o-Y Growth Comparison by Formulation, 2025 to 2035
  • Figure 32: North America Market Attractiveness Analysis by Formulation
  • Figure 33: North America Market Value Share and BPS Analysis by Animal Species, 2025 and 2035
  • Figure 34: North America Market Y-o-Y Growth Comparison by Animal Species, 2025 to 2035
  • Figure 35: North America Market Attractiveness Analysis by Animal Species
  • Figure 36: North America Market Value Share and BPS Analysis by Sales Channel, 2025 and 2035
  • Figure 37: North America Market Y-o-Y Growth Comparison by Sales Channel, 2025 to 2035
  • Figure 38: North America Market Attractiveness Analysis by Sales Channel
  • Figure 39: Latin America Market Value Share and BPS Analysis by Country, 2025 and 2035
  • Figure 40: Latin America Market Value Share and BPS Analysis by Drug Class, 2025 and 2035
  • Figure 41: Latin America Market Y-o-Y Growth Comparison by Drug Class, 2025 to 2035
  • Figure 42: Latin America Market Attractiveness Analysis by Drug Class
  • Figure 43: Latin America Market Value Share and BPS Analysis by Formulation, 2025 and 2035
  • Figure 44: Latin America Market Y-o-Y Growth Comparison by Formulation, 2025 to 2035
  • Figure 45: Latin America Market Attractiveness Analysis by Formulation
  • Figure 46: Latin America Market Value Share and BPS Analysis by Animal Species, 2025 and 2035
  • Figure 47: Latin America Market Y-o-Y Growth Comparison by Animal Species, 2025 to 2035
  • Figure 48: Latin America Market Attractiveness Analysis by Animal Species
  • Figure 49: Latin America Market Value Share and BPS Analysis by Sales Channel, 2025 and 2035
  • Figure 50: Latin America Market Y-o-Y Growth Comparison by Sales Channel, 2025 to 2035
  • Figure 51: Latin America Market Attractiveness Analysis by Sales Channel
  • Figure 52: Western Europe Market Value Share and BPS Analysis by Country, 2025 and 2035
  • Figure 53: Western Europe Market Value Share and BPS Analysis by Drug Class, 2025 and 2035
  • Figure 54: Western Europe Market Y-o-Y Growth Comparison by Drug Class, 2025 to 2035
  • Figure 55: Western Europe Market Attractiveness Analysis by Drug Class
  • Figure 56: Western Europe Market Value Share and BPS Analysis by Formulation, 2025 and 2035
  • Figure 57: Western Europe Market Y-o-Y Growth Comparison by Formulation, 2025 to 2035
  • Figure 58: Western Europe Market Attractiveness Analysis by Formulation
  • Figure 59: Western Europe Market Value Share and BPS Analysis by Animal Species, 2025 and 2035
  • Figure 60: Western Europe Market Y-o-Y Growth Comparison by Animal Species, 2025 to 2035
  • Figure 61: Western Europe Market Attractiveness Analysis by Animal Species
  • Figure 62: Western Europe Market Value Share and BPS Analysis by Sales Channel, 2025 and 2035
  • Figure 63: Western Europe Market Y-o-Y Growth Comparison by Sales Channel, 2025 to 2035
  • Figure 64: Western Europe Market Attractiveness Analysis by Sales Channel
  • Figure 65: Eastern Europe Market Value Share and BPS Analysis by Country, 2025 and 2035
  • Figure 66: Eastern Europe Market Value Share and BPS Analysis by Drug Class, 2025 and 2035
  • Figure 67: Eastern Europe Market Y-o-Y Growth Comparison by Drug Class, 2025 to 2035
  • Figure 68: Eastern Europe Market Attractiveness Analysis by Drug Class
  • Figure 69: Eastern Europe Market Value Share and BPS Analysis by Formulation, 2025 and 2035
  • Figure 70: Eastern Europe Market Y-o-Y Growth Comparison by Formulation, 2025 to 2035
  • Figure 71: Eastern Europe Market Attractiveness Analysis by Formulation
  • Figure 72: Eastern Europe Market Value Share and BPS Analysis by Animal Species, 2025 and 2035
  • Figure 73: Eastern Europe Market Y-o-Y Growth Comparison by Animal Species, 2025 to 2035
  • Figure 74: Eastern Europe Market Attractiveness Analysis by Animal Species
  • Figure 75: Eastern Europe Market Value Share and BPS Analysis by Sales Channel, 2025 and 2035
  • Figure 76: Eastern Europe Market Y-o-Y Growth Comparison by Sales Channel, 2025 to 2035
  • Figure 77: Eastern Europe Market Attractiveness Analysis by Sales Channel
  • Figure 78: East Asia Market Value Share and BPS Analysis by Country, 2025 and 2035
  • Figure 79: East Asia Market Value Share and BPS Analysis by Drug Class, 2025 and 2035
  • Figure 80: East Asia Market Y-o-Y Growth Comparison by Drug Class, 2025 to 2035
  • Figure 81: East Asia Market Attractiveness Analysis by Drug Class
  • Figure 82: East Asia Market Value Share and BPS Analysis by Formulation, 2025 and 2035
  • Figure 83: East Asia Market Y-o-Y Growth Comparison by Formulation, 2025 to 2035
  • Figure 84: East Asia Market Attractiveness Analysis by Formulation
  • Figure 85: East Asia Market Value Share and BPS Analysis by Animal Species, 2025 and 2035
  • Figure 86: East Asia Market Y-o-Y Growth Comparison by Animal Species, 2025 to 2035
  • Figure 87: East Asia Market Attractiveness Analysis by Animal Species
  • Figure 88: East Asia Market Value Share and BPS Analysis by Sales Channel, 2025 and 2035
  • Figure 89: East Asia Market Y-o-Y Growth Comparison by Sales Channel, 2025 to 2035
  • Figure 90: East Asia Market Attractiveness Analysis by Sales Channel
  • Figure 91: South Asia & Pacific Market Value Share and BPS Analysis by Country, 2025 and 2035
  • Figure 92: South Asia & Pacific Market Value Share and BPS Analysis by Drug Class, 2025 and 2035
  • Figure 93: South Asia & Pacific Market Y-o-Y Growth Comparison by Drug Class, 2025 to 2035
  • Figure 94: South Asia & Pacific Market Attractiveness Analysis by Drug Class
  • Figure 95: South Asia & Pacific Market Value Share and BPS Analysis by Formulation, 2025 and 2035
  • Figure 96: South Asia & Pacific Market Y-o-Y Growth Comparison by Formulation, 2025 to 2035
  • Figure 97: South Asia & Pacific Market Attractiveness Analysis by Formulation
  • Figure 98: South Asia & Pacific Market Value Share and BPS Analysis by Animal Species, 2025 and 2035
  • Figure 99: South Asia & Pacific Market Y-o-Y Growth Comparison by Animal Species, 2025 to 2035
  • Figure 100: South Asia & Pacific Market Attractiveness Analysis by Animal Species
  • Figure 101: South Asia & Pacific Market Value Share and BPS Analysis by Sales Channel, 2025 and 2035
  • Figure 102: South Asia & Pacific Market Y-o-Y Growth Comparison by Sales Channel, 2025 to 2035
  • Figure 103: South Asia & Pacific Market Attractiveness Analysis by Sales Channel
  • Figure 104: Middle East and Africa Market Value Share and BPS Analysis by Country, 2025 and 2035
  • Figure 105: Middle East and Africa Market Value Share and BPS Analysis by Drug Class, 2025 and 2035
  • Figure 106: Middle East and Africa Market Y-o-Y Growth Comparison by Drug Class, 2025 to 2035
  • Figure 107: Middle East and Africa Market Attractiveness Analysis by Drug Class
  • Figure 108: Middle East and Africa Market Value Share and BPS Analysis by Formulation, 2025 and 2035
  • Figure 109: Middle East and Africa Market Y-o-Y Growth Comparison by Formulation, 2025 to 2035
  • Figure 110: Middle East and Africa Market Attractiveness Analysis by Formulation
  • Figure 111: Middle East and Africa Market Value Share and BPS Analysis by Animal Species, 2025 and 2035
  • Figure 112: Middle East and Africa Market Y-o-Y Growth Comparison by Animal Species, 2025 to 2035
  • Figure 113: Middle East and Africa Market Attractiveness Analysis by Animal Species
  • Figure 114: Middle East and Africa Market Value Share and BPS Analysis by Sales Channel, 2025 and 2035
  • Figure 115: Middle East and Africa Market Y-o-Y Growth Comparison by Sales Channel, 2025 to 2035
  • Figure 116: Middle East and Africa Market Attractiveness Analysis by Sales Channel
  • Figure 117: Global Market - Tier Structure Analysis
  • Figure 118: Global Market - Company Share Analysis

Frequently Asked Questions

What is the projected size of the veterinary boluses market by 2035?

The industry is expected to reach USD 5.2 billion by 2035.

What is the estimated size of the veterinary boluses market in 2025?

The industry size is projected to be USD 3.7 billion in 2025.

What is the CAGR of the veterinary boluses market from 2025 to 2035?

The industry is expected to grow at a CAGR of 3.4% from 2025 to 2035.

Which country is the fastest-growing in the veterinary boluses market?

China is expected to be the fastest-growing with a CAGR of 5.4%.

Which segment leads the veterinary boluses market for animal species?

Farm animal, accounting for over 63.5% of the industry in 2025.

Explore Similar Insights

Future Market Insights

Veterinary Boluses Market