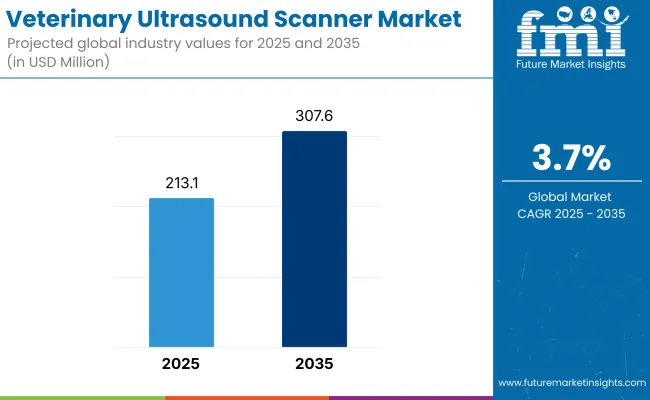
The veterinary ultrasound scanner market is expected to reach USD 213.1 million by 2025 and is expected to steadily grow at a CAGR of 3.7% to reach USD 307.6 million by 2035. In 2024, cluster headache syndrome generated roughly USD 37,309.9 million in revenues.
Veterinary ultrasound scanners are non-invasive diagnostic tools used by veterinarians to view animals’ internal structures. These devices use high-frequency sound waves to generate real-time images of organs, tissues and blood flow in the body and help doctors diagnose diseases in the heart, liver, kidneys, and reproductive system.
There are several important drivers for the demand for veterinary ultrasound scanners. The growing pet population and growing expenditures in animal healthcare are augmenting the demand for advanced diagnostic solutions.
Pet owners actively care for their pets' health. Hence, they pursue early diagnostics, and this is one of the factors fostering the adoption of ultrasound technology in veterinary clinics and hospitals. Furthermore, the increasing number of varieties of livestock and equine care has raised the need for efficient diagnostic tools affecting the health and productivity of animals.
Ultrasound scanners have become more portable, cheaper, and user-friendly thanks to technological advancements, and thus more universally accessible to veterinarians. By their nature, wireless and handheld ultrasound machines have complemented portability, allowing for imaging in situ of farm animals and wildlife. In addition, the rising incidence of chronic diseases, including cardiac diseases and tumors in animals, has created a demand for reliable imaging solutions.
Key Market Metrics
Metric | Value |
---|---|
Industry Size (2025E) | USD 213.1 million |
Industry Value (2035F) | USD 307.6 million |
CAGR (2025 to 2035) | 3.7% |
The veterinary ultrasound scanner industry has grown steadily from 2020 to 2024 at a compound annual growth rate (CAGR), driven by advancements in animal healthcare and rising emphasis on early disease detection.
In 2020, an initial decline in demand for veterinary imaging equipment as a result of the COVID-19 pandemic was witnessed, and the demand for veterinary imaging devices and veterinary ultrasound scanners was negatively affected by restrictions on veterinary visits and disruptions in supply chains. As veterinary services adjusted to the new protocols, however, demand for diagnostic imaging surged back.
The growing trend of pet ownership, especially in metropolitan cities, contributed significantly to the adoption of ultrasound scanners. Enhancing pet diagnostics became a focal point, attracting the application of sophisticated technology for early disease discovery and pregnancy status monitoring. The use of ultrasound for both reproductive management and general health assessments in livestock and equine care also grew, aiding in market growth.
North America is the dominant market for veterinary ultrasound scanners owing to the presence of a well-established veterinary healthcare infrastructure and a high inclination towards advanced diagnostic solutions. High pet ownership, pet parents who value proactive care, and early disease detection. The increasing consciousness regarding animal health, coupled with an increase in spending on veterinary services, has played a pivotal role in the adoption of ultrasound in clinics and hospitals on a wider scale.
Livestock, like companion animals, is also a significant contributor to the growing demand for ultrasound scanners. The need for efficient reproductive management, early disease detection, and monitoring of herd health is paramount for commercial livestock farms, which has led to an increased adoption of advanced imaging technologies as well.
Technological innovations and portable or wireless ultrasound devices have made it easier for veterinarians to provide on-site diagnostics. In addition, the presence of major industry participants, continuous technological advancements, and a strong regulatory framework have also bolstered the landscape. North America continues to lead in veterinary imaging innovations, thanks to increasing investments in research and development.
Europe occupies the second-largest market in the veterinary ultrasound scanner market, credited to an organized veterinary healthcare system in the region, along with assured regulatory standards. Increasing focus on animal welfare and the strict regulations associated with livestock management have further driven the uptake of quality diagnostic tools, such as ultrasound imaging.
Veterinary healthcare continues to improve, and owners are more prone to exercise preventive diagnostic techniques. ultrasound imaging is becoming a standard procedure in veterinary practices to provide. The field of companion animal care is progressing rapidly, with pet owners more interested than ever before in preventive diagnostics.
There is an increasing integration of ultrasound imaging into veterinary practices, making it helpful in the early diagnosis of conditions like tumors, organ abnormalities, and reproductive health problems. Moreover, the strong agricultural industry in Europe has increased the adoption of ultrasound scanners forthe management of livestock.
Imaging solutions that farmers and veterinary professionals are using are of huge use to enhance the breeding programs of farms and also help monitor herd health, thereby improving productivity as well as disease control measures.
The veterinary ultrasound scanner market is also growing rapidly in Asia Pacific, owing to a rise in pet ownership, an increase in the awareness of animal health, and greater demand for livestock healthcare-based solutions. The rise in urbanization, changes in lifestyles, and emerging middle-class populations in some countries have led to an increase in the adoption of pets. As pet owners are, by and large, ready to pay for high-end veterinary diagnostics, the adoption of ultrasound imaging has accelerated.
Livestock farming continues to be an important driver for the growth of imaging solutions in this region. The need to maximize breeding efficiency and overall livestock health is driving the adoption of ultrasound scanners in countries with robust agricultural economies. Furthermore, the increasing incidence of zoonotic diseases has somewhat underlined the importance of diagnostic methods which that can detect diseases at an early stage and with precision, which is another major factor driving the ultrasound market.
Growth in Asia Pacific can also be attributed to the growing presence of domestic and international manufacturers that offer affordable ultrasound devices. Portable and handheld ultrasound scanners are becoming established to allow access to diagnostics by veterinarians in field settings or rural areas. Governments and veterinary associations are working on enhancing veterinary healthcare services, which will support long-term growth.
High Initial Investment and Maintenance Costs Associated with Advanced Ultrasound Scanners Could be the Key Barrier in the Veterinary Ultrasound Scanner Market
High initial investment & maintenance costs of advanced ultrasound scanners are one of the major challenges faced. Portable and handheld units have lower prices, but high-end machines and resulting imaging capabilities are still costly. For many small and independent veterinary clinics, budget constraints make this approach difficult to adopt. Access to funding & financial support is less in developing regions, and the cost factor impacts veterinary practices there as well.
The other major challenge is the deficit of trained manpower in ultrasound imaging. In human healthcare, radiology is a trained field, but many veterinarians are left to their own devices when it comes to using imaging machines. In certain areas, where formal training programs do not exist, this can result in variability in the accuracy of diagnosis as well as suboptimal use of ultrasound technology.
This poses a direct challenge to the efficacy of veterinary imaging and limits its availability for application across the board.
Moreover, there are differences in regulatory requirements and compliance across regions, which make device approval and distribution more complex. This is especially true in countries with strict import regulations or burdensome certification processes, which can delay the introduction of state-of-the-art ultrasound scanners to the industry.
Technological limitations constitute another barrier with regard to some ultrasound devices, especially low-cost models. Imaging resolution that is not consistent, a limited probe in your hand, and poor compatibility with other diagnostic tools all lead to less effective veterinary diagnostics.
This results in reluctance among Veterinary professionals to adopt new ultrasound solutions. Also, to make it possible will require greater investment into training, affordability, better streamlining of regulation, as well as continued improvement of imaging technology, all of which can expand access to better veterinary diagnostics.
Advancement in Battery-powered and Ultra-Portable Ultrasound Scanners Creating Opportunity for the Market
Innovation and accessibility evolution in the veterinary ultrasound scanner industry. One major opportunity is in the development of AI-supported imaging interpretation.” Ultrasound images are complex, and many veterinarians have difficulty diagnosing conditions. Combining smart imaging software that offers rapid review and automated outlier detection, weaves ultrasound technology into the everyday practice of veterinarians with differing experience levels, ultimately improving diagnostic accuracy and workflow efficiency.
An added area of great opportunity is the growing need for multi-species ultrasound solutions. Ultrasound technology is well-established in small animal and livestock care, but interest is growing in its applications for exotic animals, marine life, and wildlife conservation. Custom approaches will allow for scanners with specialized probes and additional imaging abilities for wildlife, along with pets and livestock, as far as veterinary diagnostics extends.
The development of battery-operated nail tip forms and portable ultrasound scanners is also providing new options, particularly for field veterinarians and those working in more remote locations. Classically trained mobile ultrasound solution for on-site diagnostics is very useful for regions without fully equipped veterinary facilities. These compact, rugged, and wireless devices improve veterinary outreach programs and emergency treatment of large and mobile animals.
Plus, the integration of telemedicine in the veterinary diagnostic process is changing how ultrasound technology is used. Vet specialists who tackle ultrasound images are further away from them; for vet professionals, the need for human contact is still an aspect, as they help to diagnose the actual issues for their patients (animals) as well. These are international innovations that position ultrasound technology as a particularly valuable tool in the future of veterinary care.
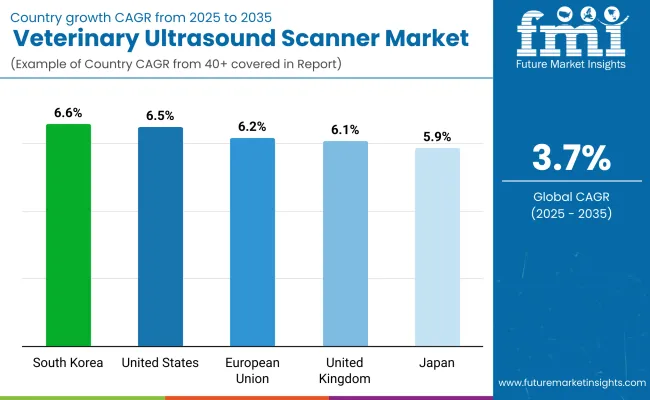
In a span of four years, from 2020 to 2024, the veterinary ultrasound scanner category was transformed by the changing landscape of veterinary medicine, advances in technology, and priorities of the animal healthcare division. This was a time when focus has shifted towards the noninvasive diagnostic techniques, thus ultrasound scanners were becoming more popular in veterinary clinics and hospitals.
Veterinarians demonstrated a consistent shift away from conventional diagnostic approaches and gravitated towards real-time imaging solutions to increase accuracy. Surface-friendly, affordable ultrasound machines gained popularity and became a standard in medical diagnostics in veterinary medicine. The growing number of veterinary practitioners skilled in ultrasound interpretation also aided in its accepted incorporation into routine examinations.
As we look from 2025 through 2035, industry will further evolve in response to innovation and veterinarian need. One of the great trends will be the increasing integration of hybrid imaging technologies, where ultrasound devices can play a complementary role in other diagnostic tools like digital radiography and computed tomography; This will help refine diagnostics and increase the accuracy of detection of such complex diseases.
The need for more automated and customizable ultrasound systems will increase, allowing veterinarians to customize imaging settings based on the exact species and anatomical needs. In addition, advances in materials and sensors will enable more powerful and higher resolution imaging systems that can be used for the requirements of small animals as well as large livestock.
In next 10 years, the veterinary ultrasound market will see its growth driven by the ongoing emphasis on enhancing accessibility and initiating applications in specialized veterinary fields.
Category | 2020 to 2024 Trends |
---|---|
Regulatory Landscape | Regulations on quality requirements and compliance, with progressive implementation of digital documentation. |
Technological Advancements | Increased availability of portable and wireless ultrasound devices enhances convenience in veterinary services. |
Consumer Demand | Greater use of non-invasive diagnostic equipment is due to increasing pet ownership and livestock management demands. |
Market Growth Drivers | Driven adoption due to burgeoning veterinary consultations, growing insurance cover for pets, and a drive for the detection of diseases early on. |
Sustainability | Limited attention for sustainability with existing manufacturing techniques yet to take a backseat. |
Supply Chain Dynamics | Supply chain disruptions by international events, resulting in varying availability of equipment and price. |
Category | 2025 to 2035 Projections |
---|---|
Regulatory Landscape | Stricter regulatory environments for device safety, interoperability, and international compliance. |
Technological Advancements | Use of AI-based imaging and hybrid diagnostic equipment to enhance precision and speed. |
Consumer Demand | There is a growing need for highly specific and customized ultrasound solutions to accommodate varied veterinary demands. |
Market Growth Drivers | Acceleration boosted by widening reach of veterinary telemedicine, product innovation, and increased usage across rural belts. |
Sustainability | Increased movement toward more sustainable materials and energy-saving products to drive synergy with sustainability ideals. |
Supply Chain Dynamics | Additional regional production centers are needed to mitigate reliance on international supply chains and ensure consistent availability. |
Market Outlook
The veterinary ultrasound scanner market in the United States is growing due to a well-established veterinary healthcare system and high spending on pet wellness. One of the key growth-driving factors is the increasing number of specialty veterinary hospitals and referral centers.
These centers have the latest imaging technology, from high-resolution ultrasound scanners capable of accurate diagnosis, to complex medical solutions; Meanwhile, advances in ultrasound technology, as well as the increased availability of veterinary insurance that covers the costs of many diagnostic procedures, have made it easier (and less costly) for pet owners to opt for more advanced diagnostics, and ultrasound has become both a routine and emergency diagnostic tool.
Moreover, the presence of key players in the imaging technology space provides a continuous flow of product innovations, helping the veterinary ultrasound solutions to be more widely adopted, ultimately making a difference in terms of accessibility and efficiency.
Market Growth Factors
Market Forecast
Country | CAGR (2025 to 2035) |
---|---|
United States | 2.2% |
Market Outlook
Germany’s veterinary ultrasound market is booming due to the country’s focus on precision diagnostics and high standards of animal care. The sound veterinary education system guarantees that specialists are trained in modern methods of diagnosis, which in turn is followed by a wider use of ultrasound imaging in everyday life.
Germany’s livestock sector is also well-trained on ultrasound technologies, which are able to help herds ensure managed health and breeding programs. The evolution and accessibility of state-of-the-art ultrasound equipment are also facilitated by regulatory environments encouraging innovation in veterinary medical devices.
The veterinary imaging field continues to grow with advancements that enhance diagnostic accuracy, thanks to the country’s focus on research in the area of animal healthcare.
Market Growth Factors
Market Forecast
Country | CAGR (2025 to 2035) |
---|---|
Germany | 2.0% |
Market Outlook
Trends in Veterinary Ultrasound in the United Kingdom Markets in October 2023. The veterinary ultrasound market in the United Kingdom is growing modestly, with the increasing demand for specialized care of companion animals as the primary growth driver. Increased interest in preventive diagnostics due to increased interest in pet wellness programs has made ultrasound another integral tool to be used to identify disease at an early stage.
In addition, there is an increasing number of mobile veterinary services that appeal to pet owners who want at-home diagnostics, thus driving the growth of portable ultrasound devices. The shift toward multidisciplinary veterinary care, which uses multiple diagnostic approaches in conjunction with one another, has also accelerated the use of ultrasound scanners in both urban and rural veterinary practices.
Market Growth Drivers
Market Forecast
Country | CAGR (2025 to 2035) |
---|---|
United Kingdom | 2.6% |
Market Outlook
China’s veterinary ultrasound scanner industry is thriving, thanks to a burgeoning livestock and pet healthcare market. Ultrasound is increasingly used for reproductive management and disease prevention on modern large-scale livestock farms. Moreover, the increase of the middle-class population has led to a pet owning boom with more emphasis on veterinary healthcare services.
These ultrasound scanners are cost-efficient, providing a boost to the manufacturing of technological innovations in China, and hence, offer such equipment at a more affordable price to veterinarians in the respective countries. In addition, ultrasound imaging is now widely taught in veterinary schools, and there is a growing number of animal clinics, only further adding to the increased accessibility of ultrasound equipment.
Market Growth Drivers
Market Forecast
Country | CAGR (2025 to 2035) |
---|---|
China | 5.8% |
Market Outlook
The increasing demand for veterinary services in rural and urban areas is driving growth for India’s veterinary ultrasound market. The relatively innovations in imaging farm and ranch animals have found a new home in government - or federally led - livestock healthcare initiatives. Portable ultrasound scanners are becoming increasingly popular, allowing vets to perform field diagnostics, especially in less accessible areas with low animal treatment facilities.
In addition, the rise in the number of veterinary colleges and training programs emphasizing modern imaging motivated the awareness and adoption of ultrasound technology. Further, as the dairy and poultry farming across the country is being organized; the need for efficient diagnostic tools has increased, especially across the veterinary ultrasound solutions landscape in the country.
Market Growth Factors
Market Forecast
Country | CAGR (2025 to 2035) |
---|---|
India | 6.3% |
Portable/Handheld Ultrasound Scanners - Flexibility and Field Usability Driving High Adoption
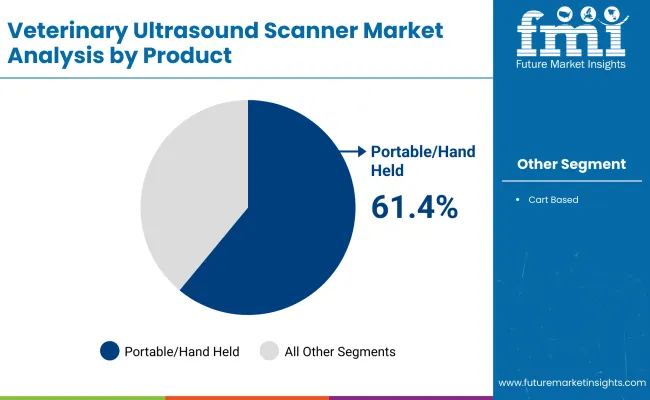
Mobile veterinary services and on-site diagnostics have become crucial, and portable and handheld ultrasound scanners are the preferred option for veterinarians. Such devices provide the versatility necessary when performing examinations on-site in clinics, farms, and other remote areas without needing complex setups. Lightweight and battery-powered, veterinarians can produce imaging in real-time for livestock, equine and companion animals - even delivering essential imaging in acute, emergency settings.
They have also become popular due to an increasing demand for home-based care, allowing for easy diagnostics without having to transport the pet. Furthermore, wireless technology and cloud-based data storage have increased the efficiency of portable imaging, enabling veterinarians to access and analyze imaging results more accurately.
The trend towards portable devices can be attributed to their providing cost-effective and time-efficient diagnostic solutions, which remain a necessity and hence a recurring trend in urban as well as rural veterinary practice, ensuring the dominance of these devices on the veterinary ultrasound market.
Cart-Based Ultrasound Scanners - High Imaging Precision for Specialized Veterinary Applications
Due to the advanced imaging quality and extensive diagnostic capabilities, cart-based ultrasound scanners still represent a solid share. These systems are used by veterinary hospitals, specialty vet clinics and research institutions that need detailed images and advanced diagnostics. With the ability to offer multiple probe options and greater imaging resolution, they are especially practical in complex settings, including cardiac assessments, tumor evaluations, and musculoskeletal examinations.
Large veterinary practices use these scanners for detailed diagnostics with high precision for treatment. Specifically, they are critical for veterinarians managing acute cases because of their ability to accommodate a variety of imaging modalities, notably Doppler and contrast-enhanced ultrasound.
While not as mobile as handheld types, their integration with sophisticated software and AI-based imaging analysis increases diagnostic accuracy. Increasing demand for advanced veterinary medicine and high-quality imaging in more complex cases contributes to the continued significance of cart-based ultrasound scanners in veterinary diagnostics.
Digital Imaging Technology - Enhanced Image Clarity and Integration with Advanced Diagnostic Tools
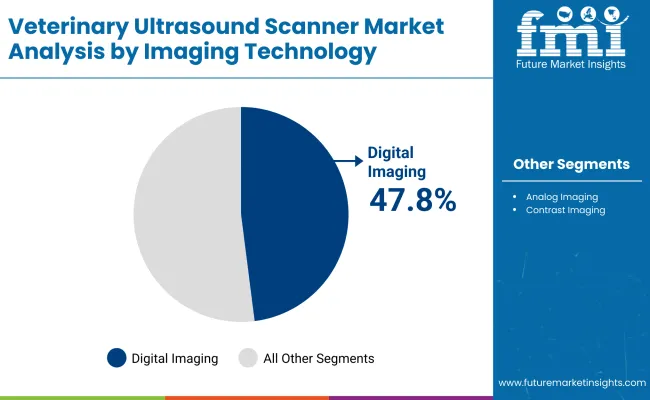
Digital imaging technology has proven popular because of its higher image resolution and connections with new veterinary diagnostic systems. With the transition of imaging to high-definition, veterinarians can detect abnormalities at early stages, which aids treatment. “With the new digital ultrasound scanners, images are clearer and in real-time, allowing professionals to do a more accurate assessment of what’s going on internally, including organs, blood vessels, and reproductive systems.
Moreover, digital imaging is increasingly compatible with cloud storage and telemedicine platforms, facilitating remote consultations and specialist second opinions. Moreover, the integration of artificial intelligence in digital imaging improves workflow efficiency through automated measurements and image optimization.
Advances in digital technology provide the opportunity to acquire, store, and retrieve quality images not only for future analysis but also for comparisons with earlier cases, making digital technology an indispensable adjunct to modern veterinary practice. With an increasing demand for more accurate, data-driven diagnostics, Digital Imaging remains the preferred choice for veterinary ultrasound applications.
Analog Imaging Technology - Cost-Effective Solution for Routine Veterinary Diagnostics
Analog imaging technology still holds a considerable market share as it is low-cost and an established diagnostic imaging tool suited for basic veterinary applications. Analog ultrasound systems and devices remain some of the most popular devices used in veterinary practices, especially in developing economies and rural areas, due to their affordability and ease of use.
They offer enough imaging for routine examinations such as pregnancy detection, general abdominal imaging, and musculoskeletal scanning in livestock. Analog ultrasound devices offer practical solutions for veterinarians requiring simple diagnostic tools, as they do not need complex software integrations or cloud-based data management, unlike their digital counterparts.
More importantly, their irreducible maintenance costs and near-zero dependency on outside compute systems make them a realistic possibility for small vet clinics and mobile vet services. Analog ultrasound technology's affordability and demand for the technology have been further increased in countries or areas where veterinary access to top-of-the-range equipment is limited.
The industry is now experiencing an influx of novel veterinary ultrasound scanner manufacturers, who are emerging not just as competitors but are also joining together with established manufacturers to contribute jointly to the market with new, competent technology. This continues to drive innovation within small, high-resolution, and AI-integrated programming ultrasound devices, which make important diagnostic observations and use cases more available and visible to everyday users.
The response is always highly experimental, and investments are only expected to grow both for wireless imaging solutions and cloud-based data integration. Price is a significant factor, especially in price-sensitive markets. Moreover, increased demand for specific imaging machinery for various animal species is leading to creativity in design space, ever-increasing competition among manufacturers, and being able to address the large demand with specific product forms.
Market Share Analysis by Company
Company Name | Estimated Market Share (%) |
---|---|
Mindray Medical International Limited | (16-17)% |
General Electric Company | (12-13)% |
Fujifilm Holdings Corporation | (11-12)% |
Canon Inc. | (9-10)% |
Other Companies (combined) | (44-46)% |
Company Name | Key Company Offerings and Activities |
---|---|
Mindray Medical International Limited (2025) | Mindray highlights the advanced and portable veterinary ultrasound scanners that can be integrated with AI to provide patients faster, more reliable diagnostics. The company invests in R&D to grow its imaging capabilities to augment small and large animal care. |
General Electric Company (2024) | GE Healthcare manufactures high-resolution ultrasound platforms that are suitable for use in both routine as well as complex veterinary imaging. Focusing on workflow efficiency and new probe technology to enable fast and accurate diagnostics. |
Fujifilm Holdings Corporation (2024) | Fujifilmora kahitom dvd sutu чистть : Fujifilm. Using digital imaging expertise, the company enhances visualization with an increased level of diagnostic confidence for the animal health industry. |
Canon Inc. (2024) | Canon is known for its high-performance ultrasound scanners and top-tier Doppler imaging for vascular studies in animals. The company's designs are key to enhancing veterinary workflow with an emphasis on ergonomics and an easy user interface. |
Key Company Insights
Mindray Medical International Limited(16-17%)
Mindray seeks to expand its global presence by creating subsidiaries or adding distribution networks in key countries. The firm highlights local alliances as a lever to boost market penetration and customer service.
General Electric Company.(12-13%)
GE is the world's only IIoT company leveraging a software-defined approach to ultrasound. This approach improves connectivity and adds data analytics capabilities, offering integrated solutions to veterinary practitioners.
Fujifilm Holdings Corporation(11-12%)
Fujifilm also believes in sustainability and produces environmentally friendly ultrasound devices. Investing money into energy-efficient technologies and sustainable manufacturing processes is part of what the company does to reduce environmental impact.
Canon inc.(9-10%)
Canon's strategy involves leveraging synergies between its imaging and medical divisions to innovate veterinary ultrasound technology. The company focuses on cross-functional research and development to introduce unique features in its products.
Other Key Players (44-46% Combined)
A number of other companies are major contributors to the veterinary ultrasound scanner market through innovative technologies and increased distribution networks. They include:
With the demand for dialysis growing unabated, firms are focusing on expansion, accelerating research and development activities, regulatory clearances, and strategic partnerships to reinforce their market positions and enhance surgical outcomes.
Portable/Hand Held Ultrasound Scanners and Cart Based Ultrasound Scanners
Digital Imaging Technology, Analog Imaging Technology and Contrast Imaging Technology
In-center Dialysis, Hospitals, Independent Dialysis Centers and Home Dialysis
North America, Latin America, Western Europe, Eastern Europe, East Asia, South Asia & Pacific, Middle East & Africa
Table 1: Global Market Value (US$ Million) Forecast by Region, 2019 to 2034
Table 2: Global Market Volume (Units) Forecast by Region, 2019 to 2034
Table 3: Global Market Value (US$ Million) Forecast by Product Type, 2019 to 2034
Table 4: Global Market Volume (Units) Forecast by Product Type, 2019 to 2034
Table 5: Global Market Value (US$ Million) Forecast by Imaging Technology, 2019 to 2034
Table 6: Global Market Volume (Units) Forecast by Imaging Technology, 2019 to 2034
Table 7: Global Market Value (US$ Million) Forecast by End User, 2019 to 2034
Table 8: Global Market Volume (Units) Forecast by End User, 2019 to 2034
Table 9: North America Market Value (US$ Million) Forecast by Country, 2019 to 2034
Table 10: North America Market Volume (Units) Forecast by Country, 2019 to 2034
Table 11: North America Market Value (US$ Million) Forecast by Product Type, 2019 to 2034
Table 12: North America Market Volume (Units) Forecast by Product Type, 2019 to 2034
Table 13: North America Market Value (US$ Million) Forecast by Imaging Technology, 2019 to 2034
Table 14: North America Market Volume (Units) Forecast by Imaging Technology, 2019 to 2034
Table 15: North America Market Value (US$ Million) Forecast by End User, 2019 to 2034
Table 16: North America Market Volume (Units) Forecast by End User, 2019 to 2034
Table 17: Latin America Market Value (US$ Million) Forecast by Country, 2019 to 2034
Table 18: Latin America Market Volume (Units) Forecast by Country, 2019 to 2034
Table 19: Latin America Market Value (US$ Million) Forecast by Product Type, 2019 to 2034
Table 20: Latin America Market Volume (Units) Forecast by Product Type, 2019 to 2034
Table 21: Latin America Market Value (US$ Million) Forecast by Imaging Technology, 2019 to 2034
Table 22: Latin America Market Volume (Units) Forecast by Imaging Technology, 2019 to 2034
Table 23: Latin America Market Value (US$ Million) Forecast by End User, 2019 to 2034
Table 24: Latin America Market Volume (Units) Forecast by End User, 2019 to 2034
Table 25: Western Europe Market Value (US$ Million) Forecast by Country, 2019 to 2034
Table 26: Western Europe Market Volume (Units) Forecast by Country, 2019 to 2034
Table 27: Western Europe Market Value (US$ Million) Forecast by Product Type, 2019 to 2034
Table 28: Western Europe Market Volume (Units) Forecast by Product Type, 2019 to 2034
Table 29: Western Europe Market Value (US$ Million) Forecast by Imaging Technology, 2019 to 2034
Table 30: Western Europe Market Volume (Units) Forecast by Imaging Technology, 2019 to 2034
Table 31: Western Europe Market Value (US$ Million) Forecast by End User, 2019 to 2034
Table 32: Western Europe Market Volume (Units) Forecast by End User, 2019 to 2034
Table 33: Eastern Europe Market Value (US$ Million) Forecast by Country, 2019 to 2034
Table 34: Eastern Europe Market Volume (Units) Forecast by Country, 2019 to 2034
Table 35: Eastern Europe Market Value (US$ Million) Forecast by Product Type, 2019 to 2034
Table 36: Eastern Europe Market Volume (Units) Forecast by Product Type, 2019 to 2034
Table 37: Eastern Europe Market Value (US$ Million) Forecast by Imaging Technology, 2019 to 2034
Table 38: Eastern Europe Market Volume (Units) Forecast by Imaging Technology, 2019 to 2034
Table 39: Eastern Europe Market Value (US$ Million) Forecast by End User, 2019 to 2034
Table 40: Eastern Europe Market Volume (Units) Forecast by End User, 2019 to 2034
Table 41: South Asia and Pacific Market Value (US$ Million) Forecast by Country, 2019 to 2034
Table 42: South Asia and Pacific Market Volume (Units) Forecast by Country, 2019 to 2034
Table 43: South Asia and Pacific Market Value (US$ Million) Forecast by Product Type, 2019 to 2034
Table 44: South Asia and Pacific Market Volume (Units) Forecast by Product Type, 2019 to 2034
Table 45: South Asia and Pacific Market Value (US$ Million) Forecast by Imaging Technology, 2019 to 2034
Table 46: South Asia and Pacific Market Volume (Units) Forecast by Imaging Technology, 2019 to 2034
Table 47: South Asia and Pacific Market Value (US$ Million) Forecast by End User, 2019 to 2034
Table 48: South Asia and Pacific Market Volume (Units) Forecast by End User, 2019 to 2034
Table 49: East Asia Market Value (US$ Million) Forecast by Country, 2019 to 2034
Table 50: East Asia Market Volume (Units) Forecast by Country, 2019 to 2034
Table 51: East Asia Market Value (US$ Million) Forecast by Product Type, 2019 to 2034
Table 52: East Asia Market Volume (Units) Forecast by Product Type, 2019 to 2034
Table 53: East Asia Market Value (US$ Million) Forecast by Imaging Technology, 2019 to 2034
Table 54: East Asia Market Volume (Units) Forecast by Imaging Technology, 2019 to 2034
Table 55: East Asia Market Value (US$ Million) Forecast by End User, 2019 to 2034
Table 56: East Asia Market Volume (Units) Forecast by End User, 2019 to 2034
Table 57: Middle East and Africa Market Value (US$ Million) Forecast by Country, 2019 to 2034
Table 58: Middle East and Africa Market Volume (Units) Forecast by Country, 2019 to 2034
Table 59: Middle East and Africa Market Value (US$ Million) Forecast by Product Type, 2019 to 2034
Table 60: Middle East and Africa Market Volume (Units) Forecast by Product Type, 2019 to 2034
Table 61: Middle East and Africa Market Value (US$ Million) Forecast by Imaging Technology, 2019 to 2034
Table 62: Middle East and Africa Market Volume (Units) Forecast by Imaging Technology, 2019 to 2034
Table 63: Middle East and Africa Market Value (US$ Million) Forecast by End User, 2019 to 2034
Table 64: Middle East and Africa Market Volume (Units) Forecast by End User, 2019 to 2034
Figure 1: Global Market Value (US$ Million) by Product Type, 2024 to 2034
Figure 2: Global Market Value (US$ Million) by Imaging Technology, 2024 to 2034
Figure 3: Global Market Value (US$ Million) by End User, 2024 to 2034
Figure 4: Global Market Value (US$ Million) by Region, 2024 to 2034
Figure 5: Global Market Value (US$ Million) Analysis by Region, 2019 to 2034
Figure 6: Global Market Volume (Units) Analysis by Region, 2019 to 2034
Figure 7: Global Market Value Share (%) and BPS Analysis by Region, 2024 to 2034
Figure 8: Global Market Y-o-Y Growth (%) Projections by Region, 2024 to 2034
Figure 9: Global Market Value (US$ Million) Analysis by Product Type, 2019 to 2034
Figure 10: Global Market Volume (Units) Analysis by Product Type, 2019 to 2034
Figure 11: Global Market Value Share (%) and BPS Analysis by Product Type, 2024 to 2034
Figure 12: Global Market Y-o-Y Growth (%) Projections by Product Type, 2024 to 2034
Figure 13: Global Market Value (US$ Million) Analysis by Imaging Technology, 2019 to 2034
Figure 14: Global Market Volume (Units) Analysis by Imaging Technology, 2019 to 2034
Figure 15: Global Market Value Share (%) and BPS Analysis by Imaging Technology, 2024 to 2034
Figure 16: Global Market Y-o-Y Growth (%) Projections by Imaging Technology, 2024 to 2034
Figure 17: Global Market Value (US$ Million) Analysis by End User, 2019 to 2034
Figure 18: Global Market Volume (Units) Analysis by End User, 2019 to 2034
Figure 19: Global Market Value Share (%) and BPS Analysis by End User, 2024 to 2034
Figure 20: Global Market Y-o-Y Growth (%) Projections by End User, 2024 to 2034
Figure 21: Global Market Attractiveness by Product Type, 2024 to 2034
Figure 22: Global Market Attractiveness by Imaging Technology, 2024 to 2034
Figure 23: Global Market Attractiveness by End User, 2024 to 2034
Figure 24: Global Market Attractiveness by Region, 2024 to 2034
Figure 25: North America Market Value (US$ Million) by Product Type, 2024 to 2034
Figure 26: North America Market Value (US$ Million) by Imaging Technology, 2024 to 2034
Figure 27: North America Market Value (US$ Million) by End User, 2024 to 2034
Figure 28: North America Market Value (US$ Million) by Country, 2024 to 2034
Figure 29: North America Market Value (US$ Million) Analysis by Country, 2019 to 2034
Figure 30: North America Market Volume (Units) Analysis by Country, 2019 to 2034
Figure 31: North America Market Value Share (%) and BPS Analysis by Country, 2024 to 2034
Figure 32: North America Market Y-o-Y Growth (%) Projections by Country, 2024 to 2034
Figure 33: North America Market Value (US$ Million) Analysis by Product Type, 2019 to 2034
Figure 34: North America Market Volume (Units) Analysis by Product Type, 2019 to 2034
Figure 35: North America Market Value Share (%) and BPS Analysis by Product Type, 2024 to 2034
Figure 36: North America Market Y-o-Y Growth (%) Projections by Product Type, 2024 to 2034
Figure 37: North America Market Value (US$ Million) Analysis by Imaging Technology, 2019 to 2034
Figure 38: North America Market Volume (Units) Analysis by Imaging Technology, 2019 to 2034
Figure 39: North America Market Value Share (%) and BPS Analysis by Imaging Technology, 2024 to 2034
Figure 40: North America Market Y-o-Y Growth (%) Projections by Imaging Technology, 2024 to 2034
Figure 41: North America Market Value (US$ Million) Analysis by End User, 2019 to 2034
Figure 42: North America Market Volume (Units) Analysis by End User, 2019 to 2034
Figure 43: North America Market Value Share (%) and BPS Analysis by End User, 2024 to 2034
Figure 44: North America Market Y-o-Y Growth (%) Projections by End User, 2024 to 2034
Figure 45: North America Market Attractiveness by Product Type, 2024 to 2034
Figure 46: North America Market Attractiveness by Imaging Technology, 2024 to 2034
Figure 47: North America Market Attractiveness by End User, 2024 to 2034
Figure 48: North America Market Attractiveness by Country, 2024 to 2034
Figure 49: Latin America Market Value (US$ Million) by Product Type, 2024 to 2034
Figure 50: Latin America Market Value (US$ Million) by Imaging Technology, 2024 to 2034
Figure 51: Latin America Market Value (US$ Million) by End User, 2024 to 2034
Figure 52: Latin America Market Value (US$ Million) by Country, 2024 to 2034
Figure 53: Latin America Market Value (US$ Million) Analysis by Country, 2019 to 2034
Figure 54: Latin America Market Volume (Units) Analysis by Country, 2019 to 2034
Figure 55: Latin America Market Value Share (%) and BPS Analysis by Country, 2024 to 2034
Figure 56: Latin America Market Y-o-Y Growth (%) Projections by Country, 2024 to 2034
Figure 57: Latin America Market Value (US$ Million) Analysis by Product Type, 2019 to 2034
Figure 58: Latin America Market Volume (Units) Analysis by Product Type, 2019 to 2034
Figure 59: Latin America Market Value Share (%) and BPS Analysis by Product Type, 2024 to 2034
Figure 60: Latin America Market Y-o-Y Growth (%) Projections by Product Type, 2024 to 2034
Figure 61: Latin America Market Value (US$ Million) Analysis by Imaging Technology, 2019 to 2034
Figure 62: Latin America Market Volume (Units) Analysis by Imaging Technology, 2019 to 2034
Figure 63: Latin America Market Value Share (%) and BPS Analysis by Imaging Technology, 2024 to 2034
Figure 64: Latin America Market Y-o-Y Growth (%) Projections by Imaging Technology, 2024 to 2034
Figure 65: Latin America Market Value (US$ Million) Analysis by End User, 2019 to 2034
Figure 66: Latin America Market Volume (Units) Analysis by End User, 2019 to 2034
Figure 67: Latin America Market Value Share (%) and BPS Analysis by End User, 2024 to 2034
Figure 68: Latin America Market Y-o-Y Growth (%) Projections by End User, 2024 to 2034
Figure 69: Latin America Market Attractiveness by Product Type, 2024 to 2034
Figure 70: Latin America Market Attractiveness by Imaging Technology, 2024 to 2034
Figure 71: Latin America Market Attractiveness by End User, 2024 to 2034
Figure 72: Latin America Market Attractiveness by Country, 2024 to 2034
Figure 73: Western Europe Market Value (US$ Million) by Product Type, 2024 to 2034
Figure 74: Western Europe Market Value (US$ Million) by Imaging Technology, 2024 to 2034
Figure 75: Western Europe Market Value (US$ Million) by End User, 2024 to 2034
Figure 76: Western Europe Market Value (US$ Million) by Country, 2024 to 2034
Figure 77: Western Europe Market Value (US$ Million) Analysis by Country, 2019 to 2034
Figure 78: Western Europe Market Volume (Units) Analysis by Country, 2019 to 2034
Figure 79: Western Europe Market Value Share (%) and BPS Analysis by Country, 2024 to 2034
Figure 80: Western Europe Market Y-o-Y Growth (%) Projections by Country, 2024 to 2034
Figure 81: Western Europe Market Value (US$ Million) Analysis by Product Type, 2019 to 2034
Figure 82: Western Europe Market Volume (Units) Analysis by Product Type, 2019 to 2034
Figure 83: Western Europe Market Value Share (%) and BPS Analysis by Product Type, 2024 to 2034
Figure 84: Western Europe Market Y-o-Y Growth (%) Projections by Product Type, 2024 to 2034
Figure 85: Western Europe Market Value (US$ Million) Analysis by Imaging Technology, 2019 to 2034
Figure 86: Western Europe Market Volume (Units) Analysis by Imaging Technology, 2019 to 2034
Figure 87: Western Europe Market Value Share (%) and BPS Analysis by Imaging Technology, 2024 to 2034
Figure 88: Western Europe Market Y-o-Y Growth (%) Projections by Imaging Technology, 2024 to 2034
Figure 89: Western Europe Market Value (US$ Million) Analysis by End User, 2019 to 2034
Figure 90: Western Europe Market Volume (Units) Analysis by End User, 2019 to 2034
Figure 91: Western Europe Market Value Share (%) and BPS Analysis by End User, 2024 to 2034
Figure 92: Western Europe Market Y-o-Y Growth (%) Projections by End User, 2024 to 2034
Figure 93: Western Europe Market Attractiveness by Product Type, 2024 to 2034
Figure 94: Western Europe Market Attractiveness by Imaging Technology, 2024 to 2034
Figure 95: Western Europe Market Attractiveness by End User, 2024 to 2034
Figure 96: Western Europe Market Attractiveness by Country, 2024 to 2034
Figure 97: Eastern Europe Market Value (US$ Million) by Product Type, 2024 to 2034
Figure 98: Eastern Europe Market Value (US$ Million) by Imaging Technology, 2024 to 2034
Figure 99: Eastern Europe Market Value (US$ Million) by End User, 2024 to 2034
Figure 100: Eastern Europe Market Value (US$ Million) by Country, 2024 to 2034
Figure 101: Eastern Europe Market Value (US$ Million) Analysis by Country, 2019 to 2034
Figure 102: Eastern Europe Market Volume (Units) Analysis by Country, 2019 to 2034
Figure 103: Eastern Europe Market Value Share (%) and BPS Analysis by Country, 2024 to 2034
Figure 104: Eastern Europe Market Y-o-Y Growth (%) Projections by Country, 2024 to 2034
Figure 105: Eastern Europe Market Value (US$ Million) Analysis by Product Type, 2019 to 2034
Figure 106: Eastern Europe Market Volume (Units) Analysis by Product Type, 2019 to 2034
Figure 107: Eastern Europe Market Value Share (%) and BPS Analysis by Product Type, 2024 to 2034
Figure 108: Eastern Europe Market Y-o-Y Growth (%) Projections by Product Type, 2024 to 2034
Figure 109: Eastern Europe Market Value (US$ Million) Analysis by Imaging Technology, 2019 to 2034
Figure 110: Eastern Europe Market Volume (Units) Analysis by Imaging Technology, 2019 to 2034
Figure 111: Eastern Europe Market Value Share (%) and BPS Analysis by Imaging Technology, 2024 to 2034
Figure 112: Eastern Europe Market Y-o-Y Growth (%) Projections by Imaging Technology, 2024 to 2034
Figure 113: Eastern Europe Market Value (US$ Million) Analysis by End User, 2019 to 2034
Figure 114: Eastern Europe Market Volume (Units) Analysis by End User, 2019 to 2034
Figure 115: Eastern Europe Market Value Share (%) and BPS Analysis by End User, 2024 to 2034
Figure 116: Eastern Europe Market Y-o-Y Growth (%) Projections by End User, 2024 to 2034
Figure 117: Eastern Europe Market Attractiveness by Product Type, 2024 to 2034
Figure 118: Eastern Europe Market Attractiveness by Imaging Technology, 2024 to 2034
Figure 119: Eastern Europe Market Attractiveness by End User, 2024 to 2034
Figure 120: Eastern Europe Market Attractiveness by Country, 2024 to 2034
Figure 121: South Asia and Pacific Market Value (US$ Million) by Product Type, 2024 to 2034
Figure 122: South Asia and Pacific Market Value (US$ Million) by Imaging Technology, 2024 to 2034
Figure 123: South Asia and Pacific Market Value (US$ Million) by End User, 2024 to 2034
Figure 124: South Asia and Pacific Market Value (US$ Million) by Country, 2024 to 2034
Figure 125: South Asia and Pacific Market Value (US$ Million) Analysis by Country, 2019 to 2034
Figure 126: South Asia and Pacific Market Volume (Units) Analysis by Country, 2019 to 2034
Figure 127: South Asia and Pacific Market Value Share (%) and BPS Analysis by Country, 2024 to 2034
Figure 128: South Asia and Pacific Market Y-o-Y Growth (%) Projections by Country, 2024 to 2034
Figure 129: South Asia and Pacific Market Value (US$ Million) Analysis by Product Type, 2019 to 2034
Figure 130: South Asia and Pacific Market Volume (Units) Analysis by Product Type, 2019 to 2034
Figure 131: South Asia and Pacific Market Value Share (%) and BPS Analysis by Product Type, 2024 to 2034
Figure 132: South Asia and Pacific Market Y-o-Y Growth (%) Projections by Product Type, 2024 to 2034
Figure 133: South Asia and Pacific Market Value (US$ Million) Analysis by Imaging Technology, 2019 to 2034
Figure 134: South Asia and Pacific Market Volume (Units) Analysis by Imaging Technology, 2019 to 2034
Figure 135: South Asia and Pacific Market Value Share (%) and BPS Analysis by Imaging Technology, 2024 to 2034
Figure 136: South Asia and Pacific Market Y-o-Y Growth (%) Projections by Imaging Technology, 2024 to 2034
Figure 137: South Asia and Pacific Market Value (US$ Million) Analysis by End User, 2019 to 2034
Figure 138: South Asia and Pacific Market Volume (Units) Analysis by End User, 2019 to 2034
Figure 139: South Asia and Pacific Market Value Share (%) and BPS Analysis by End User, 2024 to 2034
Figure 140: South Asia and Pacific Market Y-o-Y Growth (%) Projections by End User, 2024 to 2034
Figure 141: South Asia and Pacific Market Attractiveness by Product Type, 2024 to 2034
Figure 142: South Asia and Pacific Market Attractiveness by Imaging Technology, 2024 to 2034
Figure 143: South Asia and Pacific Market Attractiveness by End User, 2024 to 2034
Figure 144: South Asia and Pacific Market Attractiveness by Country, 2024 to 2034
Figure 145: East Asia Market Value (US$ Million) by Product Type, 2024 to 2034
Figure 146: East Asia Market Value (US$ Million) by Imaging Technology, 2024 to 2034
Figure 147: East Asia Market Value (US$ Million) by End User, 2024 to 2034
Figure 148: East Asia Market Value (US$ Million) by Country, 2024 to 2034
Figure 149: East Asia Market Value (US$ Million) Analysis by Country, 2019 to 2034
Figure 150: East Asia Market Volume (Units) Analysis by Country, 2019 to 2034
Figure 151: East Asia Market Value Share (%) and BPS Analysis by Country, 2024 to 2034
Figure 152: East Asia Market Y-o-Y Growth (%) Projections by Country, 2024 to 2034
Figure 153: East Asia Market Value (US$ Million) Analysis by Product Type, 2019 to 2034
Figure 154: East Asia Market Volume (Units) Analysis by Product Type, 2019 to 2034
Figure 155: East Asia Market Value Share (%) and BPS Analysis by Product Type, 2024 to 2034
Figure 156: East Asia Market Y-o-Y Growth (%) Projections by Product Type, 2024 to 2034
Figure 157: East Asia Market Value (US$ Million) Analysis by Imaging Technology, 2019 to 2034
Figure 158: East Asia Market Volume (Units) Analysis by Imaging Technology, 2019 to 2034
Figure 159: East Asia Market Value Share (%) and BPS Analysis by Imaging Technology, 2024 to 2034
Figure 160: East Asia Market Y-o-Y Growth (%) Projections by Imaging Technology, 2024 to 2034
Figure 161: East Asia Market Value (US$ Million) Analysis by End User, 2019 to 2034
Figure 162: East Asia Market Volume (Units) Analysis by End User, 2019 to 2034
Figure 163: East Asia Market Value Share (%) and BPS Analysis by End User, 2024 to 2034
Figure 164: East Asia Market Y-o-Y Growth (%) Projections by End User, 2024 to 2034
Figure 165: East Asia Market Attractiveness by Product Type, 2024 to 2034
Figure 166: East Asia Market Attractiveness by Imaging Technology, 2024 to 2034
Figure 167: East Asia Market Attractiveness by End User, 2024 to 2034
Figure 168: East Asia Market Attractiveness by Country, 2024 to 2034
Figure 169: Middle East and Africa Market Value (US$ Million) by Product Type, 2024 to 2034
Figure 170: Middle East and Africa Market Value (US$ Million) by Imaging Technology, 2024 to 2034
Figure 171: Middle East and Africa Market Value (US$ Million) by End User, 2024 to 2034
Figure 172: Middle East and Africa Market Value (US$ Million) by Country, 2024 to 2034
Figure 173: Middle East and Africa Market Value (US$ Million) Analysis by Country, 2019 to 2034
Figure 174: Middle East and Africa Market Volume (Units) Analysis by Country, 2019 to 2034
Figure 175: Middle East and Africa Market Value Share (%) and BPS Analysis by Country, 2024 to 2034
Figure 176: Middle East and Africa Market Y-o-Y Growth (%) Projections by Country, 2024 to 2034
Figure 177: Middle East and Africa Market Value (US$ Million) Analysis by Product Type, 2019 to 2034
Figure 178: Middle East and Africa Market Volume (Units) Analysis by Product Type, 2019 to 2034
Figure 179: Middle East and Africa Market Value Share (%) and BPS Analysis by Product Type, 2024 to 2034
Figure 180: Middle East and Africa Market Y-o-Y Growth (%) Projections by Product Type, 2024 to 2034
Figure 181: Middle East and Africa Market Value (US$ Million) Analysis by Imaging Technology, 2019 to 2034
Figure 182: Middle East and Africa Market Volume (Units) Analysis by Imaging Technology, 2019 to 2034
Figure 183: Middle East and Africa Market Value Share (%) and BPS Analysis by Imaging Technology, 2024 to 2034
Figure 184: Middle East and Africa Market Y-o-Y Growth (%) Projections by Imaging Technology, 2024 to 2034
Figure 185: Middle East and Africa Market Value (US$ Million) Analysis by End User, 2019 to 2034
Figure 186: Middle East and Africa Market Volume (Units) Analysis by End User, 2019 to 2034
Figure 187: Middle East and Africa Market Value Share (%) and BPS Analysis by End User, 2024 to 2034
Figure 188: Middle East and Africa Market Y-o-Y Growth (%) Projections by End User, 2024 to 2034
Figure 189: Middle East and Africa Market Attractiveness by Product Type, 2024 to 2034
Figure 190: Middle East and Africa Market Attractiveness by Imaging Technology, 2024 to 2034
Figure 191: Middle East and Africa Market Attractiveness by End User, 2024 to 2034
Figure 192: Middle East and Africa Market Attractiveness by Country, 2024 to 2034
The overall market size for veterinary ultrasound scanner market was USD 213.1 million in 2025.
The veterinary ultrasound scanner market is expected to reach USD 307.6 million in 2035.
The increasing number of varieties of livestock and equine care has raised the need for efficient diagnostic tools are enhancing market penetration the demand for veterinary ultrasound scanner market.
The top key players that drives the development of veterinary ultrasound scanner market are Mindray Medical International Limited, General Electric Company, Fujifilm Holdings Corporation, Canon Inc. and Samsung Electronics Co. Ltd.
Portable/Hand Held Ultrasound Scanners, is by product type leading segment in veterinary ultrasound scanner market is expected to command significant share over the assessment period.
Explore Animal Health Devices Insights
Thank you!
You will receive an email from our Business Development Manager. Please be sure to check your SPAM/JUNK folder too.