Veterinary Imaging Market Size and Share Forecast Outlook 2025 to 2035

The Veterinary Imaging Market is estimated to be valued at USD 2.4 billion in 2025 and is projected to reach USD 4.6 billion by 2035, registering a compound annual growth rate (CAGR) of 6.6% over the forecast period.

The veterinary imaging market is expanding steadily, driven by rising companion animal ownership, increasing pet healthcare expenditure, and advancements in diagnostic imaging technologies. Veterinary clinics and animal hospitals are adopting advanced imaging equipment to improve diagnostic accuracy and enable earlier intervention for a variety of animal health conditions.

Clinical reports and industry presentations have highlighted the growing use of digital radiography, ultrasound, and MRI in veterinary settings, particularly for chronic disease monitoring and orthopedic assessments. Additionally, the demand for imaging services has risen due to the growing awareness of preventive care among pet owners and the expanding scope of veterinary specialties.

Investments in portable imaging devices and cloud-based imaging platforms have further improved diagnostic access in rural and mobile veterinary practices. Looking forward, market growth is expected to be supported by increased clinical training in veterinary radiology, broader insurance coverage for pet diagnostics, and ongoing innovations in AI-powered image analysis tools. Segmental expansion is being led by equipment sales, small animal imaging services, and orthopedic applications due to their high frequency of use and clinical importance in companion animal healthcare.
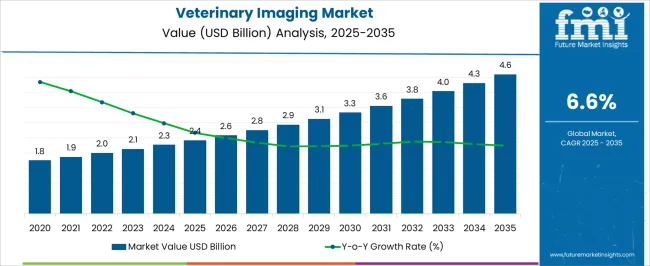
Quick Stats for Veterinary Imaging Market

  • Veterinary Imaging Market Industry Value (2025): USD 2.4 billion
  • Veterinary Imaging Market Forecast Value (2035): USD 4.6 billion
  • Veterinary Imaging Market Forecast CAGR: 6.6%
  • Leading Segment in Veterinary Imaging Market in 2025: Equipment (57.7%)
  • Key Growth Region in Veterinary Imaging Market: North America, Asia-Pacific, Europe
  • Top Key Players in Veterinary Imaging Market: Esaote, IDEXX Laboratories, Inc., IMV Technologies Group, Carestream Health, Hallmarq Ltd., MinXray, Inc., Universal Medical Systems, Inc., Agfa- Gevaert N.V., Mindray Medical International Ltd., GE Healthcare, Siemens AG

Veterinary Imaging Market Market Value Analysis

Metric Value
Veterinary Imaging Market Estimated Value in (2025 E) USD 2.4 billion
Veterinary Imaging Market Forecast Value in (2035 F) USD 4.6 billion
Forecast CAGR (2025 to 2035) 6.6%

Segmental Analysis

The market is segmented by Product Type, Animal Type, Application, and End User and region. By Product Type, the market is divided into Equipment, Software, and Reagents. In terms of Animal Type, the market is classified into Small Animals and Large Animals. Based on Application, the market is segmented into Orthopedics, Cardiology, Neurology, Oncology, and Others. By End User, the market is divided into Veterinary Clinics, Veterinary Hospitals, Veterinary Institutes, and Research Centres. Regionally, the market is classified into North America, Latin America, Western Europe, Eastern Europe, Balkan & Baltic Countries, Russia & Belarus, Central Asia, East Asia, South Asia & Pacific, and the Middle East & Africa.
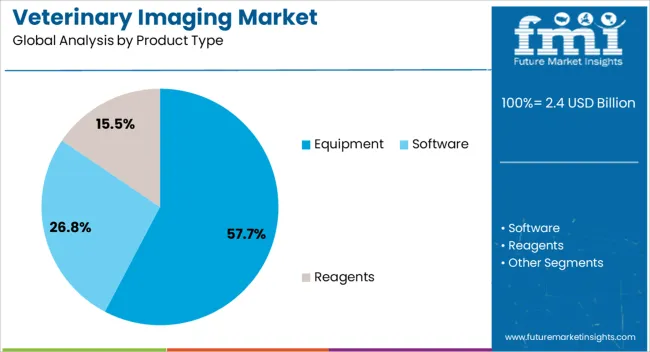
Insights into the Product Type Segment: Equipment

Veterinary Imaging Market Analysis By Product Type

The Equipment segment is projected to account for 57.7% of the veterinary imaging market revenue in 2025, maintaining its leadership among product categories. This dominance has been attributed to the widespread use of diagnostic imaging systems such as digital X-ray, ultrasound, CT, and MRI across veterinary practices.

The segment has been supported by increasing capital investment in veterinary clinics and hospitals aiming to expand service offerings and improve diagnostic capabilities. Equipment manufacturers have introduced compact, high-resolution systems tailored for veterinary applications, contributing to the segment’s growth.

Furthermore, digital transformation in animal healthcare has encouraged the replacement of analog systems with advanced imaging technologies, enhancing workflow efficiency and image storage capabilities. As demand for point-of-care and portable imaging solutions grows, especially in ambulatory practices, the Equipment segment is expected to remain a key driver of market growth.
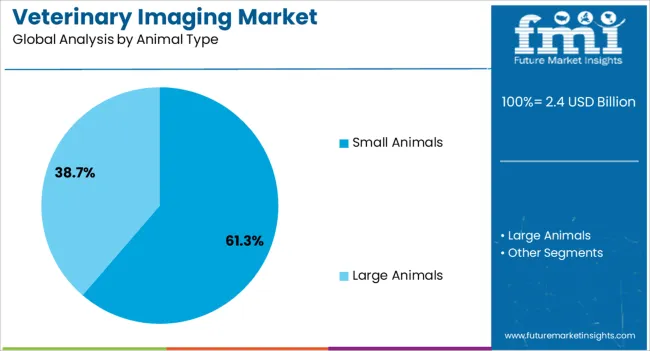
Insights into the Animal Type Segment: Small Animals

Veterinary Imaging Market Analysis By Animal Type

The Small Animals segment is projected to contribute 61.3% of the veterinary imaging market revenue in 2025, reflecting its leading share across animal categories. This segment’s strength has been supported by the increasing number of pet adoptions and a strong emotional and financial commitment by owners toward companion animal health.

Diagnostic imaging is routinely performed in dogs and cats for conditions such as arthritis, tumors, and organ diseases, increasing the demand for reliable and non-invasive imaging solutions. Veterinary clinics and urban animal hospitals have prioritized imaging investments to cater to the rising clinical visits for small animal diagnostics.

Additionally, pharmaceutical and research studies involving small animals have required consistent imaging support, further reinforcing segmental demand. With continuous development in compact imaging technologies and increasing awareness of early disease detection, the Small Animals segment is expected to dominate the veterinary imaging landscape.
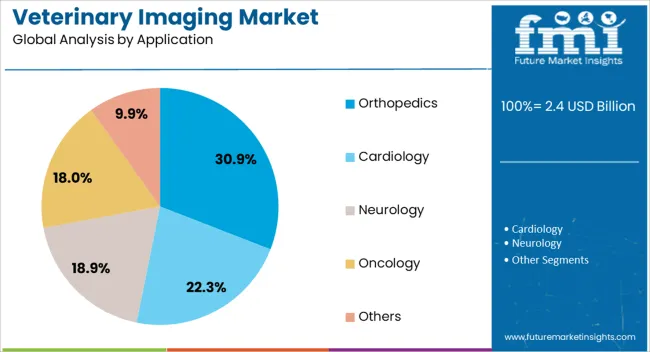
Insights into the Application Segment: Orthopedics

Veterinary Imaging Market Analysis By Application

The Orthopedics segment is projected to hold 30.9% of the veterinary imaging market revenue in 2025, establishing itself as the top clinical application area. Growth in this segment has been driven by the high incidence of musculoskeletal injuries, joint disorders, and age-related mobility issues in both pets and working animals.

Imaging modalities such as radiography, CT, and ultrasound have been routinely employed to diagnose fractures, evaluate joint function, and monitor post-surgical recovery. Veterinary surgeons have emphasized the critical role of imaging in treatment planning and outcome assessment for orthopedic procedures.

Market demand has been supported by rising pet obesity rates, which contribute to joint stress and degenerative conditions requiring detailed musculoskeletal evaluation. The availability of high-definition, weight-bearing imaging systems has further improved diagnostic precision in orthopedic assessments. As surgical procedures become more advanced and rehabilitation programs grow, the Orthopedics segment is expected to maintain its strong position within veterinary imaging applications.

Key Industry Highlights

High Adoption of Companion Animals

Ownership of companion animals, especially cats and dogs, has gained immense attention, fueling the demand surge for veterinary healthcare services.

This increasing adoption in emerging economies has facilitated the veterinary imaging market in various parts of the world. Post-COVID scenarios have shown a significant rise in the pet population. Thus, pet owners are willing to spend heavily on their care and diagnostics.

Ascent of Zoonotic Disease has Ignite Clamor for Accurate Diagnosis Techniques

Increasing prevalence of animal diseases and the advancement of animal healthcare also backs up industry growth. The need for early diagnosis and treatment of animal diseases and injuries is met with advancements in imaging technologies. Growing requirements have propelled researchers to delve into more accurate algorithms, leading to sectoral growth.

AI Integration has Boosted the Landscape

Adoption of digital imaging technologies is also a key factor driving the development of this sector. Efficient sharing and analysis of images, integration of AI, and miniaturization of devices have sped up diagnosis and improved treatment outcomes. Cloud-based platforms for remote consultations and affordable imaging systems paint a clear picture of the future uptake of this sector.

Resilience of Veterinary Imaging Market

Talking about challenges, the high cost of equipment and initial investments in this equipment pose significant hurdles to the sector's growth. Secondly, practitioners face financing constraints. Lastly, technological advancements require skilled workers and revenue to scale up, all of which impede industry growth.

2020 to 2025 Global Veterinary Imaging Sales Outlook Compared to Demand Forecasts from 2025 to 2035

Comparing the sector position in 2020 to 2025, the veterinary imaging market was not very developed but had a hold of development with advancements going on. In 2020, the industry size was USD 1,630 million, and for 2025, it was USD 2,132.7 million. A CAGR of 5.5% from 2020 to 2025 shows the adoption of various technologies and the start of the imaging era for animal welfare.

Looking at the broader picture from 2025 to 2035, the estimated CAGR of 6.6% shows a significant shift toward high-tech machines like magnetic resonance imaging and ultrasound. Adoption of cloud-based platforms and affordable imaging systems also has the potential to boost industrial growth.

Post-COVID impact on the market has a big change in the scenario with more number of pet owners and the government focusing on animal welfare. Historical period did not create a suitable environment for collaborations among big players.

But the upcoming decade is set to see investment and partnership play a bigger role. Even awareness and keen interest in companion pets' health in today's time has contributed a big portion to the success of the veterinary imaging market more than ever before.

Category-wise Insights

The section covers information about the prominent segments in the industry. In terms of product type, the equipment segment is estimated to account for a share of 57.7% in 2025. By application, the orthopedic category is projected to dominate by holding a share of 30.9% in 2025.

Demand for Specialized Animal Care ignites the Veterinary Imaging Equipment Sales

Advancements in technology have accelerated the accuracy and efficiency of veterinary imaging equipment. This has made it an essential tool for veterinarians. Ongoing developments in digital imaging technology enable veterinarians to treat a wide range of conditions in animals.

Rising prevalence of chronic diseases in animals is also soaring the industrial scope. A significant share of 57.7% in 2025 has shown substantial growth as pet owners seek specialized care.

Segment Equipment (Product Type)
Value Share (2025) 57.7%

Need for advanced imaging technology has led to a surge a number of veterinary clinics and hospitals that offer the preeminent imaging services. This ultimately has spurred the demand for veterinary imaging equipment.

Orthopedic Imaging Advancements Augment Sales Surge

Fractures, sprains, and ligament tears are the most common orthopedic conditions. Conditions like this require accurate and detailed imaging to diagnose and treat. This, in turn, has spurred the clamor for orthopedic imaging equipment.

Orthopedics is, therefore, one of the most frequently used applications in veterinary imaging, with veterinarians encountering orthopedic applications as the most common practice, accounting for a share of 30.9% in 2025.

Segment Orthopedic (Application)
Value Share (2025) 30.9%

Advancements in digital radiography, computed tomography, and magnetic resonance imaging have boosted the diagnosis to new levels. Veterinarians can get detailed images of bones, joints, and soft tissues through advanced orthopedic imaging.

This results in more accurate and precise diagnosis and treatment. Accordingly, this has driven the growth of the veterinary imaging market in parallel with the veterinary orthopedic imaging sector.

Country-wise Insights

North American countries with advanced technology and huge spending on healthcare are ruling in the animal welfare sector, too. Canada is reported to cover a CAGR of 10% from 2025 to 2035, which is commendable and higher than that of the United States.

Other countries like Malaysia, Indonesia, and the United Kingdom are in line to expand through collaborations, the development of specialized technologies, and the search for more precise imaging devices. To cope, every country competes to make a strong industrial presence both locally and internationally.

Countries CAGR 2025 to 2035
Canada 10%
Malaysia 7.8%
Indonesia 7.1%
United Kingdom 6.1%
United States 5.4%

Livestock Health Monitoring in Canada Profits the Animal Diagnosis Sector

Growing demand for livestock health monitoring and disease prevention has spurred the industry's success in Canada. Remarkable CAGR of 10% through 2035 projects Canada as a key player in the global livestock industry.

With increasing emphasis on maintaining the health and productivity of livestock herds, the veterinary imaging market is skyrocketing here. This has curated the need for advanced imaging techniques like MRI and ultrasound for livestock diagnosis.

Trend of pet ownership is one of the key factors in soaring sectoral success. This has increasingly boosted the clamor for high-quality healthcare services. The industry has curated lucrative opportunities for industry players specializing in both livestock and small and large animal diagnosis systems.

Surge in Research and Development Activities in the United Kingdom for Veterinary Applications

Introduction of groundbreaking imaging technologies tailored for veterinary applications is the credit score of the United Kingdom veterinary imaging market growth. Companies are focused on making portable and user-friendly systems to cover the surging need for diagnostics.

The innovation is likely to revolutionize imaging practices in the United Kingdom and beyond. Thus, they are expected to soar in the foreseen future with an accounted CAGR of 6.1% through 2035.

Acquisitions like Hallmarq Veterinary Imaging by Mars Petcare have introduced innovative imaging solutions in the sector. Key players in the United Kingdom are IDEXX Laboratories, Inc., Fujifilm Holdings Corporation, Carestream Health, Inc., Esaote SpA, and others. With mergers, research, and ongoing developments, the United Kingdom is poised to expand broadly in the foreseeable future.

Integration of Artificial Intelligence in the United States Shapes Animal Healthcare Expenditure

Growing trend of pet ownership and heightened spending on pet healthcare in the United States increases the demand for veterinary services. Integration of artificial intelligence and miniaturization of imaging devices has fueled the industry development and requirements of this sector in the United States.

With a 5.4% CAGR from 2025 to 2035, the United States veterinary imaging market is set to improve diagnostic capabilities and enhance patient care.

Mounting pet population has barked the requirement for veterinary diagnostics. Pet owners are seeking advanced medical services for their animals. This simultaneously facilitates the adoption of imaging systems in veterinary clinics.
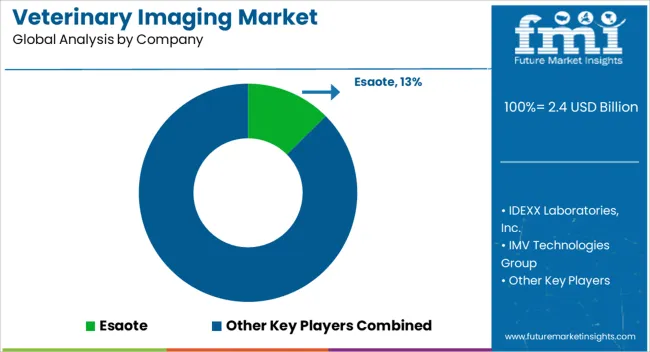
Competition Outlook

Veterinary Imaging Market Analysis By Company

Manufacturers are expanding distribution channels. Well, some companies are aimed at more advanced features and miniaturization of devices. Research on developing more advanced technologies in animal healthcare and awareness through campaigns are boosting sales.

Many key companies are focused on livestock monitoring and imaging techniques as it stands in the human care sector.

The government is also contributing to the veterinary imaging market expansion. For example, the Indian and North American governments are allocating substantial funds for the development of veterinary healthcare services, including diagnostics facilities.

Industry Updates

  • In April 2025, Antech introduced two groundbreaking diagnostic tools, AIS RapidRead, and Nu.Q® Canine Cancer Test, revolutionizing veterinary diagnostics. AIS RapidRead, developed using AI, provided rapid radiograph interpretations, while Nu.Q® enhanced cancer screening, supporting better patient outcomes.
  • In January 2025, SK Telecom signed an MOU with Vetology Innovations to introduce X Caliber, an AI-powered diagnostic service for pets, in the United States. Developed in South Korea in September 2025, X Caliber analyzes X-ray images to assist veterinarians in diagnosing diseases.
  • In June 2025, iCRco, Inc. celebrated the 4-year anniversary of installing their CLARIS V Cone Beam Computed Tomography (CBCT) imaging device at Santa Barbara Zoo. The technology revolutionized exotic animal care, providing precise 3D imaging for enhanced veterinary diagnostics and treatment.
  • In December 2025, WellVu Veterinary Thermal Imaging, previously known as Digatherm, became the first company in its category to receive Fear Free Preferred Product recognition. The company's WellVu 640 system offered high-resolution detection, aiding veterinarians in diagnosing and treating animals with ease.

Leading Veterinary Imaging Brands

  • Esaote
  • IDEXX Laboratories, Inc.
  • IMV Technologies group
  • Carestream Health
  • Hallmarq Veterinary Imaging Ltd.
  • MinXray, Inc.
  • Universal Medical Systems, Inc.
  • Agfa- Gevaert N.V.
  • Mindray Medical International Ltd.
  • GE Healthcare
  • Siemens AG

Key Segments of Market Report

By Product Type:

Based on product type, the sector is primarily divided into equipment, software, and reagents. Veterinary imaging equipment is further categorized as radiography (X-ray), ultrasound imaging, magnetic resonance imaging, computed tomography, video endoscopy imaging, and other systems.

Radiography systems are also further bifurcated into computed and film-based radiography. Ultrasound imaging systems are divided into 2D and 3D US imaging. Computed tomography systems are also parted into two single and multi-slice CT.

By Animal Type:

Small and large animals are two categorized sections of animal type in this industry.

By Application:

Veterinary imaging is applied for cardiology, orthopedics, neurology, oncology, and others.

By End User:

Clinics, hospitals, institutes, and research centers are top end users of veterinary imaging.

By Region:

A regional analysis has been carried out in key countries of North America, Latin America, Asia Pacific, Middle East and Africa (MEA), and Europe.

Frequently Asked Questions

How big is the veterinary imaging market in 2025?

The global veterinary imaging market is estimated to be valued at USD 2.4 billion in 2025.

What will be the size of veterinary imaging market in 2035?

The market size for the veterinary imaging market is projected to reach USD 4.6 billion by 2035.

How much will be the veterinary imaging market growth between 2025 and 2035?

The veterinary imaging market is expected to grow at a 6.6% CAGR between 2025 and 2035.

What are the key product types in the veterinary imaging market?

The key product types in veterinary imaging market are equipment, _radiography (x-ray) systems, _ultrasound imaging systems, _magnetic resonance imaging systems, _computed tomography systems, _video endoscopy imaging systems, _others, software, reagents, _ultrasound contrast reagents, _mri contrast reagents, _x-ray/ct contrast reagents and _nuclear imaging reagents.

Which animal type segment to contribute significant share in the veterinary imaging market in 2025?

In terms of animal type, small animals segment to command 61.3% share in the veterinary imaging market in 2025.

Table of Content

  1. Executive Summary
    • Global Market Outlook
    • Demand-side Trends
    • Supply-side Trends
    • Technology Roadmap Analysis
    • Analysis and Recommendations
  2. Market Overview
    • Market Coverage / Taxonomy
    • Market Definition / Scope / Limitations
  3. Market Background
    • Market Dynamics
      • Drivers
      • Restraints
      • Opportunity
      • Trends
    • Scenario Forecast
      • Demand in Optimistic Scenario
      • Demand in Likely Scenario
      • Demand in Conservative Scenario
    • Opportunity Map Analysis
    • Product Life Cycle Analysis
    • Supply Chain Analysis
    • Investment Feasibility Matrix
    • Value Chain Analysis
    • PESTLE and Porter’s Analysis
    • Regulatory Landscape
    • Regional Parent Market Outlook
    • Production and Consumption Statistics
    • Import and Export Statistics
  4. Global Market Analysis 2020 to 2024 and Forecast, 2025 to 2035
    • Historical Market Size Value (USD Million) Analysis, 2020 to 2024
    • Current and Future Market Size Value (USD Million) Projections, 2025 to 2035
      • Y-o-Y Growth Trend Analysis
      • Absolute $ Opportunity Analysis
  5. Global Market Pricing Analysis 2020 to 2024 and Forecast 2025 to 2035
  6. Global Market Analysis 2020 to 2024 and Forecast 2025 to 2035, By Product Type
    • Introduction / Key Findings
    • Historical Market Size Value (USD Million) Analysis By Product Type , 2020 to 2024
    • Current and Future Market Size Value (USD Million) Analysis and Forecast By Product Type , 2025 to 2035
      • Equipment
        • Radiography (X-Ray) Systems
        • Ultrasound Imaging Systems
        • Magnetic Resonance Imaging Systems
        • Computed Tomography Systems
        • Video Endoscopy Imaging Systems
        • Others
      • Software
      • Reagents
        • Ultrasound Contrast Reagents
        • MRI Contrast Reagents
        • X-Ray/CT Contrast Reagents
        • Nuclear Imaging Reagents
    • Y-o-Y Growth Trend Analysis By Product Type , 2020 to 2024
    • Absolute $ Opportunity Analysis By Product Type , 2025 to 2035
  7. Global Market Analysis 2020 to 2024 and Forecast 2025 to 2035, By Animal Type
    • Introduction / Key Findings
    • Historical Market Size Value (USD Million) Analysis By Animal Type, 2020 to 2024
    • Current and Future Market Size Value (USD Million) Analysis and Forecast By Animal Type, 2025 to 2035
      • Small Animals
      • Large Animals
    • Y-o-Y Growth Trend Analysis By Animal Type, 2020 to 2024
    • Absolute $ Opportunity Analysis By Animal Type, 2025 to 2035
  8. Global Market Analysis 2020 to 2024 and Forecast 2025 to 2035, By Application
    • Introduction / Key Findings
    • Historical Market Size Value (USD Million) Analysis By Application, 2020 to 2024
    • Current and Future Market Size Value (USD Million) Analysis and Forecast By Application, 2025 to 2035
      • Orthopedics
      • Cardiology
      • Neurology
      • Oncology
      • Others
    • Y-o-Y Growth Trend Analysis By Application, 2020 to 2024
    • Absolute $ Opportunity Analysis By Application, 2025 to 2035
  9. Global Market Analysis 2020 to 2024 and Forecast 2025 to 2035, By End User
    • Introduction / Key Findings
    • Historical Market Size Value (USD Million) Analysis By End User, 2020 to 2024
    • Current and Future Market Size Value (USD Million) Analysis and Forecast By End User, 2025 to 2035
      • Veterinary Clinics
      • Veterinary Hospitals
      • Veterinary Institutes
      • Research Centres
    • Y-o-Y Growth Trend Analysis By End User, 2020 to 2024
    • Absolute $ Opportunity Analysis By End User, 2025 to 2035
  10. Global Market Analysis 2020 to 2024 and Forecast 2025 to 2035, By Region
    • Introduction
    • Historical Market Size Value (USD Million) Analysis By Region, 2020 to 2024
    • Current Market Size Value (USD Million) Analysis and Forecast By Region, 2025 to 2035
      • North America
      • Latin America
      • Western Europe
      • Eastern Europe
      • East Asia
      • South Asia and Pacific
      • Middle East & Africa
    • Market Attractiveness Analysis By Region
  11. North America Market Analysis 2020 to 2024 and Forecast 2025 to 2035, By Country
    • Historical Market Size Value (USD Million) Trend Analysis By Market Taxonomy, 2020 to 2024
    • Market Size Value (USD Million) Forecast By Market Taxonomy, 2025 to 2035
      • By Country
        • USA
        • Canada
        • Mexico
      • By Product Type
      • By Animal Type
      • By Application
      • By End User
    • Market Attractiveness Analysis
      • By Country
      • By Product Type
      • By Animal Type
      • By Application
      • By End User
    • Key Takeaways
  12. Latin America Market Analysis 2020 to 2024 and Forecast 2025 to 2035, By Country
    • Historical Market Size Value (USD Million) Trend Analysis By Market Taxonomy, 2020 to 2024
    • Market Size Value (USD Million) Forecast By Market Taxonomy, 2025 to 2035
      • By Country
        • Brazil
        • Chile
        • Rest of Latin America
      • By Product Type
      • By Animal Type
      • By Application
      • By End User
    • Market Attractiveness Analysis
      • By Country
      • By Product Type
      • By Animal Type
      • By Application
      • By End User
    • Key Takeaways
  13. Western Europe Market Analysis 2020 to 2024 and Forecast 2025 to 2035, By Country
    • Historical Market Size Value (USD Million) Trend Analysis By Market Taxonomy, 2020 to 2024
    • Market Size Value (USD Million) Forecast By Market Taxonomy, 2025 to 2035
      • By Country
        • Germany
        • UK
        • Italy
        • Spain
        • France
        • Nordic
        • BENELUX
        • Rest of Western Europe
      • By Product Type
      • By Animal Type
      • By Application
      • By End User
    • Market Attractiveness Analysis
      • By Country
      • By Product Type
      • By Animal Type
      • By Application
      • By End User
    • Key Takeaways
  14. Eastern Europe Market Analysis 2020 to 2024 and Forecast 2025 to 2035, By Country
    • Historical Market Size Value (USD Million) Trend Analysis By Market Taxonomy, 2020 to 2024
    • Market Size Value (USD Million) Forecast By Market Taxonomy, 2025 to 2035
      • By Country
        • Russia
        • Poland
        • Hungary
        • Balkan & Baltic
        • Rest of Eastern Europe
      • By Product Type
      • By Animal Type
      • By Application
      • By End User
    • Market Attractiveness Analysis
      • By Country
      • By Product Type
      • By Animal Type
      • By Application
      • By End User
    • Key Takeaways
  15. East Asia Market Analysis 2020 to 2024 and Forecast 2025 to 2035, By Country
    • Historical Market Size Value (USD Million) Trend Analysis By Market Taxonomy, 2020 to 2024
    • Market Size Value (USD Million) Forecast By Market Taxonomy, 2025 to 2035
      • By Country
        • China
        • Japan
        • South Korea
      • By Product Type
      • By Animal Type
      • By Application
      • By End User
    • Market Attractiveness Analysis
      • By Country
      • By Product Type
      • By Animal Type
      • By Application
      • By End User
    • Key Takeaways
  16. South Asia and Pacific Market Analysis 2020 to 2024 and Forecast 2025 to 2035, By Country
    • Historical Market Size Value (USD Million) Trend Analysis By Market Taxonomy, 2020 to 2024
    • Market Size Value (USD Million) Forecast By Market Taxonomy, 2025 to 2035
      • By Country
        • India
        • ASEAN
        • Australia & New Zealand
        • Rest of South Asia and Pacific
      • By Product Type
      • By Animal Type
      • By Application
      • By End User
    • Market Attractiveness Analysis
      • By Country
      • By Product Type
      • By Animal Type
      • By Application
      • By End User
    • Key Takeaways
  17. Middle East & Africa Market Analysis 2020 to 2024 and Forecast 2025 to 2035, By Country
    • Historical Market Size Value (USD Million) Trend Analysis By Market Taxonomy, 2020 to 2024
    • Market Size Value (USD Million) Forecast By Market Taxonomy, 2025 to 2035
      • By Country
        • Kingdom of Saudi Arabia
        • Other GCC Countries
        • Turkiye
        • South Africa
        • Other African Union
        • Rest of Middle East & Africa
      • By Product Type
      • By Animal Type
      • By Application
      • By End User
    • Market Attractiveness Analysis
      • By Country
      • By Product Type
      • By Animal Type
      • By Application
      • By End User
    • Key Takeaways
  18. Key Countries Market Analysis
    • USA
      • Pricing Analysis
      • Market Share Analysis, 2024
        • By Product Type
        • By Animal Type
        • By Application
        • By End User
    • Canada
      • Pricing Analysis
      • Market Share Analysis, 2024
        • By Product Type
        • By Animal Type
        • By Application
        • By End User
    • Mexico
      • Pricing Analysis
      • Market Share Analysis, 2024
        • By Product Type
        • By Animal Type
        • By Application
        • By End User
    • Brazil
      • Pricing Analysis
      • Market Share Analysis, 2024
        • By Product Type
        • By Animal Type
        • By Application
        • By End User
    • Chile
      • Pricing Analysis
      • Market Share Analysis, 2024
        • By Product Type
        • By Animal Type
        • By Application
        • By End User
    • Germany
      • Pricing Analysis
      • Market Share Analysis, 2024
        • By Product Type
        • By Animal Type
        • By Application
        • By End User
    • UK
      • Pricing Analysis
      • Market Share Analysis, 2024
        • By Product Type
        • By Animal Type
        • By Application
        • By End User
    • Italy
      • Pricing Analysis
      • Market Share Analysis, 2024
        • By Product Type
        • By Animal Type
        • By Application
        • By End User
    • Spain
      • Pricing Analysis
      • Market Share Analysis, 2024
        • By Product Type
        • By Animal Type
        • By Application
        • By End User
    • France
      • Pricing Analysis
      • Market Share Analysis, 2024
        • By Product Type
        • By Animal Type
        • By Application
        • By End User
    • India
      • Pricing Analysis
      • Market Share Analysis, 2024
        • By Product Type
        • By Animal Type
        • By Application
        • By End User
    • ASEAN
      • Pricing Analysis
      • Market Share Analysis, 2024
        • By Product Type
        • By Animal Type
        • By Application
        • By End User
    • Australia & New Zealand
      • Pricing Analysis
      • Market Share Analysis, 2024
        • By Product Type
        • By Animal Type
        • By Application
        • By End User
    • China
      • Pricing Analysis
      • Market Share Analysis, 2024
        • By Product Type
        • By Animal Type
        • By Application
        • By End User
    • Japan
      • Pricing Analysis
      • Market Share Analysis, 2024
        • By Product Type
        • By Animal Type
        • By Application
        • By End User
    • South Korea
      • Pricing Analysis
      • Market Share Analysis, 2024
        • By Product Type
        • By Animal Type
        • By Application
        • By End User
    • Russia
      • Pricing Analysis
      • Market Share Analysis, 2024
        • By Product Type
        • By Animal Type
        • By Application
        • By End User
    • Poland
      • Pricing Analysis
      • Market Share Analysis, 2024
        • By Product Type
        • By Animal Type
        • By Application
        • By End User
    • Hungary
      • Pricing Analysis
      • Market Share Analysis, 2024
        • By Product Type
        • By Animal Type
        • By Application
        • By End User
    • Kingdom of Saudi Arabia
      • Pricing Analysis
      • Market Share Analysis, 2024
        • By Product Type
        • By Animal Type
        • By Application
        • By End User
    • Turkiye
      • Pricing Analysis
      • Market Share Analysis, 2024
        • By Product Type
        • By Animal Type
        • By Application
        • By End User
    • South Africa
      • Pricing Analysis
      • Market Share Analysis, 2024
        • By Product Type
        • By Animal Type
        • By Application
        • By End User
  19. Market Structure Analysis
    • Competition Dashboard
    • Competition Benchmarking
    • Market Share Analysis of Top Players
      • By Regional
      • By Product Type
      • By Animal Type
      • By Application
      • By End User
  20. Competition Analysis
    • Competition Deep Dive
      • Esaote
        • Overview
        • Product Portfolio
        • Profitability by Market Segments (Product/Age /Sales Channel/Region)
        • Sales Footprint
        • Strategy Overview
          • Marketing Strategy
          • Product Strategy
          • Channel Strategy
      • IDEXX Laboratories, Inc.
      • IMV Technologies Group
      • Carestream Health
      • Hallmarq Ltd.
      • MinXray, Inc.
      • Universal Medical Systems, Inc.
      • Agfa- Gevaert N.V.
      • Mindray Medical International Ltd.
      • GE Healthcare
      • Siemens AG
  21. Assumptions & Acronyms Used
  22. Research Methodology

List of Tables

  • Table 1: Global Market Value (USD Million) Forecast by Region, 2020-2035
  • Table 2: Global Market Value (USD Million) Forecast by Product Type , 2020-2035
  • Table 3: Global Market Value (USD Million) Forecast by Animal Type, 2020-2035
  • Table 4: Global Market Value (USD Million) Forecast by Application, 2020-2035
  • Table 5: Global Market Value (USD Million) Forecast by End User, 2020-2035
  • Table 6: North America Market Value (USD Million) Forecast by Country, 2020-2035
  • Table 7: North America Market Value (USD Million) Forecast by Product Type , 2020-2035
  • Table 8: North America Market Value (USD Million) Forecast by Animal Type, 2020-2035
  • Table 9: North America Market Value (USD Million) Forecast by Application, 2020-2035
  • Table 10: North America Market Value (USD Million) Forecast by End User, 2020-2035
  • Table 11: Latin America Market Value (USD Million) Forecast by Country, 2020-2035
  • Table 12: Latin America Market Value (USD Million) Forecast by Product Type , 2020-2035
  • Table 13: Latin America Market Value (USD Million) Forecast by Animal Type, 2020-2035
  • Table 14: Latin America Market Value (USD Million) Forecast by Application, 2020-2035
  • Table 15: Latin America Market Value (USD Million) Forecast by End User, 2020-2035
  • Table 16: Western Europe Market Value (USD Million) Forecast by Country, 2020-2035
  • Table 17: Western Europe Market Value (USD Million) Forecast by Product Type , 2020-2035
  • Table 18: Western Europe Market Value (USD Million) Forecast by Animal Type, 2020-2035
  • Table 19: Western Europe Market Value (USD Million) Forecast by Application, 2020-2035
  • Table 20: Western Europe Market Value (USD Million) Forecast by End User, 2020-2035
  • Table 21: Eastern Europe Market Value (USD Million) Forecast by Country, 2020-2035
  • Table 22: Eastern Europe Market Value (USD Million) Forecast by Product Type , 2020-2035
  • Table 23: Eastern Europe Market Value (USD Million) Forecast by Animal Type, 2020-2035
  • Table 24: Eastern Europe Market Value (USD Million) Forecast by Application, 2020-2035
  • Table 25: Eastern Europe Market Value (USD Million) Forecast by End User, 2020-2035
  • Table 26: East Asia Market Value (USD Million) Forecast by Country, 2020-2035
  • Table 27: East Asia Market Value (USD Million) Forecast by Product Type , 2020-2035
  • Table 28: East Asia Market Value (USD Million) Forecast by Animal Type, 2020-2035
  • Table 29: East Asia Market Value (USD Million) Forecast by Application, 2020-2035
  • Table 30: East Asia Market Value (USD Million) Forecast by End User, 2020-2035
  • Table 31: South Asia and Pacific Market Value (USD Million) Forecast by Country, 2020-2035
  • Table 32: South Asia and Pacific Market Value (USD Million) Forecast by Product Type , 2020-2035
  • Table 33: South Asia and Pacific Market Value (USD Million) Forecast by Animal Type, 2020-2035
  • Table 34: South Asia and Pacific Market Value (USD Million) Forecast by Application, 2020-2035
  • Table 35: South Asia and Pacific Market Value (USD Million) Forecast by End User, 2020-2035
  • Table 36: Middle East & Africa Market Value (USD Million) Forecast by Country, 2020-2035
  • Table 37: Middle East & Africa Market Value (USD Million) Forecast by Product Type , 2020-2035
  • Table 38: Middle East & Africa Market Value (USD Million) Forecast by Animal Type, 2020-2035
  • Table 39: Middle East & Africa Market Value (USD Million) Forecast by Application, 2020-2035
  • Table 40: Middle East & Africa Market Value (USD Million) Forecast by End User, 2020-2035

List of Figures

  • Figure 1: Global Market Pricing Analysis
  • Figure 2: Global Market Value (USD Million) Forecast 2020-2035
  • Figure 3: Global Market Value Share and BPS Analysis by Product Type , 2025 and 2035
  • Figure 4: Global Market Y-o-Y Growth Comparison by Product Type , 2025-2035
  • Figure 5: Global Market Attractiveness Analysis by Product Type
  • Figure 6: Global Market Value Share and BPS Analysis by Animal Type, 2025 and 2035
  • Figure 7: Global Market Y-o-Y Growth Comparison by Animal Type, 2025-2035
  • Figure 8: Global Market Attractiveness Analysis by Animal Type
  • Figure 9: Global Market Value Share and BPS Analysis by Application, 2025 and 2035
  • Figure 10: Global Market Y-o-Y Growth Comparison by Application, 2025-2035
  • Figure 11: Global Market Attractiveness Analysis by Application
  • Figure 12: Global Market Value Share and BPS Analysis by End User, 2025 and 2035
  • Figure 13: Global Market Y-o-Y Growth Comparison by End User, 2025-2035
  • Figure 14: Global Market Attractiveness Analysis by End User
  • Figure 15: Global Market Value (USD Million) Share and BPS Analysis by Region, 2025 and 2035
  • Figure 16: Global Market Y-o-Y Growth Comparison by Region, 2025-2035
  • Figure 17: Global Market Attractiveness Analysis by Region
  • Figure 18: North America Market Incremental Dollar Opportunity, 2025-2035
  • Figure 19: Latin America Market Incremental Dollar Opportunity, 2025-2035
  • Figure 20: Western Europe Market Incremental Dollar Opportunity, 2025-2035
  • Figure 21: Eastern Europe Market Incremental Dollar Opportunity, 2025-2035
  • Figure 22: East Asia Market Incremental Dollar Opportunity, 2025-2035
  • Figure 23: South Asia and Pacific Market Incremental Dollar Opportunity, 2025-2035
  • Figure 24: Middle East & Africa Market Incremental Dollar Opportunity, 2025-2035
  • Figure 25: North America Market Value Share and BPS Analysis by Country, 2025 and 2035
  • Figure 26: North America Market Value Share and BPS Analysis by Product Type , 2025 and 2035
  • Figure 27: North America Market Y-o-Y Growth Comparison by Product Type , 2025-2035
  • Figure 28: North America Market Attractiveness Analysis by Product Type
  • Figure 29: North America Market Value Share and BPS Analysis by Animal Type, 2025 and 2035
  • Figure 30: North America Market Y-o-Y Growth Comparison by Animal Type, 2025-2035
  • Figure 31: North America Market Attractiveness Analysis by Animal Type
  • Figure 32: North America Market Value Share and BPS Analysis by Application, 2025 and 2035
  • Figure 33: North America Market Y-o-Y Growth Comparison by Application, 2025-2035
  • Figure 34: North America Market Attractiveness Analysis by Application
  • Figure 35: North America Market Value Share and BPS Analysis by End User, 2025 and 2035
  • Figure 36: North America Market Y-o-Y Growth Comparison by End User, 2025-2035
  • Figure 37: North America Market Attractiveness Analysis by End User
  • Figure 38: Latin America Market Value Share and BPS Analysis by Country, 2025 and 2035
  • Figure 39: Latin America Market Value Share and BPS Analysis by Product Type , 2025 and 2035
  • Figure 40: Latin America Market Y-o-Y Growth Comparison by Product Type , 2025-2035
  • Figure 41: Latin America Market Attractiveness Analysis by Product Type
  • Figure 42: Latin America Market Value Share and BPS Analysis by Animal Type, 2025 and 2035
  • Figure 43: Latin America Market Y-o-Y Growth Comparison by Animal Type, 2025-2035
  • Figure 44: Latin America Market Attractiveness Analysis by Animal Type
  • Figure 45: Latin America Market Value Share and BPS Analysis by Application, 2025 and 2035
  • Figure 46: Latin America Market Y-o-Y Growth Comparison by Application, 2025-2035
  • Figure 47: Latin America Market Attractiveness Analysis by Application
  • Figure 48: Latin America Market Value Share and BPS Analysis by End User, 2025 and 2035
  • Figure 49: Latin America Market Y-o-Y Growth Comparison by End User, 2025-2035
  • Figure 50: Latin America Market Attractiveness Analysis by End User
  • Figure 51: Western Europe Market Value Share and BPS Analysis by Country, 2025 and 2035
  • Figure 52: Western Europe Market Value Share and BPS Analysis by Product Type , 2025 and 2035
  • Figure 53: Western Europe Market Y-o-Y Growth Comparison by Product Type , 2025-2035
  • Figure 54: Western Europe Market Attractiveness Analysis by Product Type
  • Figure 55: Western Europe Market Value Share and BPS Analysis by Animal Type, 2025 and 2035
  • Figure 56: Western Europe Market Y-o-Y Growth Comparison by Animal Type, 2025-2035
  • Figure 57: Western Europe Market Attractiveness Analysis by Animal Type
  • Figure 58: Western Europe Market Value Share and BPS Analysis by Application, 2025 and 2035
  • Figure 59: Western Europe Market Y-o-Y Growth Comparison by Application, 2025-2035
  • Figure 60: Western Europe Market Attractiveness Analysis by Application
  • Figure 61: Western Europe Market Value Share and BPS Analysis by End User, 2025 and 2035
  • Figure 62: Western Europe Market Y-o-Y Growth Comparison by End User, 2025-2035
  • Figure 63: Western Europe Market Attractiveness Analysis by End User
  • Figure 64: Eastern Europe Market Value Share and BPS Analysis by Country, 2025 and 2035
  • Figure 65: Eastern Europe Market Value Share and BPS Analysis by Product Type , 2025 and 2035
  • Figure 66: Eastern Europe Market Y-o-Y Growth Comparison by Product Type , 2025-2035
  • Figure 67: Eastern Europe Market Attractiveness Analysis by Product Type
  • Figure 68: Eastern Europe Market Value Share and BPS Analysis by Animal Type, 2025 and 2035
  • Figure 69: Eastern Europe Market Y-o-Y Growth Comparison by Animal Type, 2025-2035
  • Figure 70: Eastern Europe Market Attractiveness Analysis by Animal Type
  • Figure 71: Eastern Europe Market Value Share and BPS Analysis by Application, 2025 and 2035
  • Figure 72: Eastern Europe Market Y-o-Y Growth Comparison by Application, 2025-2035
  • Figure 73: Eastern Europe Market Attractiveness Analysis by Application
  • Figure 74: Eastern Europe Market Value Share and BPS Analysis by End User, 2025 and 2035
  • Figure 75: Eastern Europe Market Y-o-Y Growth Comparison by End User, 2025-2035
  • Figure 76: Eastern Europe Market Attractiveness Analysis by End User
  • Figure 77: East Asia Market Value Share and BPS Analysis by Country, 2025 and 2035
  • Figure 78: East Asia Market Value Share and BPS Analysis by Product Type , 2025 and 2035
  • Figure 79: East Asia Market Y-o-Y Growth Comparison by Product Type , 2025-2035
  • Figure 80: East Asia Market Attractiveness Analysis by Product Type
  • Figure 81: East Asia Market Value Share and BPS Analysis by Animal Type, 2025 and 2035
  • Figure 82: East Asia Market Y-o-Y Growth Comparison by Animal Type, 2025-2035
  • Figure 83: East Asia Market Attractiveness Analysis by Animal Type
  • Figure 84: East Asia Market Value Share and BPS Analysis by Application, 2025 and 2035
  • Figure 85: East Asia Market Y-o-Y Growth Comparison by Application, 2025-2035
  • Figure 86: East Asia Market Attractiveness Analysis by Application
  • Figure 87: East Asia Market Value Share and BPS Analysis by End User, 2025 and 2035
  • Figure 88: East Asia Market Y-o-Y Growth Comparison by End User, 2025-2035
  • Figure 89: East Asia Market Attractiveness Analysis by End User
  • Figure 90: South Asia and Pacific Market Value Share and BPS Analysis by Country, 2025 and 2035
  • Figure 91: South Asia and Pacific Market Value Share and BPS Analysis by Product Type , 2025 and 2035
  • Figure 92: South Asia and Pacific Market Y-o-Y Growth Comparison by Product Type , 2025-2035
  • Figure 93: South Asia and Pacific Market Attractiveness Analysis by Product Type
  • Figure 94: South Asia and Pacific Market Value Share and BPS Analysis by Animal Type, 2025 and 2035
  • Figure 95: South Asia and Pacific Market Y-o-Y Growth Comparison by Animal Type, 2025-2035
  • Figure 96: South Asia and Pacific Market Attractiveness Analysis by Animal Type
  • Figure 97: South Asia and Pacific Market Value Share and BPS Analysis by Application, 2025 and 2035
  • Figure 98: South Asia and Pacific Market Y-o-Y Growth Comparison by Application, 2025-2035
  • Figure 99: South Asia and Pacific Market Attractiveness Analysis by Application
  • Figure 100: South Asia and Pacific Market Value Share and BPS Analysis by End User, 2025 and 2035
  • Figure 101: South Asia and Pacific Market Y-o-Y Growth Comparison by End User, 2025-2035
  • Figure 102: South Asia and Pacific Market Attractiveness Analysis by End User
  • Figure 103: Middle East & Africa Market Value Share and BPS Analysis by Country, 2025 and 2035
  • Figure 104: Middle East & Africa Market Value Share and BPS Analysis by Product Type , 2025 and 2035
  • Figure 105: Middle East & Africa Market Y-o-Y Growth Comparison by Product Type , 2025-2035
  • Figure 106: Middle East & Africa Market Attractiveness Analysis by Product Type
  • Figure 107: Middle East & Africa Market Value Share and BPS Analysis by Animal Type, 2025 and 2035
  • Figure 108: Middle East & Africa Market Y-o-Y Growth Comparison by Animal Type, 2025-2035
  • Figure 109: Middle East & Africa Market Attractiveness Analysis by Animal Type
  • Figure 110: Middle East & Africa Market Value Share and BPS Analysis by Application, 2025 and 2035
  • Figure 111: Middle East & Africa Market Y-o-Y Growth Comparison by Application, 2025-2035
  • Figure 112: Middle East & Africa Market Attractiveness Analysis by Application
  • Figure 113: Middle East & Africa Market Value Share and BPS Analysis by End User, 2025 and 2035
  • Figure 114: Middle East & Africa Market Y-o-Y Growth Comparison by End User, 2025-2035
  • Figure 115: Middle East & Africa Market Attractiveness Analysis by End User
  • Figure 116: Global Market - Tier Structure Analysis
  • Figure 117: Global Market - Company Share Analysis
Dashboard
Dashboard
Dashboard
Dashboard
Dashboard
Dashboard

Full Research Suite comprises of:

Market outlook & trends analysis

Market outlook & trends analysis

Interviews & case studies

Interviews & case studies

Strategic recommendations

Strategic recommendations

Vendor profiles & capabilities analysis

Vendor profiles & capabilities analysis

5-year forecasts

5-year forecasts

8 regions and 60+ country-level data splits

8 regions and 60+ country-level data splits

Market segment data splits

Market segment data splits

12 months of continuous data updates

12 months of continuous data updates

DELIVERED AS:

PDF EXCEL ONLINE

Full Research Suite


$5000

$7500

$10000

Buy Report Now
Similar Industry Reports

Similar Industry Reports

Veterinary Allergy Diagnostics Market

Veterinary Allergy Diagnostics Market Size and Share Forecast Outlook 2025 to 2035

Veterinary TSE Testing Market

Veterinary TSE Testing Market Size and Share Forecast Outlook 2025 to 2035

Veterinary Dermatology Market

Veterinary Dermatology Market Forecast Outlook 2025 to 2035

Veterinary Telemedicine Market

Veterinary Telemedicine Market Size and Share Forecast Outlook 2025 to 2035

Veterinary Dietary Supplements Market

Veterinary Dietary Supplements Market Size and Share Forecast Outlook 2025 to 2035

Veterinary CRISPR-Based Detection Kits Market

Veterinary CRISPR-Based Detection Kits Market Size and Share Forecast Outlook 2025 to 2035

Veterinary Pregnancy Test Kit Market

Veterinary Pregnancy Test Kit Market Forecast and Outlook 2025 to 2035

Veterinary X-Ray Illuminators Market

Veterinary X-Ray Illuminators Market Size and Share Forecast Outlook 2025 to 2035

Veterinary Scales Market

Veterinary Scales Market Size and Share Forecast Outlook 2025 to 2035

Veterinary Grooming Aids Market

Veterinary Grooming Aids Market Size and Share Forecast Outlook 2025 to 2035

Veterinary Micro-fibre Endoscope Market

Veterinary Micro-fibre Endoscope Market Size and Share Forecast Outlook 2025 to 2035

Veterinary Faecal Filters Market

Veterinary Faecal Filters Market Size and Share Forecast Outlook 2025 to 2035

Veterinary Dental Equipment Market

Veterinary Dental Equipment Market Size and Share Forecast Outlook 2025 to 2035

Veterinary Rapid Test Market

Veterinary Rapid Test Market Size and Share Forecast Outlook 2025 to 2035

Veterinary Therapeutic Diet Market

Veterinary Therapeutic Diet Market Size and Share Forecast Outlook 2025 to 2035

Veterinary Glucometers Market

Veterinary Glucometers Market Size and Share Forecast Outlook 2025 to 2035

Veterinary Pain Management Drugs Market

Veterinary Pain Management Drugs Market Size and Share Forecast Outlook 2025 to 2035

Veterinary Anesthesia Machines Market

Veterinary Anesthesia Machines Market Size and Share Forecast Outlook 2025 to 2035

Veterinary Thermography Market

Veterinary Thermography Market Size and Share Forecast Outlook 2025 to 2035

Veterinary Respiratory Disease Treatment Market

Veterinary Respiratory Disease Treatment Market Size and Share Forecast Outlook 2025 to 2035

Future Market Insights

Veterinary Imaging Market

Chat With MaRIA

Chat With

MaRIA

Hi There, I am MaRIA, Your Market Research Intelligence Assistant. How may I help you?