The Veterinary Point of Care Diagnostics market is witnessing consistent expansion driven by the rising awareness of animal health and the growing emphasis on rapid diagnostic solutions. The increasing number of companion animals, coupled with the heightened focus on preventive care, has significantly influenced market growth. Advancements in diagnostic technologies such as portable analyzers, immunodiagnostics, and molecular testing have enhanced the accessibility and accuracy of veterinary diagnostics.
The market outlook remains positive as veterinary clinics and hospitals continue to adopt decentralized testing models to enable faster clinical decisions. The rising prevalence of zoonotic diseases and the demand for early disease detection are also propelling the adoption of point of care testing devices.
Furthermore, increasing investments in veterinary infrastructure, digital integration in diagnostic workflows, and expanding pet insurance coverage are supporting long-term growth As pet ownership rises globally and veterinarians prioritize precision-based diagnostic approaches, the market is expected to maintain strong growth momentum across developed and emerging economies.
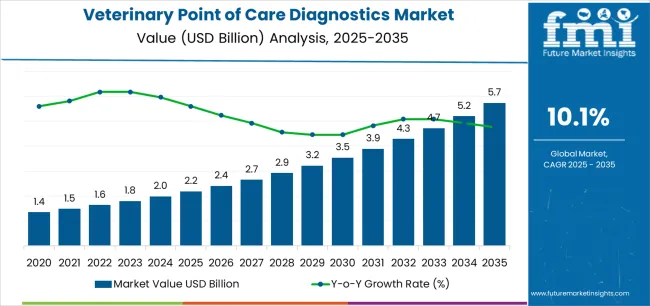
| Metric | Value |
|---|---|
| Veterinary Point of Care Diagnostics Market Estimated Value in (2025 E) | USD 2.2 billion |
| Veterinary Point of Care Diagnostics Market Forecast Value in (2035 F) | USD 5.7 billion |
| Forecast CAGR (2025 to 2035) | 10.1% |
The market is segmented by Animal, Product, Sample, and Testing and region. By Animal, the market is divided into Companion Animals and Livestock Animals. In terms of Product, the market is classified into Consumables, Reagents & Kits and Instruments & Devices. Based on Sample, the market is segmented into Blood/Plasma/Serum, Urine, Fecal, and Other Sample Type. By Testing, the market is divided into Hematology, Diagnostic Imaging, Bacteriology, Virology, Cytology, Clinical Chemistry, Parasitology, Serology, and Other Testing Type. Regionally, the market is classified into North America, Latin America, Western Europe, Eastern Europe, Balkan & Baltic Countries, Russia & Belarus, Central Asia, East Asia, South Asia & Pacific, and the Middle East & Africa.
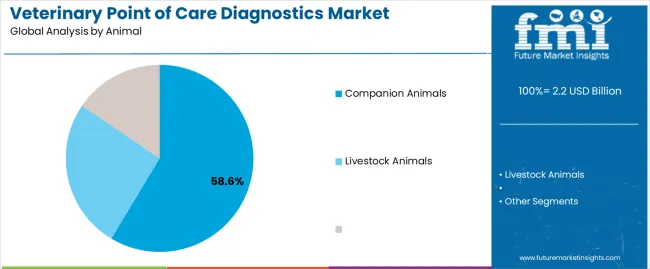
The companion animals segment is projected to hold 58.60% of the Veterinary Point of Care Diagnostics market revenue share in 2025, establishing it as the leading animal category. This segment’s dominance has been driven by the increasing humanization of pets and the rising focus on ensuring their health and longevity. Companion animals such as dogs and cats receive regular veterinary attention, which has amplified the demand for point of care diagnostic solutions.
Growing pet ownership in urban regions and rising disposable incomes have further supported the increased spending on pet healthcare. The availability of portable diagnostic devices and rapid testing kits has enabled veterinarians to provide immediate results, enhancing treatment efficiency.
Moreover, the growing prevalence of infectious and chronic diseases in pets and the awareness regarding preventive healthcare measures have accelerated diagnostic adoption The combination of technological advancements, increasing pet adoption rates, and higher healthcare expenditure is expected to continue driving the leadership of the companion animals segment.
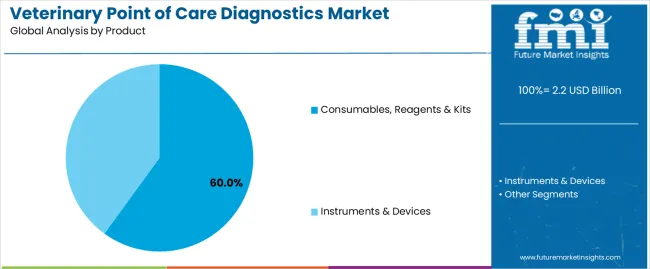
The consumables, reagents and kits segment is expected to capture 60.00% of the Veterinary Point of Care Diagnostics market revenue share in 2025, making it the most dominant product category. This segment’s growth has been supported by the frequent and recurring need for consumable supplies in diagnostic procedures. The growing reliance on immunodiagnostic and hematology testing methods has increased the usage of reagents and kits.
The ease of use, affordability, and accessibility of these products have made them highly preferred in veterinary clinics and laboratories. Advancements in assay development and the shift toward faster, more reliable detection methods have strengthened demand. The trend toward routine diagnostic monitoring for pets has also elevated the consumption of these materials.
Furthermore, the introduction of species-specific and high-sensitivity diagnostic kits has improved diagnostic outcomes, promoting adoption The recurring nature of consumables use combined with expanding diagnostic capabilities positions this segment as a major revenue contributor within the market.
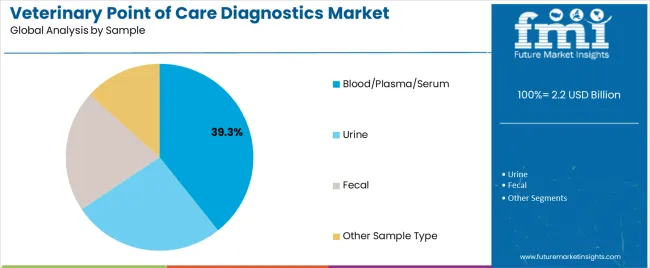
The blood, plasma, and serum segment is projected to account for 39.30% of the Veterinary Point of Care Diagnostics market revenue in 2025, making it a leading sample type. The dominance of this segment is attributed to the high diagnostic value and reliability of blood-based testing in detecting various diseases and health conditions. These samples are preferred for their ability to provide comprehensive insights into an animal’s physiological and biochemical health.
The increasing use of hematology, biochemistry, and immunoassay testing has reinforced the demand for blood-based diagnostics. The segment’s growth is further supported by advancements in microfluidic technologies and portable analyzers that facilitate rapid and accurate testing at the point of care.
The rise in preventive health checkups and the need for early disease identification have also fueled the utilization of blood, plasma, and serum samples As diagnostic precision becomes a core focus of veterinary healthcare, this segment continues to maintain a strong position within the overall market.
The below table presents the expected CAGR for the global veterinary point of care diagnostics market over several semi-annual periods spanning from 2025 to 2035. In the first half (H1) of the decade from 2025 to 2035, the business is predicted to surge at a CAGR of 11.4%, followed by a slightly lower growth rate of 10.8% in the second half (H2) of the same decade.
| Particular | Value CAGR |
|---|---|
| H1 | 11.4% (2025 to 2035) |
| H2 | 10.8% (2025 to 2035) |
| H1 | 10.1% (2025 to 2035) |
| H2 | 9.8% (2025 to 2035) |
The above table presents the expected CAGR for the global veterinary point of care diagnostics market over several semi-annual periods spanning from 2025 to 2035. In the first half (H1) of the decade from 2025 to 2035, the business is predicted to surge at a CAGR of 11.4%, followed by a slightly decline in growth rate of 10.8% in the second half (H2) of the same decade.
Moving into the subsequent period, from H1 2025 to H2 2035, the CAGR is projected to decrease slightly to 10.1% in the first half and increase moderately at 9.8% in the second half. In the first half (H1) the market witnessed an increase of -130.00 BPS while in the second half (H2), the market witnessed a decrease of -110.00 BPS.
Increased Consumer Spending on Veterinary Care Drives the Growth of the Market.
The American Pet Products Association reports that spending for veterinary care has increased at a rate higher than that of GDP over the past two years. With the climbing numbers of pet owners, total spend on veterinary point of care diagnosis surges, which markedly boosts expenditure per pet.
This increase in consumer spending for veterinary care reflects almost an unconscious shift in societal attitude towards pets. Increased awareness thus reflects in how preventive medicine, advanced treatments, and veterinary point of care diagnosis can help safeguard the well-being and long life of beloved companions.
According to the, American Pet Products Association 2025 insights, the projected expenditure on USA pet industry for 2025 is forecasted to rise from USD 2.2.0 billion in 2025 to USD 2.2 billion. With the estimated sales for 2025 break out as: Pet Food & Treats, USD 66.9 billion; Supplies, Live Animals & OTC Medicine, USD 32.0 billion; Veterinary Care & Product Sales, USD 39.1 billion; Other Services, USD 12.6 billion.
This rise in consumer spending in relation to veterinary care underlines the changed role that pets play in our lives and a raising awareness that they are important members of our families. With the actions of a responsible owner who wants better health for his or her furry pet, demand for advanced treatments and veterinary point of care diagnosis just keeps on growing.
The Demand for Veterinary POC Diagnostics Is Likely to Increase Due to Contineous Rise in Livestock Diseases.
The increasing number of livestock diseases is a major issue globally. Some of those include Foot-and-Mouth Disease (FMD), African Swine Fever (ASF), Avian Influenza, and Bovine Tuberculosis. Such diseases spread so fast in individual animal populations and between different populations of livestock, resulting in devastating economic losses.
This has especially strong economic effects in the developing world, where livestock farming is one of the main sources of livelihood for millions of smallholder farmers. Should their animals die from disease. More than this, spillover risks to human populations from zoonotic diseases already prevalent in the region raise a big case for public health.
The COVID-19 pandemic further brings out the need for robust monitoring systems and control of animal diseases since so many infectious diseases in humans are actually of animal origin.
Besides, innovations in technologies of advanced diagnosis, such as molecular diagnostics, biosensors, and portable polymerase chain reaction devices, have dramatically improved the accuracy and reliability of POC tests.
In conclusion, this rise in livestock diseases underlines more than ever the pressing requirement for point-of-care diagnostic tools that are rapid and effective. These diagnostic tools will help in preventing the spread of infectious diseases.
The Rise of Pet Insurance in Matured Economies Is a Significant Trend Shaping the Veterinary Point of Care (POC) Diagnostics Market.
Pet owners in mature economies seek protection against the escalating veterinary treatment costs by applying for a pet insurance policy. In countries such as Sweden and the United Kingdom, the penetration rate is usually very high, usually at a rate that covers significant numbers of pets under insurance plans.
In the United States and Canada, although the penetration rate is lower compared to some European countries, the trend of its growth is progressive and fueled by increased awareness of the benefits that come with pet insurance, coupled with humanization.
Owners are much more likely to agree to diagnostic testing, despite otherwise being unaffordable to them. This is increasingly found to be the case in POC diagnostics, which have an added benefit of delivering results rapidly and thus allow a veterinarian to make prompt decisions on treatment.
It makes the pet owners more proactive toward health problems for their pets. Regular checkups and the early detection of possible health issues become common practice; this increases the demand for veterinary POC diagnostic tools that would be applied during routine visits for early stage condition detection.
Dearth of Awareness and Training Among Veterinarians is a Significant Restraint in The Widespread Adoption of Point of Care (POC) Diagnostics.
The biggest challenge is that many veterinarians are not even aware of the current state of advancements regarding POC diagnostic technologies. The veterinary field is changing rapidly, and new diagnostic tools come out on a continuous basis.
Many times, veterinarians may be very familiar with conventional methods of diagnosis and have been using these for a number of years. The comfort and familiarity with them will give them pause when it comes to the adoption of new technologies, especially if they do not realize that today's point-of-care diagnostics have dramatically improved accuracy, speed, and convenience.
These programs are also not consistently available. Those veterinarians in urban centers or those affiliated with large veterinary hospitals may better be able to attend workshops, conferences, and continuing education courses that take up the latest in diagnostic technologies.
Inadequate awareness and insufficient training go together in having an adverse effect on the uptake of POC diagnostics in veterinary practice.
POC diagnostic tool developers could themselves become much more involved in providing training and education to veterinarians, mainly in rural and underserved areas. This includes web-based training modules and webinars, and hands-on workshops oriented toward familiarizing veterinarians with new technologies.
The global veterinary point of care diagnostics industry recorded a CAGR of 8.3% during the historical period between 2020 and 2025. The growth of veterinary point of care diagnostics industry was positive as it reached a value of USD 1,805.2 million in 2025 from USD 1,170.5 million in 2020.
The Veterinary Point of Care (PoC) Diagnostics market has seen several evolutionary changes over the years. The market initially had the prevalence of basic, manual diagnostic tools like urine dipsticks and blood smear tests, introduced primarily for large animals because of the economic importance related to livestock health. Diagnostics for companion animals were restricted to a great extent and situated more in laboratories.
With the technological innovations in human health into veterinary medicine, more-sophisticated tools for PoC diagnostics were made. Portable blood chemistry and hematology analyzers were made available to veterinary clinics to run full laboratory tests within the clinic premises.
The Veterinary Point of Care Diagnostic market is seeing accelerated growth with modern technological innovations, particularly in devices at the point of care. Portable and handheld diagnostic devices are becoming more advanced to equip multi-parameter testing capabilities.
These devices can now complete a host of tests, from blood chemistry and hematology to advanced imaging, within minutes, making diagnostics simple and easy in numerous veterinary settings.
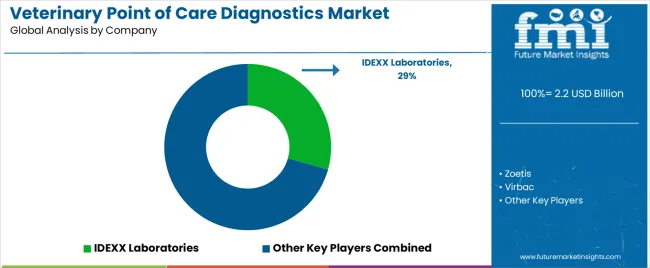
Tier 1 companies comprise market leaders with a market revenue of above USD 100 million capturing significant market share of 38.9% in global market. Manufacturing of innovative, sensitive, high-quality, and accurate diagnostic tools has been the major strategic focus of Tier 1 companies.
They invest interestingly high amounts in research and development to set new breakthrough technologies. Prominent companies in tier 1 include IDEXX Laboratories, Zoetis, Virbac and Thermo Fisher Scientific, Inc.
Tier 2 companies include mid-size players with revenue of USD 50 to 100 million having presence in specific regions and highly influencing the local market and holds around 40.2% market share. These firms specialize in specific niches within the veterinary diagnostics business area; for example, particular diseases or diagnostic technologies. Prominent companies in tier 2 include Heska Corporation, Neogen Corporation and Mindray.
Finally, Tier 3 companies, such as Esaote SpA, FUJIFILM Corporation, Woodley Equipment Company Ltd. They specialize in specific products and cater to niche markets, adding diversity to the industry.
Overall, while Tier 1 companies are the primary drivers of the market, Tier 2 and 3 companies also make significant contributions, ensuring the veterinary point of care diagnostics sales remains dynamic and competitive.
The section below covers the industry analysis for the veterinary point of care diagnostics market for different countries. Market demand analysis on key countries in several regions of the globe, including North America, Asia Pacific, Europe, and others, is provided.
The United States is anticipated to remain at the forefront in North America, with higher market share through 2035. In Asia Pacific, India is projected to witness a CAGR of 11.4% by 2035.
| Country | Value CAGR (2025 to 2035) |
|---|---|
| USA | 3.1% |
| Germany | 3.1% |
| China | 10.1% |
| France | 5.1% |
| India | 11.4% |
| Spain | 5.9% |
| Australia | 4.6% |
| South Korea | 8.0% |
USA veterinary point of care diagnostics market is poised to exhibit a CAGR of 3.1% between 2025 and 2035. Currently, it holds the highest share in the North American market, and the trend is expected to continue during the forecast period.
With the high rate of pet ownership in the USA and many other households owning pets, there is subsequent demand for comprehensive veterinary care, including advanced diagnostic services.
As more and more pet owners wish to seek quick and accurate health assessment for their animals, need keeps increasing for sophisticated point-of-care diagnostics. Moreover, dense networking of veterinary clinics, hospitals, and specialty centers across the USA is well-fitted with efficient diagnostic tools.
In conclusion, the USA veterinary point-of-care diagnostics market is an advanced technology, high pet ownership, strong veterinary network, high investment in innovation, and very encouraging regulatory environment.
China veterinary point of care diagnostics market is poised to exhibit a CAGR of 10.1% between 2025 and 2035. Currently, it holds the highest share in the East Asia market, and the trend is expected to continue during the forecast period.
China is already investing in the education and training of veterinarians, enhancing the capacity to apply modern diagnostic technologies. In addition, improved training programs are available to ensure veterinarians are competent not only to operate the POC diagnostic tools but also to interpret the results, hence driving adoption and effective use in clinical settings.
Manufacturing base: Due to its strong manufacturing base, local production of POC diagnostic devices is possible in China at very competitive prices. The reduction of costs associated with state-of-the-art diagnostic tools by local production makes them more reachable to veterinary practices across the country. This competitive pricing strategy also makes it possible for the adoption of these technologies.
India’s veterinary point of care diagnostics market is poised to exhibit a CAGR of 11.4% between 2025 and 2035. Currently, it holds the highest share in the Asia Pacific market, and the trend is expected to continue during the forecast period.
The government of India is aiming to upgrade the veterinary healthcare system in rural parts of the country through the implementation of the National Animal Disease Control Program me, infrastructure development in animal health, financial support for such development, and disease surveillance by states, among others.
Veterinary healthcare in the rural areas has also been a prominent area of investment by the private players and the NGOs. Part of this is establishing veterinary clinics, mobile health units, and diagnostic centers equipped with point-of-care technologies.
By targeting underserved areas, these initiatives help bridge the gap between urban and rural veterinary services, making advanced diagnostics more accessible to farmers and pet owners in remote regions.
The section contains information about the leading segments in the industry. By animal the companion animals segment holds the highest market share of 58.6% in 2025.
| By Animal | Companion Animals |
|---|---|
| Value Share (2025) | 58.6% |
The increase in pet ownership, primarily within urban and suburban regions, creates an extensive demand for veterinary services. In essence, this implies an increased investment in the health sectors of these animals, as more and more consideration is taken with regard to companion animals such as dogs and cats being members of families.
This trend thus calls for advanced diagnostic tools that give accurate results quickly, driving their demand.
This has made pet owners more willing to spend on high-quality veterinary services, including diagnostics. The more aware people become about the well-being of their pets, the greater the tendency to invest in both preventive care and early disease detection.
Modern pet owners often prefer high-tech solutions to the health issues of their pets just as they demand more advanced technologies to be used in their medical cares. POC diagnostics have advanced over the years to provide cutting-edge diagnostic capabilities, which contribute to the advantage they hold with reference to the market.
| By Sample | Blood/Plasma/Serum |
|---|---|
| Value Share (2035) | 39.3% |
Blood, plasma, and serum samples give valuable diagnostic information about most diseases in animals. They are imperative in investigations assessing organ function, detecting infections, monitoring progress of disease, and, generally, to the evaluation of an animal's health status.
That significant data can be obtained from these biological fluids places them at the very center of veterinary diagnostics.
Blood, plasma, and serum-based tests are believed to be accurate and reliable. Modern diagnostic tools at the POC, which have the ability to accurately analyze blood, plasma, and serum samples within a short time, support this important component of treatment and management decisions.
This is more critical for diseases where diagnosis is urgently required. Tests using blood, plasma, and serum are applicable across a broad spectrum of conditions, from infectious diseases and metabolic disorders to cancer and hormonal imbalances.
The Blood/Plasma/Serum segment leads the veterinary point of care diagnostics market by sample due to its comprehensive diagnostic capabilities, accuracy, ease of collection, wide application range, and the impact of technological advancements.
Market players are using different strategies in order to stay competitive in their respective markets, such as with innovative formulations, differentiation of products, and through strategic tie-ups with healthcare providers in an effort to increase distribution.
Other key strategic areas of focus for these companies would be an active search for strategic partners that will further reinforce their product portfolios and increase their global market presence.
Recent Industry Developments in Veterinary Point of Care Diagnostics Market
In terms of animal type, the industry is divided into companion animals- (dogs, cats, horses, other companion animals) and livestock animals- (cattle, swine, poultry, other livestock animals).
In terms of product, the industry is segregated into- consumables, reagents, & kits and instruments & devices.
In terms of sample, the industry is segregated into- blood/plasma/serum, urine, fecal and other sample type.
In terms of testing, the industry is segregated into- hematology, diagnostic imaging, bacteriology, virology, cytology, clinical chemistry, parasitology, serology and other testing type.
Key countries of North America, Latin America, Western Europe, Eastern, South Asia, East Asia and Middle East and Africa (MEA) have been covered in the report.
The global veterinary point of care diagnostics market is estimated to be valued at USD 2.2 billion in 2025.
The market size for the veterinary point of care diagnostics market is projected to reach USD 5.7 billion by 2035.
The veterinary point of care diagnostics market is expected to grow at a 10.1% CAGR between 2025 and 2035.
The key product types in veterinary point of care diagnostics market are companion animals, cats, dogs, horses, other companion animals, livestock animals, cattle, swine and poultry.
In terms of product, consumables, reagents & kits segment to command 60.0% share in the veterinary point of care diagnostics market in 2025.


Our Research Products

The "Full Research Suite" delivers actionable market intel, deep dives on markets or technologies, so clients act faster, cut risk, and unlock growth.

The Leaderboard benchmarks and ranks top vendors, classifying them as Established Leaders, Leading Challengers, or Disruptors & Challengers.

Locates where complements amplify value and substitutes erode it, forecasting net impact by horizon

We deliver granular, decision-grade intel: market sizing, 5-year forecasts, pricing, adoption, usage, revenue, and operational KPIs—plus competitor tracking, regulation, and value chains—across 60 countries broadly.

Spot the shifts before they hit your P&L. We track inflection points, adoption curves, pricing moves, and ecosystem plays to show where demand is heading, why it is changing, and what to do next across high-growth markets and disruptive tech

Real-time reads of user behavior. We track shifting priorities, perceptions of today’s and next-gen services, and provider experience, then pace how fast tech moves from trial to adoption, blending buyer, consumer, and channel inputs with social signals (#WhySwitch, #UX).

Partner with our analyst team to build a custom report designed around your business priorities. From analysing market trends to assessing competitors or crafting bespoke datasets, we tailor insights to your needs.
Supplier Intelligence
Discovery & Profiling
Capacity & Footprint
Performance & Risk
Compliance & Governance
Commercial Readiness
Who Supplies Whom
Scorecards & Shortlists
Playbooks & Docs
Category Intelligence
Definition & Scope
Demand & Use Cases
Cost Drivers
Market Structure
Supply Chain Map
Trade & Policy
Operating Norms
Deliverables
Buyer Intelligence
Account Basics
Spend & Scope
Procurement Model
Vendor Requirements
Terms & Policies
Entry Strategy
Pain Points & Triggers
Outputs
Pricing Analysis
Benchmarks
Trends
Should-Cost
Indexation
Landed Cost
Commercial Terms
Deliverables
Brand Analysis
Positioning & Value Prop
Share & Presence
Customer Evidence
Go-to-Market
Digital & Reputation
Compliance & Trust
KPIs & Gaps
Outputs
Full Research Suite comprises of:
Market outlook & trends analysis
Interviews & case studies
Strategic recommendations
Vendor profiles & capabilities analysis
5-year forecasts
8 regions and 60+ country-level data splits
Market segment data splits
12 months of continuous data updates
DELIVERED AS:
PDF EXCEL ONLINE
Point-of-Care Diagnostics Market Size and Share Forecast Outlook 2025 to 2035
Veterinary Point of Care Market Trends and Forecast 2025 to 2035
Point-of-care Molecular Diagnostics Market Insights – Trends & Growth 2025 to 2035
Point-of-Care Fentanyl Test Kits Market Size and Share Forecast Outlook 2025 to 2035
Point-of-Care Opioid Testing Market Size and Share Forecast Outlook 2025 to 2035
Point-of-Care Food Sensitivity Testing Market Size and Share Forecast Outlook 2025 to 2035
Point-Of-Care Breathalyzer Market Size and Share Forecast Outlook 2025 to 2035
Point Of Care Blood Testing Devices Market Size and Share Forecast Outlook 2025 to 2035
Point-of-care Cholesterol Monitoring Device Market Size and Share Forecast Outlook 2025 to 2035
Point Of Care Infection Control Market
Point-Of-Care Genetic Testing Market
Point Of Care CT Imaging Market
Veterinary Eye Care Market Size and Share Forecast Outlook 2025 to 2035
Veterinary Home Diagnostics Market
Veterinary Wound Care Market Growth – Trends & Forecast 2023-2033
Veterinary Allergy Diagnostics Market Size and Share Forecast Outlook 2025 to 2035
Veterinary Molecular Diagnostics Market Growth - Trends & Forecast 2025 to 2035
Veterinary Palliative Care Management Market
Critical Care Diagnostics Market Size and Share Forecast Outlook 2025 to 2035
Network Point-of-Care Glucose Testing Market Size and Share Forecast Outlook 2025 to 2035

Thank you!
You will receive an email from our Business Development Manager. Please be sure to check your SPAM/JUNK folder too.
Chat With
MaRIA