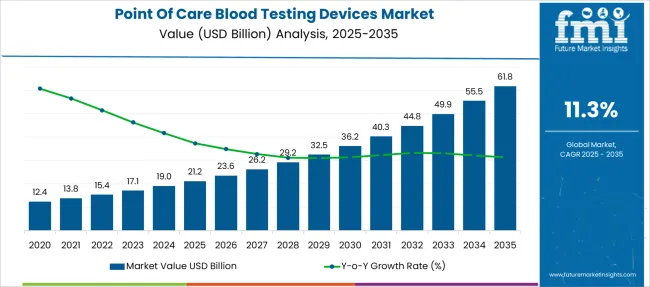
The Point Of Care Blood Testing Devices Market is estimated to be valued at USD 21.2 billion in 2025 and is projected to reach USD 61.8 billion by 2035, registering a compound annual growth rate (CAGR) of 11.3% over the forecast period.
| Metric | Value |
|---|---|
| Point Of Care Blood Testing Devices Market Estimated Value in (2025 E) | USD 21.2 billion |
| Point Of Care Blood Testing Devices Market Forecast Value in (2035 F) | USD 61.8 billion |
| Forecast CAGR (2025 to 2035) | 11.3% |
The point of care blood testing devices market is expanding rapidly due to the increasing demand for quick and accurate diagnostic tools at patient locations. The rise of chronic diseases like diabetes has heightened the need for immediate blood glucose monitoring, encouraging healthcare providers to adopt portable analyzers. Technological improvements have enabled hand-held devices to deliver reliable results with user-friendly interfaces.
Healthcare facilities, especially hospitals, are integrating point of care devices into their workflow to reduce turnaround times and improve patient management. Growing awareness about early disease detection and the shift towards decentralized healthcare models have also contributed to market growth.
Future opportunities are expected to arise from advancements in device connectivity, data integration, and miniaturization. Market segments are anticipated to be driven by diabetes POC analyzers, hand-held device technology, and hospital distribution channels, reflecting demand for efficient and accessible diagnostics.
The market is segmented by Product Type, Technology, and Distribution Channels and region. By Product Type, the market is divided into Diabete POC Analyzer, Coaglulation POC Analyzer, POC Blood Analyzer, and Hematology POC Reader. In terms of Technology, the market is classified into Hand-held Devices, Printer Devices, and Touch-Screen Devices. Based on Distribution Channels, the market is segmented into Hospitals, Retail Prices, Clinics, Health Centers, and Homecare Settings. Regionally, the market is classified into North America, Latin America, Western Europe, Eastern Europe, Balkan & Baltic Countries, Russia & Belarus, Central Asia, East Asia, South Asia & Pacific, and the Middle East & Africa.
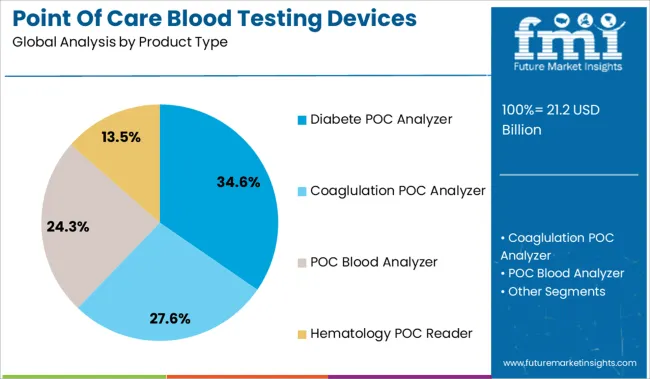
The Diabetes POC Analyzer segment is expected to hold 34.6% of the market revenue in 2025, remaining the largest product category. The segment’s growth is attributed to the widespread prevalence of diabetes and the critical need for frequent blood glucose monitoring. These analyzers provide timely and actionable data that supports patient self-management and clinical decision-making.
Their portability and ease of use allow for application in various healthcare settings including outpatient clinics and home care. Increasing patient awareness and healthcare initiatives aimed at diabetes management have bolstered demand.
Additionally, improvements in accuracy and device affordability have expanded their adoption globally.
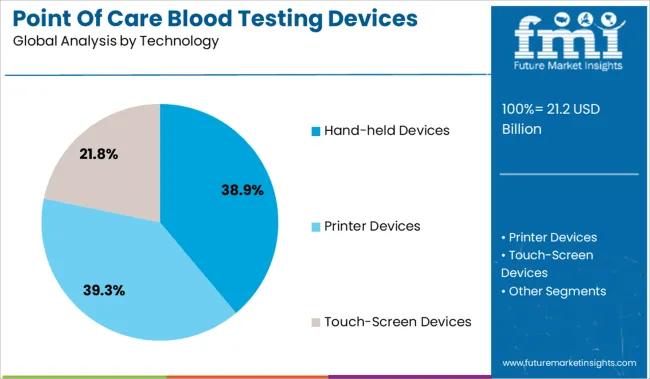
Hand-held devices are projected to account for 38.9% of the market revenue in 2025, dominating the technology segment. The convenience of portability and rapid test results have made hand-held devices highly preferred among healthcare professionals and patients alike. They facilitate immediate clinical decisions, reducing the need for centralized laboratory testing.
Continuous technological innovations have enhanced the sensitivity and specificity of these devices while maintaining user-friendly designs.
The growing trend of remote patient monitoring and telehealth services further supports the hand-held device segment’s growth.
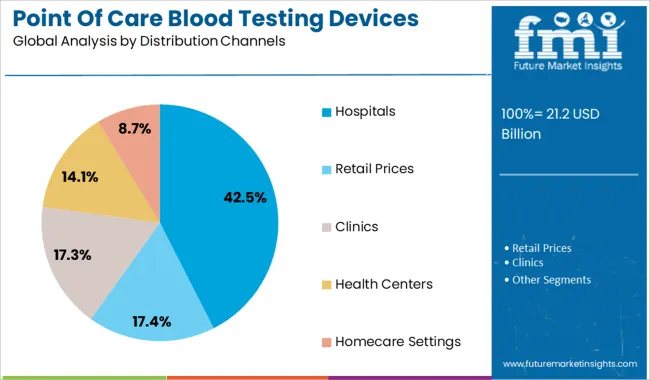
The Hospitals segment is anticipated to contribute 42.5% of the market revenue in 2025, maintaining its position as the leading distribution channel. Hospitals have increasingly integrated point of care blood testing devices into their diagnostic workflows to expedite patient treatment and improve outcomes. The ability to perform rapid tests at the bedside supports critical care and emergency medicine applications.
Furthermore, hospitals benefit from bulk purchasing agreements and training programs that enhance device utilization.
As healthcare systems prioritize efficient patient management and shorter hospital stays, the demand for point of care devices in hospital settings is expected to remain strong.
The demand for point of care blood testing devices is anticipated to rise as the changing lifestyle of the people has made the population go vigilant about their lifestyle diseases. Due to this, people prefer having the tests done in their household, without the hassle of visiting the diagnostic centres, boosting the sales of point of care blood testing devices.
Due to rising demand for portable monitoring devices, the point of care blood testing devices market share is projected to rise rapidly throughout 2035.
The adoption of point of care blood testing devices especially in the population with chronic conditions is contributing to the growth of the point of care blood testing devices market size.
Moreover, it is anticipated that there is an increased awareness among the population regarding diabetes in adults and children. Therefore, the key drivers boosting the sales of point of care blood testing devices are the increasing incidence of diabetes and different types of medical tests.
Furthermore, technological advances and recent trends in point of care blood testing devices market like point of care blood testing analyser and point of care diabetes analyzers are expected to foster the point of care blood testing devices market expansion.
A significant increase in infectious diseases contributes to the rise in demand for point of care blood testing devices, aiding towards a faster cure, and growing advantages of convenience like portability, transportable test kits, high accuracy levels, and availability of quicker results are likely to drive the point of care blood testing devices market outlook in a positive direction.
Initiatives by government and research grants extended in the developing countries are also to fuel the market and serve as a key driver propelling the sales of point of care blood testing devices during the forecast period.
Although the point of care blood testing devices can be used at a range of locations like emergency departments, healthcare practitioners’ offices, ambulances, accident scenes, emergency departments, and more, a lack of expertise, knowledge, and experience in using these technologies can act as a restraint to the point of care blood testing devices market growth. Furthermore, a high cost of product development is anticipated to slow down the overall expansion of the point of care blood testing devices market.
Depending on the type and nature of the sample or test, the product design needs to consider numerous areas of engineering application and technology. Hence, leads to an integration of the cartridge with the instrument for testing requiring a higher degree of coupling between the two components. This is noted to increase the overall product development cost, thereby impeding the industry landscape.
Moreover, the biomolecules used in developing POC tests are complex in nature and are expensive, which in turn, are anticipated to hamper the point of care blood testing devices market growth.
It is anticipated that North America is going to lead the market for point of care blood testing devices. Currently, the North American region contributes 33.4% of the total share of point of care blood testing devices market.
Due to the increasing rate of mortality caused by diabetes in this region and changes in the lifestyle habits people are inclining more toward the adoption of point of care blood testing devices. These factors coupled with an ageing population are expected to boost the market size of point of care blood testing devices over the analysis period.
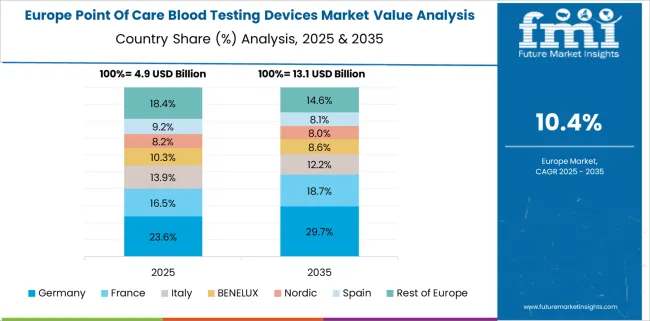
The European market share is expected to follow the North American regions. Currently, Europe is accountable for 29.4% of the total market share of point of care blood testing devices.
The business landscape in Europe is driven by the expansion of the hospital industry, diagnostic centers, research laboratories and homecare settings in this region. Due to high incidence and prevalence of chronic diseases, there is a surge in the number of hospitalized patients, which is bolstering the market growth of point of care blood testing devices in Europe.
How are New Entrants Revolutionizing the Point of Care Blood Testing Devices Market?
The start-up ecosystem in the point of care blood testing market is intense with frequent innovations being made. Start-ups in the point of care blood testing market are focusing on improvising the devices and techniques of blood testing for faster results and convenience for the patients.
The US-based start-up Hememics develops a point of care platform to rapidly identify infectious disease pathogens. The platform uses a single nasal swab or a drop of blood to test and measure specific antibody and antigen signals. The entire testing process takes under 60 seconds, tests for up to 17 different pathogens, and provides real-time diagnostics to healthcare workers and alerts for health agencies.
Indian start-up Docturnal specializes in the development of a non-invasive point of care diagnostic solution. The low-cost and non-invasive solution uses AI and deep learning for the early and proactive detection of TB biomarkers and symptoms.
Singaporean start-up Biosensorix focuses on the development of low-cost and effective point of care blood testing solutions. The start-up’s immune assay-based platform, ELLI, detects biomarkers and pathogens.
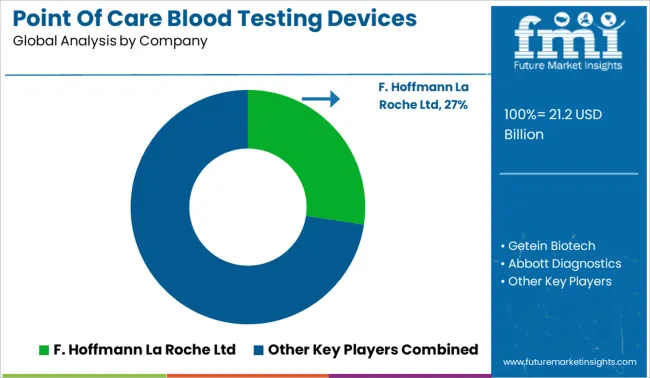
Who are the Key Players in the Point of Care Blood Testing Devices Market?
Some of the major players in the point of care blood devices testing market are: Abaxis, Abbott Laboratories, Accubiotech Co, Ltd., ACON Laboratories, Inc, Becton, Dickinson and Company, Biolytical Laboratories, Danaher Corporation (HemoCue), Siemens Healthineers and Meridian Bioscience, Inc.
It is anticipated that a strong focus of market players on research & development for innovating new devices incorporating the technological advances aid in the growth of the point of care blood testing devices market.
These market players opt for various inorganic growth strategies such as partnerships, collaborations, mergers, acquisitions, and product launches to create a global footprint and industry competition for point of care blood testing devices.
Key Developments in the Point of Care Blood Testing Devices
Some key developments in the point of care blood testing devices market is:
| Report Attribute | Details |
|---|---|
| Growth Rate | CAGR of 11.3% from 2025 to 2035 |
| Base Year for Estimation | 2024 |
| Historical Data | 2020 to 2024 |
| Forecast Period | 2025 to 2035 |
| Quantitative Units | Revenue in USD million, Volume in Kilotons and CAGR from 2025 to 2035 |
| Report Coverage | Revenue Forecast, Volume Forecast, Company Ranking, Competitive Landscape, Growth Factors, Trends and Pricing Analysis |
| Segments Covered | Product, Technology, Prescription, End Use, Region |
| Regions Covered | North America; Latin America, Europe; East Asia, South Asia; Oceania; Middle East and Africa |
| Key Countries Profiled | USA, Canada, Brazil, Argentina, Germany, UK, France, Spain, Italy, Nordics, BENELUX, Australia & New Zealand, China, India, ASEAN, GCC, South Africa |
| Key Companies Profiled | Abaxis; Abbott Laboratories; Accubiotech Co, Ltd.; ACON Laboratories, Inc.; Becton; Dickinson and Company; Biolytical Laboratories; Danaher Corporation (HemoCue); Siemens Healthineers; Meridian Bioscience, Inc. |
| Customization | Available Upon Request |
The global point of care blood testing devices market is estimated to be valued at USD 21.2 billion in 2025.
The market size for the point of care blood testing devices market is projected to reach USD 61.8 billion by 2035.
The point of care blood testing devices market is expected to grow at a 11.3% CAGR between 2025 and 2035.
The key product types in point of care blood testing devices market are diabete poc analyzer, coaglulation poc analyzer, poc blood analyzer and hematology poc reader.
In terms of technology, hand-held devices segment to command 38.9% share in the point of care blood testing devices market in 2025.


Our Research Products

The "Full Research Suite" delivers actionable market intel, deep dives on markets or technologies, so clients act faster, cut risk, and unlock growth.

The Leaderboard benchmarks and ranks top vendors, classifying them as Established Leaders, Leading Challengers, or Disruptors & Challengers.

Locates where complements amplify value and substitutes erode it, forecasting net impact by horizon

We deliver granular, decision-grade intel: market sizing, 5-year forecasts, pricing, adoption, usage, revenue, and operational KPIs—plus competitor tracking, regulation, and value chains—across 60 countries broadly.

Spot the shifts before they hit your P&L. We track inflection points, adoption curves, pricing moves, and ecosystem plays to show where demand is heading, why it is changing, and what to do next across high-growth markets and disruptive tech

Real-time reads of user behavior. We track shifting priorities, perceptions of today’s and next-gen services, and provider experience, then pace how fast tech moves from trial to adoption, blending buyer, consumer, and channel inputs with social signals (#WhySwitch, #UX).

Partner with our analyst team to build a custom report designed around your business priorities. From analysing market trends to assessing competitors or crafting bespoke datasets, we tailor insights to your needs.
Supplier Intelligence
Discovery & Profiling
Capacity & Footprint
Performance & Risk
Compliance & Governance
Commercial Readiness
Who Supplies Whom
Scorecards & Shortlists
Playbooks & Docs
Category Intelligence
Definition & Scope
Demand & Use Cases
Cost Drivers
Market Structure
Supply Chain Map
Trade & Policy
Operating Norms
Deliverables
Buyer Intelligence
Account Basics
Spend & Scope
Procurement Model
Vendor Requirements
Terms & Policies
Entry Strategy
Pain Points & Triggers
Outputs
Pricing Analysis
Benchmarks
Trends
Should-Cost
Indexation
Landed Cost
Commercial Terms
Deliverables
Brand Analysis
Positioning & Value Prop
Share & Presence
Customer Evidence
Go-to-Market
Digital & Reputation
Compliance & Trust
KPIs & Gaps
Outputs
Full Research Suite comprises of:
Market outlook & trends analysis
Interviews & case studies
Strategic recommendations
Vendor profiles & capabilities analysis
5-year forecasts
8 regions and 60+ country-level data splits
Market segment data splits
12 months of continuous data updates
DELIVERED AS:
PDF EXCEL ONLINE
Point-of-Care Opioid Testing Market Size and Share Forecast Outlook 2025 to 2035
Point-Of-Care Genetic Testing Market
Point-of-Care Food Sensitivity Testing Market Size and Share Forecast Outlook 2025 to 2035
Network Point-of-Care Glucose Testing Market Size and Share Forecast Outlook 2025 to 2035
Multi-Functional Point Of Care Testing Market Size and Share Forecast Outlook 2025 to 2035
Point-of-Care Fentanyl Test Kits Market Size and Share Forecast Outlook 2025 to 2035
Point-of-Care Diagnostics Market Size and Share Forecast Outlook 2025 to 2035
Point-Of-Care Breathalyzer Market Size and Share Forecast Outlook 2025 to 2035
Point-of-care Cholesterol Monitoring Device Market Size and Share Forecast Outlook 2025 to 2035
Point-of-care Molecular Diagnostics Market Insights – Trends & Growth 2025 to 2035
Point Of Care Infection Control Market
Point Of Care CT Imaging Market
Point-Of-Use Disposable Bag Testing Market
Home Blood Testing Devices Market Insights - Trends, Growth & Forecast 2025 to 2035
Mobile Point Of Sale Devices (mPOS) Market Size and Share Forecast Outlook 2025 to 2035
Veterinary Point of Care Diagnostics Market Size and Share Forecast Outlook 2025 to 2035
Veterinary Point of Care Market Trends and Forecast 2025 to 2035
Non-Hospital-Based Point-Of-Care Diagnostic Products Market Size and Share Forecast Outlook 2025 to 2035
Blood Testing Equipment Market Growth - Trends & Forecast 2025 to 2035
Point of Sale (PoS) Printers Market Insights – Growth & Forecast through 2034

Thank you!
You will receive an email from our Business Development Manager. Please be sure to check your SPAM/JUNK folder too.
Chat With
MaRIA