Reports

- Global Locations -

Headquarters

Future Market Insights, Inc.

Christiana Corporate, 200
Continental Drive, Suite 401,
Newark, Delaware - 19713,
United States

T: +1-845-579-5705

Americas

Future Market Insights, Inc.

616 Corporate Way, Suite 2-9018,
Valley Cottage, NY 10989, United States

T: +1-347-918-3531

MEA

Future Market Insights

1602-6 Jumeirah Bay X2 Tower, Plot No: JLT-PH2-X2A,
Jumeirah Lakes Towers, Dubai,
United Arab Emirates

Europe

Future Market Insights

3rd Floor, 207 Regent Street,
W1B 3HH London
United Kingdom

T: + 44 (0) 20 8123 9659
D: +44 (0) 20 3287 4268

Asia Pacific

Future Market Insights

IndiaLand Global Tech Park, Unit UG-1, Behind Grand HighStreet, Phase 1, Hinjawadi, MH, Pune – 411057, India

Checkpoint Inhibitor Refractory Cancer Market Snapshot (2023 to 2033)

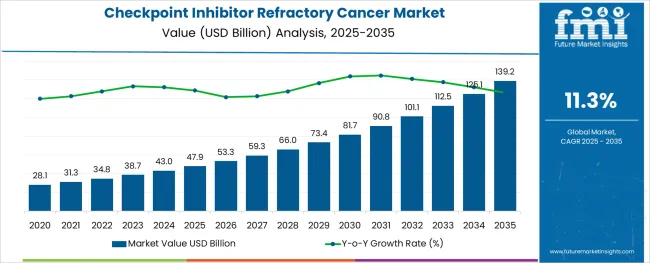
The global Checkpoint Inhibitor Refractory Cancer market size is expected to be valued at US$ 38.69 Billion in 2023. With the increasing health concern among people for extended indications of existing immunotherapies, the overall demand for Checkpoint Inhibitor Refractory Cancer is projected to grow at a CAGR of 11.26% between 2023 and 2033, totaling around US$ 112.43 Billion by 2033.

Data Points Key Statistics
Checkpoint Inhibitor Refractory Cancer Market Value 2023 US$ 38.69 Billion
Checkpoint Inhibitor Refractory Cancer Market Projected Value (2033) US$ 112.43 Billion
Checkpoint Inhibitor Refractory Cancer Market CAGR (2023 to 2033) 11.26%

According to the analysis of Future Market Insights, the checkpoint inhibitor refractory cancer market is expected to fuel over the analysis period, attributed to the factors such as the growth of a number of FDA approvals for clinical therapy with checkpoints (PD1/PDL1) inhibitors. For instance, six anti-PD-1/PD-L1 mAbs (monoclonal antibodies) have received approval as of December 2020, with additional indications covering 19 different cancer types and two tissue-agnostic diseases. Also, the key developments in the market include the development of monoclonal antibodies for targeted therapeutic approaches.

Additionally, factors such as technological innovations, advancements in cancer screening procedures, and a rise in the prevalence of cancer, are other factors that are projected to propel the demand of the market over the forecast period. Moreover, greater government initiatives to fight cancer, a rise in public awareness, as well as rising healthcare expenses are other factors that will augment the revenue share of the market in the near future. Also, high efficacy and superior treatment outcome-based PD-1/PD-L1 inhibitors are in high demand in severe cancer treatments.

PD-1/PD-L1 Inhibitors market holds nearly 26% market value share of the US$ 140 Billion oncology drugs market in 2021. Further, as early diagnosis remains the cornerstone of cancer control, the rising cancer awareness programs are expected to fuel the support and attention, early diagnosis, as well as treatment as well as palliative care for the population facing cancer diseases.

Don't pay for what you don't need

Customize your report by selecting specific countries or regions and save 30%!

Checkpoint Inhibitor Refractory Cancer Demand Analysis (2018 to 2022) Vs Market Outlook (2023 to 2033)

The global demand for Checkpoint Inhibitor Refractory Cancer is projected to increase at a CAGR of 11.26% during the forecast period between 2023 and 2033, reaching a total of US$ 112.43 Billion in 2033, according to a report from Future Market Insights (FMI). From 2018 to 2022, sales witnessed significant growth, registering a CAGR of 5.5%.

According to Future Market Insights, a market research and competitive intelligence provider, the Checkpoint Inhibitor Refractory Cancer market was valued at US$ 34.77 Billion in 2022.

The key factors leading to the market growth include the geriatric population across the globe, as well as a rapid increase in the global prevalence of several cancers, mainly in emerging and developed economies, which is expected to boost market growth in the forthcoming years.

For instance, as the World Health Organization reports, cancer has become a primary cause of death globally. As per the updated release of Globocan report released by the International Agency for Research on Cancer (IARC), in December 2020, the global burden of cancer has risen to 19.3 million cases and deaths by cancer have increased to 10 million in 2020. Thus, an upsurge in the volume of the patient pool leads to a greater demand for the market, which is accelerating the growth of the global market during the analysis period.

Leading industry players are focusing on the development and launch of novel PD-1/PD-L1 inhibitors to treat various types of cancers. This escalated the availability of PD-1/PD-L1 immunotherapeutic in the market is expected to boost the checkpoint inhibitor refractory cancer market.

Which Drivers underpin Checkpoint Inhibitor Refractory Cancer Industry Expansion?

Rise in Incidence of Cancer Globally to Fuel the Market Growth

The rise in the prevalence of cancer around the world is a major factor that will escalate the growth of the global checkpoint inhibitor refractory cancer market in the coming years. For instance, these checkpoint inhibitors are significantly used as front-line treatments for several types of cancer. As per the World Health Organization (WHO), cancer was one of the leading causes of death worldwide, accounting for around ten million deaths in 2020, or nearly one in six deaths. The most common cancers include breast, lung, colon and rectum, and prostate cancers. Thus, there is an increase in demand for checkpoint inhibitors globally.

There are various novel therapies, which have been approved in recent years. In addition, there is a gap between the demand and supply of these therapies, which has led to a huge unmet need. This, in turn, has given vendors an opportunity to conduct studies on drugs such as checkpoint inhibitors. In addition, the increasing approvals of these inhibitors are expected to increase their demand, which is anticipated to fuel the growth of the market.

Increase in Geriatric Population to Accelerate the Market Growth

The rise in cases of the geriatric population globally is projected to fuel the growth of the checkpoint inhibitor refractory cancer market over the analysis period. For instance, as per the Union for International Cancer Control (UICC), the elderly (people aged 65 years and more) are 11 times more likely to develop cancer, when compared to younger people. According to the United Nations, there are over 703 million people aged 65 or older, a number that is expected to reach 1.5 billion by 2050. According to the latest estimates and projections from UN DESA’s Population Division, one in six people in the world will be over the age of 65 by 2050, up from 1 in 11 in 2019.

The rise in research and development activities is expected to offer significant lucrative avenues for players in the checkpoint inhibitor refractory cancer market. For instance, market players have been increasingly investing in Research and Development activities, in order to meet the increasing demand. For instance, researchers at Johns Hopkins Kimmel Cancer Center are paving the way in developing novel immunotherapies called anti-PD-1 and anti-PD-L1 for people with advanced melanomas. The aim of the therapy is not to kill cancer cells directly, but to block a pathway, that protects tumor cells from components of the immune system that are capable and ready to fight cancer.

An increase in awareness among people about immune checkpoint inhibitors is projected to provide significant growth prospects for players in the global checkpoint inhibitor market. For instance, with the increase in awareness among people, the demand for these inhibitors is also increasing at a rapid pace globally.

Sabyasachi Ghosh
Sabyasachi Ghosh

Principal Consultant

Talk to Analyst

Find your sweet spots for generating winning opportunities in this market.

Which Factors are limiting the Growth of Checkpoint Inhibitor Refractory Cancer Market?

Stringent Government Regulations to Restrain the Market Growth

Globally, several laws have been introduced to monitor the quality as well as the effectiveness of inhibitors. The regulatory requirements are becoming increasingly stringent, as biologics progress through clinical trials and to commercialization. Due to the nature of biologics, which are produced by living cells, the process and the product must be validated as well as strictly monitored against critical quality attributes (CQAs), throughout the manufacturing process, not just at the end as for chemistry-based drugs. This creates hurdles to getting regulatory approval for the biologics, which in turn is expected to impede the growth of the market.

Further, cancer treatment can cause many side effects, such as depression, tiredness, and trouble eating. The National Cancer Institute and the American Cancer Society describe many of these problems and offer tips for preventing or coping with them. Several side effects can happen months or years after treatment. Hence, the risk of complications associated with the treatment is another factor that will hamper the market growth.

High Cost of Inhibitors to Limit the Market Growth

Cancer treatment costs create significant economic challenges for healthcare providers as well as patients, because of the impact they have on patient safety, quality of care, and overall healthcare. The cost of cancer treatment is high, mainly due to laboratory tests, hospitalization, and the administration of novel checkpoint inhibitors (PD-1 and PD-L1) inhibitor therapeutics. The treatment cost of these therapeutics depends on the stage of cancer. In addition, the high cost is leading to a rise in the preference for alternative treatment options such as surgeries.

For instance, on average, the cost of cancer treatment in India is around INR 503,118 (US$ 6,300) with a minimum expense of INR 90,561 (US$ 1,134) and a maximum cost of INR 27,67,149 (USD 34,650). Also, the cost of available checkpoint inhibitors is high. Thus, the high cost associated with cancer treatment is a major factor that will restrain the treatment adoption rate especially in developing regions.
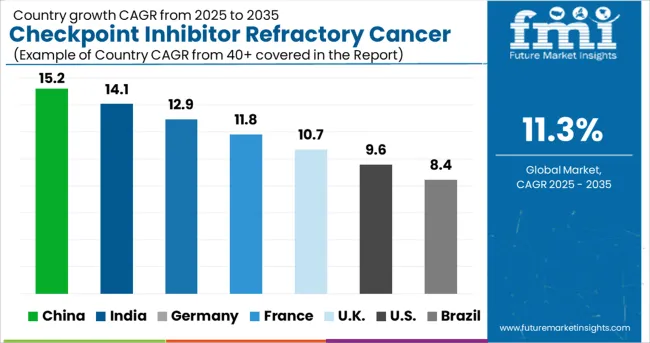
Region-wise Insights

Will North America Continue Dominance in the Global Checkpoint Inhibitor Refractory Cancer Market?

Favorable Initiatives by Regulatory Authorities in the Region to Fuel the Market Growth

The Checkpoint Inhibitor Refractory Cancer Market in North America is expected to accumulate the highest market share of 39% in 2023.

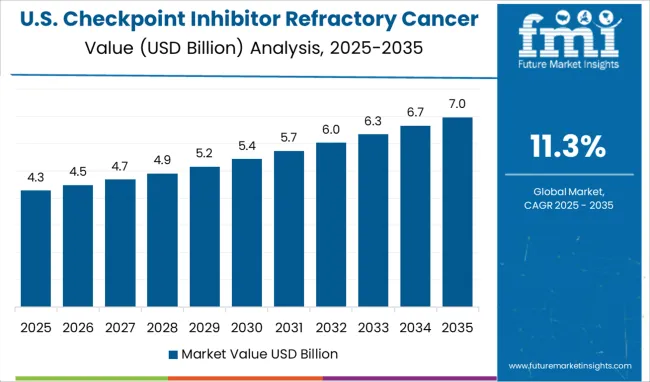
Factors such as favorable initiatives by the regulatory authorities in the region, especially in the USA, coupled with the increasing prevalence of cancer are expected to boost the growth of the checkpoint inhibitor refractory cancer market in North America. For instance, these inhibitors are used to treat a variety of cancer. As per the American Cancer Society, in 2022, there will be an estimated 1.9 million new cancer cases diagnosed and 609,360 cancer deaths in the USA. This in turn is anticipated to augment the market’s revenue share in the region.

The USA is estimated to account for around 99.2% of the North America Checkpoint inhibitors market in 2022. The significant share in the US is mainly attributed to the rising incidence of several chronic diseases such as urothelial carcinomas, lung cancers, skin cancer, and diabetes in the region, which demand efficient treatment.

For instance, according to a report from the American Cancer Society (2020), lung cancer is the second leading cancer resulting in 135,720 deaths in men as well as women. The numbers also report that around 84% of all lung cancers are NSCLC (non-small cell lung cancer) and 13% (small cell lung cancer) in the USA, which is expected to continue in the forthcoming years, leading to greater demand for checkpoint Inhibitors thus, fueling the market in the region. The region is expected to hold the highest CAGR of 11.1% during the forecast period.

How Will the Growth of the Checkpoint Inhibitor Refractory Cancer Market unfold in Asia Pacific?

Increasing Government Engagement to Surge Cancer Diagnosis in the Region to Fuel the Market Growth

The Checkpoint Inhibitor Refractory Cancer Market in Asia Pacific is expected to accumulate the highest market share of 37% in 2023.

The regional growth is attributed to the factors such as the high incidence of cancer, growing government engagement to surge cancer diagnosis, and growing adoption of inorganic growth strategies like collaborations, acquisitions, and mergers by major players functioning in the market introduction of new immunotherapies with lesser side effects, and increasing geriatric population in this region, especially in India. For instance, as per the cancer report by the Indian Council of Medical Research (ICMR), India’s cancer cases could increase by 12% in the next five years, with 1.5 million people projected to suffer from the non-communicable disease by 2025, up from 1.39 million in 2020. This is a major factor that will stimulate market growth.

Besides, China is expected to hold a significant growth rate over the analysis period, attributed to factors including a large population base, and major investment from private and public sectors into healthcare infrastructure development. Also, the growing interest in immune checkpoint inhibitors, coupled with the increase in the number of cancer cases, is anticipated to aid the development of the regional market in the near future. The region is expected to hold the highest CAGR of 11.0% during the forecast period.

Get the data you need at a Fraction of the cost

Personalize your report by choosing insights you need
and save 40%!

Category-wise Insights

By Application, which Checkpoint Inhibitor Refractory Cancer Category will remain prominent?

Non-Small Cell Lung Segment to beat Competition in Untiring Market

On the basis of type, the global Checkpoint Inhibitor Refractory Cancer market is dominated by the Non-Small Cell Lung Segment, which accounts for a share of 37%. The segment is expected to hold a CAGR of 11.1% over the analysis period.

This significant share of non-small cell lung cancer has encouraged the majority of major players to concentrate on continuous innovation of advanced therapeutics and improving the efficacy of the present therapeutics.

Additionally, a growing number of diagnoses of NSCLC (non-small cell lung cancer), and the rising awareness in the nations of the developing and developed markets are supporting the growth of the non-small cell lung cancer segment.

By End-User, which Checkpoint Inhibitor Refractory Cancer Category dominates?

Hospital Pharmacies Segment to Drive the Checkpoint Inhibitor Refractory Cancer Market

Based on the End-User, the hospital pharmacies segment is expected to witness a significant growth of 48.3% in 2022, and the trend is expected to continue during the forecast period, expanding at a rapid rate of 11.0% CAGR over the analysis period.

The segment’s growth is attributed to the factors such as large-scale orders, robust supply chains as well as attempts by hospital facilities to sustain large-scale inventories for cancer therapy applications. Moreover, the presence of advanced equipment and the availability of well-developed infrastructure adds to the development of the segment.

Further, the growing patient admission to hospitals for cancer treatment is surging the use of checkpoint inhibitors in hospitals, which in turn is anticipated to accelerate the sales in hospital pharmacies.

The Start-up Ecosystem: How key Players are opening Frontiers for Future Growth?

Checkpoint Inhibitor Refractory Cancer Market start-up players are adopting various marketing strategies such as new product launches, geographical expansion, mergers and acquisitions, partnerships, and collaboration to identify the interest of potential patients and create a larger customer base. For instance,
  • Founded in 2015, ALX Oncology is a developer of immuno-oncology therapies for cancer treatment. The lead product candidate ALX148 is a checkpoint inhibitor that comprises an affinity CD47 binding domain of SIRPα linked to an inactive Fc region of a human immunoglobulin. It binds CD47 and inhibits the CD47-SIRPα signaling pathway.
  • Established in 2015, another start-up named Hummingbird Bioscience is a developer of antibody drugs for cancer treatment. It is involved in developing antibodies by using systems immunology and computational structural biology technology. The company is using platform technology for the design and development of therapeutic antibodies. The pipelined products are HMBD-001 a monoclonal antibody and HMBD-002 an anti-vista monoclonal antibody for cancer treatment.
  • Founded in 2016, Shattuck Labs is a developer of an immunotherapy platform for oncology and other diseases. The company has developed ARC (Agonist Redirected Checkpoints), which hinges on the development of bispecific biologics that simultaneously block candidate checkpoint molecules in cancer while also stimulating TNF superfamily costimulatory receptors on T cells and innate cells. The company claims that ARC is adaptable to most of the checkpoint targets currently in clinical development.

Who are the Leading Players in the Checkpoint Inhibitor Refractory Cancer Market?

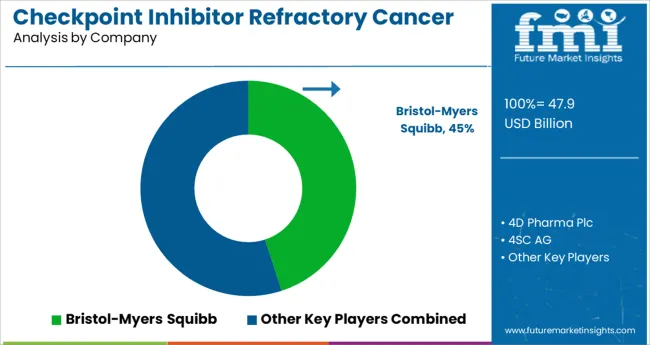
Prominent players in the Checkpoint Inhibitor Refractory Cancer market are Bristol-Myers Squibb, AstraZeneca, Merck, Genentech/Hoffmann-La Roche, Regeneron Pharmaceuticals, Merck KGaA, Pfizer, Bristol-Myers Squibb, Janssen Research and Development, LLC., 4D pharma plc., 4SC AG, OncoSec Medical, Mirati Therapeutics, Ascentage Pharma Group, and ENB Therapeutics, Inc., among others.

Recent Developments:

  • In October 2021, Merck announced the USA Food and Drug Administration (FDA) approval for KEYTRUDA, Merck’s anti-PD-1 therapy, in combination with chemotherapy, with or without bevacizumab. The therapy is used for the treatment of patients with persistent, recurrent, or metastatic cervical cancer whose tumors express PD-L1 (Combined Positive Score [CPS] ≥1) as determined by an FDA-approved test.
  • In January 2020, Novartis International AG acquired The Medicines Company. This acquisition helped Novartis in the treatment of the world’s leading cause of mortality and disability with a vaccine-like approach.
  • In May 2020, the Food and Drug Administration (FDA) approved Roche’s Tecentriq, as a first-line monotherapy for certain people with metastatic non-small cell lung.

Report Scope

Report Attribute Details
Growth Rate CAGR of 11.26% from 2023 to 2033
Market Value in 2023 US$ 38.69 Billion
Market Value in 2033 US$ 112.43 Billion
Base Year for Estimation 2022
Historical Data 2018 to 2022
Forecast Period 2023 to 2033
Quantitative Units Revenue in US$ Billion and CAGR from 2023 to 2033
Report Coverage Revenue Forecast, Company Ranking, Competitive Landscape, Growth Factors, Trends, and Pricing Analysis
Segments Covered
  • Type
  • Application
  • End-User
  • Region
Regions Covered
  • North America
  • Europe
  • Asia Pacific
  • Rest of the World
Key Countries Profiled
  • USA
  • Canada
  • Brazil
  • Mexico
  • Germany
  • UK
  • France
  • Spain
  • Italy
  • China
  • Japan
  • South Korea
  • Malaysia
  • Singapore
  • Australia
  • New Zealand
  • GCC Countries
  • South Africa
  • Israel
Key Companies Profiled
  • Bristol-Myers Squibb
  • AstraZeneca
  • Merck
  • Genentech/Hoffmann-La Roche
  • Regeneron Pharmaceuticals
  • Merck KGaA and Pfizer
  • Bristol-Myers Squibb
  • Janssen Research and Development, LLC
  • 4D pharma plc.
  • 4SC AG
  • OncoSec Medical
  • Mirati Therapeutics
  • Ascentage Pharma Group
  • ENB Therapeutics, Inc.
  • Exicure, Inc.
  • Evelo Biosciences, Inc./Merck Sharp & Dohme Corp.
  • Eisai
  • Kartos Therapeutics
  • Exelixis
  • ImmunityBio

Key Segments Covered in the Checkpoint Inhibitor Refractory Cancer Industry Analysis

Checkpoint Inhibitor Refractory Cancer Market by Type:

  • PD-1 Inhibitors
  • PD-L1 Inhibitors

Checkpoint Inhibitor Refractory Cancer Market by Application:

  • Hodgkin Lymphoma
  • Kidney Cancer
  • Melanoma
  • Non-Small Cell Lung Cancer
  • Others

Checkpoint Inhibitor Refractory Cancer Market by End-User:

  • Hospital Pharmacies
  • Retail Pharmacies
  • Online Pharmacies

Checkpoint Inhibitor Refractory Cancer Market by Region:

  • North America
  • Europe
  • Asia Pacific
  • Rest of the World

Frequently Asked Questions

What was the market value for Checkpoint Inhibitor Refractory Cancer in 2022?

As of 2022, the market for Checkpoint Inhibitor Refractory Cancer was valued at US$ 34.77 Billion, as per FMI

At what value did the Checkpoint Inhibitor Refractory Cancer Market close in 2023?

By 2023-end, sales of Checkpoint Inhibitor Refractory Cancer closed at a value of US$ 38.69 Billion.

What was the last 4 years value CAGR for Checkpoint Inhibitor Refractory Cancer?

From 2018 to 2022, Checkpoint Inhibitor Refractory Cancer demand expanded at a CAGR of 5.5%

What is the projected forecast CAGR for the Checkpoint Inhibitor Refractory Cancer Industry from 2023 to 2033?

From 2023 to 2033, Checkpoint Inhibitor Refractory Cancer sales are expected to flourish at a CAGR of 11.26%

According to FMI, what is the anticipated market value for Checkpoint Inhibitor Refractory Cancer in 2033?

By 2033, the market value of Checkpoint Inhibitor Refractory Cancer is expected to reach US$ 112.43 Billion.

By Application, which category ranks first with regard to Checkpoint Inhibitor Refractory Cancer?

By Application, the Non-Small Cell Lung segment of the Checkpoint Inhibitor Refractory Cancer constitutes the bulk of the market share of 37% in 2022.

By End-User, which category ranks first with regard to Checkpoint Inhibitor Refractory Cancer?

By End-User, the Hospital Pharmacies segment dominates the market with a share of 48.3% in 2022.

Table of Content

1. Executive Summary | Checkpoint Inhibitor Refractory Cancer Market

    1.1. Global Market Outlook

    1.2. Demand-side Trends

    1.3. Supply-side Trends

    1.4. Technology Roadmap Analysis

    1.5. Analysis and Recommendations

2. Market Overview

    2.1. Market Coverage / Taxonomy

    2.2. Market Definition / Scope / Limitations

3. Market Background

    3.1. Market Dynamics

        3.1.1. Drivers

        3.1.2. Restraints

        3.1.3. Opportunity

        3.1.4. Trends

    3.2. Scenario Forecast

        3.2.1. Demand in Optimistic Scenario

        3.2.2. Demand in Likely Scenario

        3.2.3. Demand in Conservative Scenario

    3.3. Opportunity Map Analysis

    3.4. Investment Feasibility Matrix

    3.5. PESTLE and Porter’s Analysis

    3.6. Regulatory Landscape

        3.6.1. By Key Regions

        3.6.2. By Key Countries

    3.7. Regional Parent Market Outlook

4. Global Market Analysis 2018 to 2022 and Forecast, 2023 to 2033

    4.1. Historical Market Size Value (US$ Million) Analysis, 2018 to 2022

    4.2. Current and Future Market Size Value (US$ Million) Projections, 2023 to 2033

        4.2.1. Y-o-Y Growth Trend Analysis

        4.2.2. Absolute $ Opportunity Analysis

5. Global Market Analysis 2018 to 2022 and Forecast 2023 to 2033, By Type

    5.1. Introduction / Key Findings

    5.2. Historical Market Size Value (US$ Million) Analysis By Type, 2018 to 2022

    5.3. Current and Future Market Size Value (US$ Million) Analysis and Forecast By Type, 2023 to 2033

        5.3.1. CTLA-4 Inhibitor

        5.3.2. PD-1 Inhibitor

        5.3.3. PD-L1 Inhibitor

        5.3.4. Others

    5.4. Y-o-Y Growth Trend Analysis By Type, 2018 to 2022

    5.5. Absolute $ Opportunity Analysis By Type, 2023 to 2033

6. Global Market Analysis 2018 to 2022 and Forecast 2023 to 2033, By Application

    6.1. Introduction / Key Findings

    6.2. Historical Market Size Value (US$ Million) Analysis By Application, 2018 to 2022

    6.3. Current and Future Market Size Value (US$ Million) Analysis and Forecast By Application, 2023 to 2033

        6.3.1. Lung Cancer

        6.3.2. Bladder Cancer

        6.3.3. Melanoma

        6.3.4. Hodgkin Lymphoma

        6.3.5. Others

    6.4. Y-o-Y Growth Trend Analysis By Application, 2018 to 2022

    6.5. Absolute $ Opportunity Analysis By Application, 2023 to 2033

7. Global Market Analysis 2018 to 2022 and Forecast 2023 to 2033, By Region

    7.1. Introduction

    7.2. Historical Market Size Value (US$ Million) Analysis By Region, 2018 to 2022

    7.3. Current Market Size Value (US$ Million) Analysis and Forecast By Region, 2023 to 2033

        7.3.1. North America

        7.3.2. Latin America

        7.3.3. Europe

        7.3.4. Asia Pacific

        7.3.5. Middle East and Africa (MEA)

    7.4. Market Attractiveness Analysis By Region

8. North America Market Analysis 2018 to 2022 and Forecast 2023 to 2033, By Country

    8.1. Historical Market Size Value (US$ Million) Trend Analysis By Market Taxonomy, 2018 to 2022

    8.2. Market Size Value (US$ Million) Forecast By Market Taxonomy, 2023 to 2033

        8.2.1. By Country

            8.2.1.1. United States of America

            8.2.1.2. Canada

        8.2.2. By Type

        8.2.3. By Application

    8.3. Market Attractiveness Analysis

        8.3.1. By Country

        8.3.2. By Type

        8.3.3. By Application

    8.4. Key Takeaways

9. Latin America Market Analysis 2018 to 2022 and Forecast 2023 to 2033, By Country

    9.1. Historical Market Size Value (US$ Million) Trend Analysis By Market Taxonomy, 2018 to 2022

    9.2. Market Size Value (US$ Million) Forecast By Market Taxonomy, 2023 to 2033

        9.2.1. By Country

            9.2.1.1. Brazil

            9.2.1.2. Mexico

            9.2.1.3. Rest of Latin America

        9.2.2. By Type

        9.2.3. By Application

    9.3. Market Attractiveness Analysis

        9.3.1. By Country

        9.3.2. By Type

        9.3.3. By Application

    9.4. Key Takeaways

10. Europe Market Analysis 2018 to 2022 and Forecast 2023 to 2033, By Country

    10.1. Historical Market Size Value (US$ Million) Trend Analysis By Market Taxonomy, 2018 to 2022

    10.2. Market Size Value (US$ Million) Forecast By Market Taxonomy, 2023 to 2033

        10.2.1. By Country

            10.2.1.1. Germany

            10.2.1.2. United Kingdom

            10.2.1.3. France

            10.2.1.4. Spain

            10.2.1.5. Italy

            10.2.1.6. Rest of Europe

        10.2.2. By Type

        10.2.3. By Application

    10.3. Market Attractiveness Analysis

        10.3.1. By Country

        10.3.2. By Type

        10.3.3. By Application

    10.4. Key Takeaways

11. Asia Pacific Market Analysis 2018 to 2022 and Forecast 2023 to 2033, By Country

    11.1. Historical Market Size Value (US$ Million) Trend Analysis By Market Taxonomy, 2018 to 2022

    11.2. Market Size Value (US$ Million) Forecast By Market Taxonomy, 2023 to 2033

        11.2.1. By Country

            11.2.1.1. China

            11.2.1.2. Japan

            11.2.1.3. South Korea

            11.2.1.4. Singapore

            11.2.1.5. Thailand

            11.2.1.6. Indonesia

            11.2.1.7. Australia

            11.2.1.8. New Zealand

            11.2.1.9. Rest of Asia Pacific

        11.2.2. By Type

        11.2.3. By Application

    11.3. Market Attractiveness Analysis

        11.3.1. By Country

        11.3.2. By Type

        11.3.3. By Application

    11.4. Key Takeaways

12. MEA Market Analysis 2018 to 2022 and Forecast 2023 to 2033, By Country

    12.1. Historical Market Size Value (US$ Million) Trend Analysis By Market Taxonomy, 2018 to 2022

    12.2. Market Size Value (US$ Million) Forecast By Market Taxonomy, 2023 to 2033

        12.2.1. By Country

            12.2.1.1. GCC Countries

            12.2.1.2. South Africa

            12.2.1.3. Israel

            12.2.1.4. Rest of MEA

        12.2.2. By Type

        12.2.3. By Application

    12.3. Market Attractiveness Analysis

        12.3.1. By Country

        12.3.2. By Type

        12.3.3. By Application

    12.4. Key Takeaways

13. Key Countries Market Analysis

    13.1. United States of America

        13.1.1. Pricing Analysis

        13.1.2. Market Share Analysis, 2022

            13.1.2.1. By Type

            13.1.2.2. By Application

    13.2. Canada

        13.2.1. Pricing Analysis

        13.2.2. Market Share Analysis, 2022

            13.2.2.1. By Type

            13.2.2.2. By Application

    13.3. Brazil

        13.3.1. Pricing Analysis

        13.3.2. Market Share Analysis, 2022

            13.3.2.1. By Type

            13.3.2.2. By Application

    13.4. Mexico

        13.4.1. Pricing Analysis

        13.4.2. Market Share Analysis, 2022

            13.4.2.1. By Type

            13.4.2.2. By Application

    13.5. Germany

        13.5.1. Pricing Analysis

        13.5.2. Market Share Analysis, 2022

            13.5.2.1. By Type

            13.5.2.2. By Application

    13.6. United Kingdom

        13.6.1. Pricing Analysis

        13.6.2. Market Share Analysis, 2022

            13.6.2.1. By Type

            13.6.2.2. By Application

    13.7. France

        13.7.1. Pricing Analysis

        13.7.2. Market Share Analysis, 2022

            13.7.2.1. By Type

            13.7.2.2. By Application

    13.8. Spain

        13.8.1. Pricing Analysis

        13.8.2. Market Share Analysis, 2022

            13.8.2.1. By Type

            13.8.2.2. By Application

    13.9. Italy

        13.9.1. Pricing Analysis

        13.9.2. Market Share Analysis, 2022

            13.9.2.1. By Type

            13.9.2.2. By Application

    13.10. China

        13.10.1. Pricing Analysis

        13.10.2. Market Share Analysis, 2022

            13.10.2.1. By Type

            13.10.2.2. By Application

    13.11. Japan

        13.11.1. Pricing Analysis

        13.11.2. Market Share Analysis, 2022

            13.11.2.1. By Type

            13.11.2.2. By Application

    13.12. South Korea

        13.12.1. Pricing Analysis

        13.12.2. Market Share Analysis, 2022

            13.12.2.1. By Type

            13.12.2.2. By Application

    13.13. Singapore

        13.13.1. Pricing Analysis

        13.13.2. Market Share Analysis, 2022

            13.13.2.1. By Type

            13.13.2.2. By Application

    13.14. Thailand

        13.14.1. Pricing Analysis

        13.14.2. Market Share Analysis, 2022

            13.14.2.1. By Type

            13.14.2.2. By Application

    13.15. Indonesia

        13.15.1. Pricing Analysis

        13.15.2. Market Share Analysis, 2022

            13.15.2.1. By Type

            13.15.2.2. By Application

    13.16. Australia

        13.16.1. Pricing Analysis

        13.16.2. Market Share Analysis, 2022

            13.16.2.1. By Type

            13.16.2.2. By Application

    13.17. New Zealand

        13.17.1. Pricing Analysis

        13.17.2. Market Share Analysis, 2022

            13.17.2.1. By Type

            13.17.2.2. By Application

    13.18. GCC Countries

        13.18.1. Pricing Analysis

        13.18.2. Market Share Analysis, 2022

            13.18.2.1. By Type

            13.18.2.2. By Application

    13.19. South Africa

        13.19.1. Pricing Analysis

        13.19.2. Market Share Analysis, 2022

            13.19.2.1. By Type

            13.19.2.2. By Application

    13.20. Israel

        13.20.1. Pricing Analysis

        13.20.2. Market Share Analysis, 2022

            13.20.2.1. By Type

            13.20.2.2. By Application

14. Market Structure Analysis

    14.1. Competition Dashboard

    14.2. Competition Benchmarking

    14.3. Market Share Analysis of Top Players

        14.3.1. By Regional

        14.3.2. By Type

        14.3.3. By Application

15. Competition Analysis

    15.1. Competition Deep Dive

        15.1.1. 4D Pharma Plv

            15.1.1.1. Overview

            15.1.1.2. Product Portfolio

            15.1.1.3. Profitability by Market Segments

            15.1.1.4. Sales Footprint

            15.1.1.5. Strategy Overview

                15.1.1.5.1. Marketing Strategy

        15.1.2. 4SC AG

            15.1.2.1. Overview

            15.1.2.2. Product Portfolio

            15.1.2.3. Profitability by Market Segments

            15.1.2.4. Sales Footprint

            15.1.2.5. Strategy Overview

                15.1.2.5.1. Marketing Strategy

        15.1.3. Ascentage Pharma Group

            15.1.3.1. Overview

            15.1.3.2. Product Portfolio

            15.1.3.3. Profitability by Market Segments

            15.1.3.4. Sales Footprint

            15.1.3.5. Strategy Overview

                15.1.3.5.1. Marketing Strategy

        15.1.4. Eisai Inc

            15.1.4.1. Overview

            15.1.4.2. Product Portfolio

            15.1.4.3. Profitability by Market Segments

            15.1.4.4. Sales Footprint

            15.1.4.5. Strategy Overview

                15.1.4.5.1. Marketing Strategy

        15.1.5. Bristol-Myers Squibb

            15.1.5.1. Overview

            15.1.5.2. Product Portfolio

            15.1.5.3. Profitability by Market Segments

            15.1.5.4. Sales Footprint

            15.1.5.5. Strategy Overview

                15.1.5.5.1. Marketing Strategy

        15.1.6. AstraZeneca

            15.1.6.1. Overview

            15.1.6.2. Product Portfolio

            15.1.6.3. Profitability by Market Segments

            15.1.6.4. Sales Footprint

            15.1.6.5. Strategy Overview

                15.1.6.5.1. Marketing Strategy

        15.1.7. Merck

            15.1.7.1. Overview

            15.1.7.2. Product Portfolio

            15.1.7.3. Profitability by Market Segments

            15.1.7.4. Sales Footprint

            15.1.7.5. Strategy Overview

                15.1.7.5.1. Marketing Strategy

        15.1.8. Opdivo

            15.1.8.1. Overview

            15.1.8.2. Product Portfolio

            15.1.8.3. Profitability by Market Segments

            15.1.8.4. Sales Footprint

            15.1.8.5. Strategy Overview

                15.1.8.5.1. Marketing Strategy

        15.1.9. Keytruda

            15.1.9.1. Overview

            15.1.9.2. Product Portfolio

            15.1.9.3. Profitability by Market Segments

            15.1.9.4. Sales Footprint

            15.1.9.5. Strategy Overview

                15.1.9.5.1. Marketing Strategy

        15.1.10. Tecentriq

            15.1.10.1. Overview

            15.1.10.2. Product Portfolio

            15.1.10.3. Profitability by Market Segments

            15.1.10.4. Sales Footprint

            15.1.10.5. Strategy Overview

                15.1.10.5.1. Marketing Strategy

16. Assumptions & Acronyms Used

17. Research Methodology

List of Tables

Table 1: Global Market Value (US$ Million) Forecast by Region, 2018 to 2033

Table 2: Global Market Value (US$ Million) Forecast by Type, 2018 to 2033

Table 3: Global Market Value (US$ Million) Forecast by Application, 2018 to 2033

Table 4: North America Market Value (US$ Million) Forecast by Country, 2018 to 2033

Table 5: North America Market Value (US$ Million) Forecast by Type, 2018 to 2033

Table 6: North America Market Value (US$ Million) Forecast by Application, 2018 to 2033

Table 7: Latin America Market Value (US$ Million) Forecast by Country, 2018 to 2033

Table 8: Latin America Market Value (US$ Million) Forecast by Type, 2018 to 2033

Table 9: Latin America Market Value (US$ Million) Forecast by Application, 2018 to 2033

Table 10: Europe Market Value (US$ Million) Forecast by Country, 2018 to 2033

Table 11: Europe Market Value (US$ Million) Forecast by Type, 2018 to 2033

Table 12: Europe Market Value (US$ Million) Forecast by Application, 2018 to 2033

Table 13: Asia Pacific Market Value (US$ Million) Forecast by Country, 2018 to 2033

Table 14: Asia Pacific Market Value (US$ Million) Forecast by Type, 2018 to 2033

Table 15: Asia Pacific Market Value (US$ Million) Forecast by Application, 2018 to 2033

Table 16: MEA Market Value (US$ Million) Forecast by Country, 2018 to 2033

Table 17: MEA Market Value (US$ Million) Forecast by Type, 2018 to 2033

Table 18: MEA Market Value (US$ Million) Forecast by Application, 2018 to 2033

List of Charts

Figure 1: Global Market Value (US$ Million) by Type, 2023 to 2033

Figure 2: Global Market Value (US$ Million) by Application, 2023 to 2033

Figure 3: Global Market Value (US$ Million) by Region, 2023 to 2033

Figure 4: Global Market Value (US$ Million) Analysis by Region, 2018 to 2033

Figure 5: Global Market Value Share (%) and BPS Analysis by Region, 2023 to 2033

Figure 6: Global Market Y-o-Y Growth (%) Projections by Region, 2023 to 2033

Figure 7: Global Market Value (US$ Million) Analysis by Type, 2018 to 2033

Figure 8: Global Market Value Share (%) and BPS Analysis by Type, 2023 to 2033

Figure 9: Global Market Y-o-Y Growth (%) Projections by Type, 2023 to 2033

Figure 10: Global Market Value (US$ Million) Analysis by Application, 2018 to 2033

Figure 11: Global Market Value Share (%) and BPS Analysis by Application, 2023 to 2033

Figure 12: Global Market Y-o-Y Growth (%) Projections by Application, 2023 to 2033

Figure 13: Global Market Attractiveness by Type, 2023 to 2033

Figure 14: Global Market Attractiveness by Application, 2023 to 2033

Figure 15: Global Market Attractiveness by Region, 2023 to 2033

Figure 16: North America Market Value (US$ Million) by Type, 2023 to 2033

Figure 17: North America Market Value (US$ Million) by Application, 2023 to 2033

Figure 18: North America Market Value (US$ Million) by Country, 2023 to 2033

Figure 19: North America Market Value (US$ Million) Analysis by Country, 2018 to 2033

Figure 20: North America Market Value Share (%) and BPS Analysis by Country, 2023 to 2033

Figure 21: North America Market Y-o-Y Growth (%) Projections by Country, 2023 to 2033

Figure 22: North America Market Value (US$ Million) Analysis by Type, 2018 to 2033

Figure 23: North America Market Value Share (%) and BPS Analysis by Type, 2023 to 2033

Figure 24: North America Market Y-o-Y Growth (%) Projections by Type, 2023 to 2033

Figure 25: North America Market Value (US$ Million) Analysis by Application, 2018 to 2033

Figure 26: North America Market Value Share (%) and BPS Analysis by Application, 2023 to 2033

Figure 27: North America Market Y-o-Y Growth (%) Projections by Application, 2023 to 2033

Figure 28: North America Market Attractiveness by Type, 2023 to 2033

Figure 29: North America Market Attractiveness by Application, 2023 to 2033

Figure 30: North America Market Attractiveness by Country, 2023 to 2033

Figure 31: Latin America Market Value (US$ Million) by Type, 2023 to 2033

Figure 32: Latin America Market Value (US$ Million) by Application, 2023 to 2033

Figure 33: Latin America Market Value (US$ Million) by Country, 2023 to 2033

Figure 34: Latin America Market Value (US$ Million) Analysis by Country, 2018 to 2033

Figure 35: Latin America Market Value Share (%) and BPS Analysis by Country, 2023 to 2033

Figure 36: Latin America Market Y-o-Y Growth (%) Projections by Country, 2023 to 2033

Figure 37: Latin America Market Value (US$ Million) Analysis by Type, 2018 to 2033

Figure 38: Latin America Market Value Share (%) and BPS Analysis by Type, 2023 to 2033

Figure 39: Latin America Market Y-o-Y Growth (%) Projections by Type, 2023 to 2033

Figure 40: Latin America Market Value (US$ Million) Analysis by Application, 2018 to 2033

Figure 41: Latin America Market Value Share (%) and BPS Analysis by Application, 2023 to 2033

Figure 42: Latin America Market Y-o-Y Growth (%) Projections by Application, 2023 to 2033

Figure 43: Latin America Market Attractiveness by Type, 2023 to 2033

Figure 44: Latin America Market Attractiveness by Application, 2023 to 2033

Figure 45: Latin America Market Attractiveness by Country, 2023 to 2033

Figure 46: Europe Market Value (US$ Million) by Type, 2023 to 2033

Figure 47: Europe Market Value (US$ Million) by Application, 2023 to 2033

Figure 48: Europe Market Value (US$ Million) by Country, 2023 to 2033

Figure 49: Europe Market Value (US$ Million) Analysis by Country, 2018 to 2033

Figure 50: Europe Market Value Share (%) and BPS Analysis by Country, 2023 to 2033

Figure 51: Europe Market Y-o-Y Growth (%) Projections by Country, 2023 to 2033

Figure 52: Europe Market Value (US$ Million) Analysis by Type, 2018 to 2033

Figure 53: Europe Market Value Share (%) and BPS Analysis by Type, 2023 to 2033

Figure 54: Europe Market Y-o-Y Growth (%) Projections by Type, 2023 to 2033

Figure 55: Europe Market Value (US$ Million) Analysis by Application, 2018 to 2033

Figure 56: Europe Market Value Share (%) and BPS Analysis by Application, 2023 to 2033

Figure 57: Europe Market Y-o-Y Growth (%) Projections by Application, 2023 to 2033

Figure 58: Europe Market Attractiveness by Type, 2023 to 2033

Figure 59: Europe Market Attractiveness by Application, 2023 to 2033

Figure 60: Europe Market Attractiveness by Country, 2023 to 2033

Figure 61: Asia Pacific Market Value (US$ Million) by Type, 2023 to 2033

Figure 62: Asia Pacific Market Value (US$ Million) by Application, 2023 to 2033

Figure 63: Asia Pacific Market Value (US$ Million) by Country, 2023 to 2033

Figure 64: Asia Pacific Market Value (US$ Million) Analysis by Country, 2018 to 2033

Figure 65: Asia Pacific Market Value Share (%) and BPS Analysis by Country, 2023 to 2033

Figure 66: Asia Pacific Market Y-o-Y Growth (%) Projections by Country, 2023 to 2033

Figure 67: Asia Pacific Market Value (US$ Million) Analysis by Type, 2018 to 2033

Figure 68: Asia Pacific Market Value Share (%) and BPS Analysis by Type, 2023 to 2033

Figure 69: Asia Pacific Market Y-o-Y Growth (%) Projections by Type, 2023 to 2033

Figure 70: Asia Pacific Market Value (US$ Million) Analysis by Application, 2018 to 2033

Figure 71: Asia Pacific Market Value Share (%) and BPS Analysis by Application, 2023 to 2033

Figure 72: Asia Pacific Market Y-o-Y Growth (%) Projections by Application, 2023 to 2033

Figure 73: Asia Pacific Market Attractiveness by Type, 2023 to 2033

Figure 74: Asia Pacific Market Attractiveness by Application, 2023 to 2033

Figure 75: Asia Pacific Market Attractiveness by Country, 2023 to 2033

Figure 76: MEA Market Value (US$ Million) by Type, 2023 to 2033

Figure 77: MEA Market Value (US$ Million) by Application, 2023 to 2033

Figure 78: MEA Market Value (US$ Million) by Country, 2023 to 2033

Figure 79: MEA Market Value (US$ Million) Analysis by Country, 2018 to 2033

Figure 80: MEA Market Value Share (%) and BPS Analysis by Country, 2023 to 2033

Figure 81: MEA Market Y-o-Y Growth (%) Projections by Country, 2023 to 2033

Figure 82: MEA Market Value (US$ Million) Analysis by Type, 2018 to 2033

Figure 83: MEA Market Value Share (%) and BPS Analysis by Type, 2023 to 2033

Figure 84: MEA Market Y-o-Y Growth (%) Projections by Type, 2023 to 2033

Figure 85: MEA Market Value (US$ Million) Analysis by Application, 2018 to 2033

Figure 86: MEA Market Value Share (%) and BPS Analysis by Application, 2023 to 2033

Figure 87: MEA Market Y-o-Y Growth (%) Projections by Application, 2023 to 2033

Figure 88: MEA Market Attractiveness by Type, 2023 to 2033

Figure 89: MEA Market Attractiveness by Application, 2023 to 2033

Figure 90: MEA Market Attractiveness by Country, 2023 to 2033

Recommendations

Healthcare

Cancer Tissue Diagnostic Market

Published : April 2024

Healthcare

Cancer Biological Therapy Market

Published : December 2022

Healthcare

Cancer Supportive Care Products Market

Published : July 2020

Explore Healthcare Insights

View Reports

Checkpoint Inhibitor Refractory Cancer Market