Small Molecule Inhibitors Market Size, Share, and Forecast Outlook 2025 to 2035

In 2025, the small molecule inhibitors market is anticipated to be valued at USD 295.3 billion, with estimates indicating growth to USD 514.1 billion by 2035 at a CAGR of 5.7%.

Quick Stats of the Small Molecule Inhibitors Market
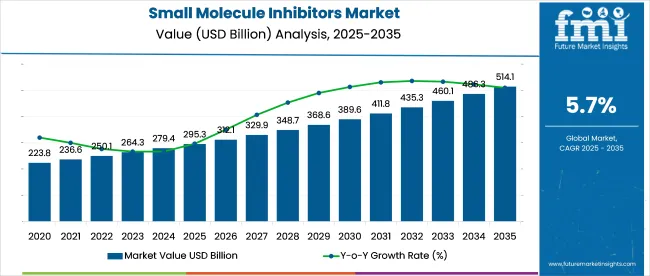
  • Industry Value (2025): USD 295.3 billion
  • Forecast Value (2035): USD 514.1 billion
  • Global CAGR (2025 to 2035): 5.7%
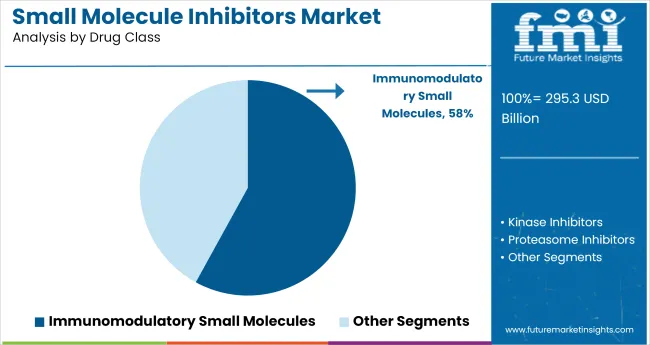
  • Leading Segment in 2025: Immunomodulatory Small Molecules (~58% share)
  • Key Growth Region: South Asia
  • Key Players: Novartis AG, Pfizer Inc, Roche Holding AG, Bristol-Myers Squibb, AstraZeneca plc,

Small Molecule Inhibitors Market   Market Value Analysis

Between 2020 and 2024, the industry expanded from USD 220.6 billion to USD 278.4 billion,with an average YoY growth of 6%. Initial momentum was driven by kinase inhibitors in NSCLC and leukemia, along with increased use of apoptosis modulators. Oral bioavailability and targeted precision made these therapies favorable over biologics. By 2024, adoption had widened across adjuvant settings and autoimmune indications in high-income industries.

In February 2025, Novartis announced the acquisition of Anthos Therapeutics in a transaction valued up to USD 3.1 billion. This strategic move aims to bolster Novartis' cardiovascular portfolio through the integration of Anthos’ factor‑XI inhibitors, designed to reduce stroke risk without increasing bleeding events. The acquisition reflects Novartis’ continued investment in next-generation small-molecule assets with multi-indication potential.

The small molecule inhibitors market holds a measurable share across multiple life sciences sectors. In the USD 1.5 trillion global pharmaceutical industry, small molecule inhibitors contribute approximately 5-7% of annual sales, primarily in targeted therapeutics. Within the USD 250 billion oncology therapeutics segment, they represent 35-40%, led by kinase and PARP inhibitors.

Roughly 40-45% of the USD 120 billion targeted therapy market stems from small molecules, reflecting their ability to modulate intracellular pathways. In the USD 80 billion precision therapeutics segment, they account for 45-50%, often complementing biologics in personalized medicine. Across the USD 700 billion chronic disease therapeutics space, 8-10% is tied for autoimmune, cardiovascular, and metabolic disorder management.

Analyzing Small Molecule Inhibitors Market by Top Investment Segments

The industry is segmented by molecule class into immunomodulatory agents, kinase-targeting compounds, proteasome blockers, and enzyme inhibition therapies. Therapeutic areas include oncology, autoimmune conditions, inflammatory disorders, infectious diseases, and cardiometabolic applications. Distribution channels include hospital-based systems, specialty treatment centers, and regulated pharmacy networks.

Regional segmentation covers North America, Latin America, Western Europe, Eastern Europe, East Asia, South Asia & Pacific.
Immune Modulation Agents Solidify Industry Leadership

Small Molecule Inhibitors Market   Analysis By Drug Class

A 58% revenue share in 2025 is projected to be held by immunomodulatory small molecules. These compounds are being favored due to their mechanism-level targeting across inflammatory pathways and hematologic dysregulation. Between 2020 and 2024, JAK and BTK inhibitors were positioned as frontline therapies in autoimmune relapses and lymphoproliferative cancers. This shift was not driven by general prescription trends but by rapid clinical adoption tied to regulatory momentum and trial-supported efficacy.

The category’s dominance is being reinforced by sustained demand for orally active immune modulators, particularly those enabling long-term management protocols. Unlike broader immunotherapy platforms, small molecule-based immunoregulators are offering precision with lower patient monitoring burden.
  • Ruxolitinib (Incyte) was extended into steroid-refractory GVHD and remains essential in myeloproliferative care.
  • Acalabrutinib (AstraZeneca) has replaced earlier-generation BTK inhibitors in CLL protocols.
  • Galapagos NV advanced next-gen TYK2 inhibitors into pivotal autoimmune studies.

Precision Oncology Fuels Therapeutic Utilization

Small Molecule Inhibitors Market   Analysis By Therapeutic Area

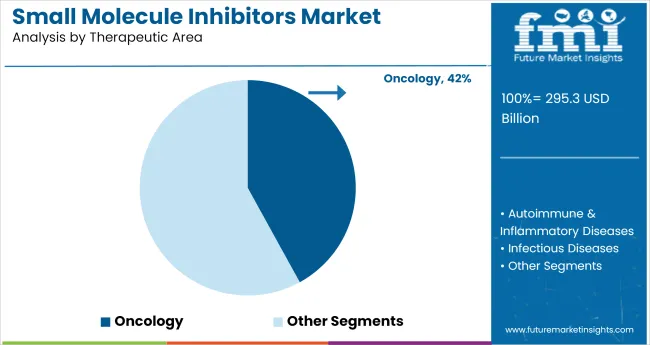
In 2025, oncology is forecasted to account for 42% of total therapeutic demand for small molecule inhibitors. This share is being maintained not through legacy usage but through active trial pipelines and molecularly guided treatment algorithms. From 2020 to 2024, BRAF, EGFR, ALK, and PARP inhibitors were given multiple first-line approvals across solid and hematologic tumors, leading to rapid protocol-level incorporation.

The dominance of oncology in the industry shows the clinical reliability of kinase and cell-cycle disruptors, especially when paired with immunotherapy. Small-molecule regimens are being used to sensitize tumors before checkpoint blockade, solidifying their role beyond monotherapy.
  • Novartis continued advancing BRAF/MEK inhibitors with durable response rates in NSCLC.
  • Pfizer’s Ibrance (palbociclib) sustained leadership in HR+/HER2; breast cancer maintenance.
  • AstraZeneca’s olaparib remained embedded in ovarian and prostate regimens under maintenance protocols.

Hospital Infrastructure Anchors Distribution Volume

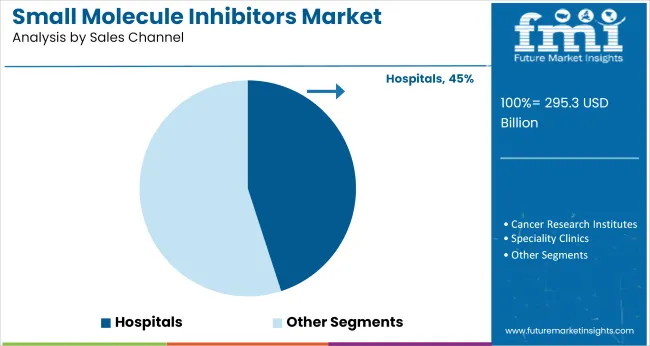
Small Molecule Inhibitors Market   Analysis By Sales Channel

Hospitals are projected to represent 45% of all small molecule inhibitor sales by 2025. This trend is being led by protocol-based dosing, diagnostic-tethered prescription flows, and the consolidation of first-cycle drug management into tertiary care environments. Between 2020 and 2024, the inpatient share was expanded due to oral transitions from high-risk intravenous therapies, along with the adoption of treatment algorithms tied to molecular diagnostics.

Hospital networks are not merely acting as distribution nodes-they are serving as initiation hubs where biomarker testing, specialist consultation, and dosing oversight are centralized. In high-risk cancer and immune-driven admissions, small molecule agents are being used as first-line pharmacologic assets.
  • Roche Diagnostics embedded molecular companion diagnostics across major oncology centers.
  • Bristol Myers Squibb increased institutional use of kinase regimens for difficult-to-treat malignancies.
  • Takeda optimized hospital-based access pathways for proteasome inhibitors in multiple myeloma relapse settings.

Small Organic Molecules Secure Majority Share

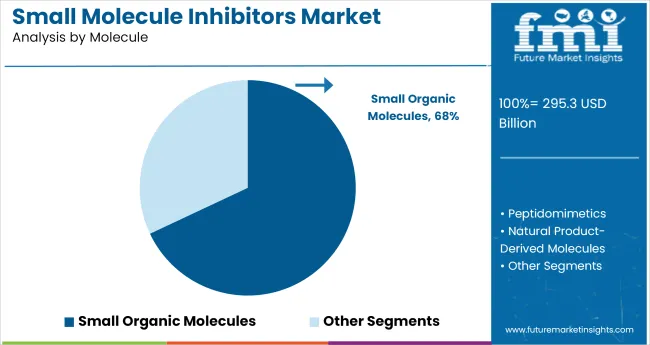
Small Molecule Inhibitors Market   Analysis By Molecule

In 2025, small organic molecules are projected to account for 68% of total sales. This share is being sustained by their proven success in targeting intracellular proteins, offering oral availability, and enabling cost-efficient manufacturing. From 2020 to 2024, a significant number of kinase inhibitors, GPCR modulators, and enzyme blockers were developed using small organic scaffolds, contributing to their dominance in oncology, immunology, and infectious disease pipelines.

The continued preference for small organic molecules reflects their pharmacokinetic advantages and compatibility with structure-based drug design. Their modularity supports rapid analog generation, making them the preferred starting point for high-throughput screening and IND filing strategies.

  • Merck & Co. advanced several oral kinase inhibitors leveraging scaffold-based optimization.
  • Novartis integrated fragment-based libraries to expand its oncology-focused small molecule pipeline.
  • Boehringer Ingelheim emphasized small organic molecules in fibrosis and neuroinflammation portfolios.

Top Small Molecule Inhibitors Market Dynamics

The industry is expanding rapidly due to advancements in drug discovery and growing demand for targeted therapies. Adoption is increasing in oncology, particularly in North America and the EU. However, high development costs, drug resistance, and regulatory delays pose significant challenges to industry growth.

Volume Growth Linked to Small Molecule Inhibitors Industry Expansion

The industry is experiencing considerable growth, propelled by innovations in drug discovery technologies and increasing demand for precision treatments. In North America, the use of these inhibitors in oncology grew by 25% in the past year, particularly in therapies targeting cancer cells.

The EU has seen 72% of newly developed oncology drugs incorporating small molecule inhibitors, contributing to a 15% reduction in hospitalization costs due to enhanced patient responses. Additionally, 43% of hospitals in Asia-Pacific have started using these inhibitors as the initial treatment for cancer, demonstrating rising adoption across the region.

  • 25% increase in demand for inhibitors in oncology in North America over the past year.
  • 72% of newly developed oncology drugs in the EU now incorporate inhibitors, improving patient outcomes.
  • 43% of hospitals in Asia-Pacific have adopted inhibitors as first-line treatments for cancer.

Challenges Linked to Small Molecule Inhibitors Development and Approval

Despite the ongoing growth in the market, significant obstacles remain. The cost of development remains a critical challenge, with R&D and clinical trial expenses consistently exceeding USD 2.6 billion per drug. Resistance mechanisms in cancer therapies are affecting the long-term efficacy of small molecule inhibitors, with resistance seen in 35% of cancer patients receiving treatment. Regulatory delays continue to hamper progress, with 18% of new small molecule inhibitor applications encountering approval holdups in the EU and U.S. due to complicated and varying standards.
  • Development costs for inhibitors consistently exceed USD 2.6 billion, limiting progress, particularly for smaller firms.
  • Resistance mechanisms are identified in 35% of patients, undermining the sustained effectiveness of small molecule inhibitors.
  • Regulatory delays affect 18% of new small molecule inhibitor applications in the EU and U.S., slowing market entry.

Top Countries Researching, Developing and Commercializing Small Molecule Inhibitors

Small Molecule Inhibitors Market   CAGR Analysis By Country

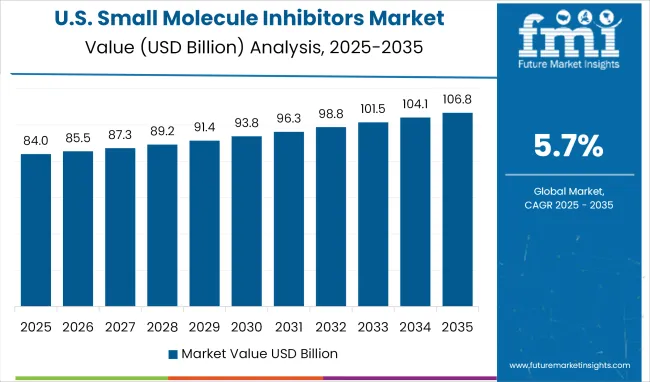
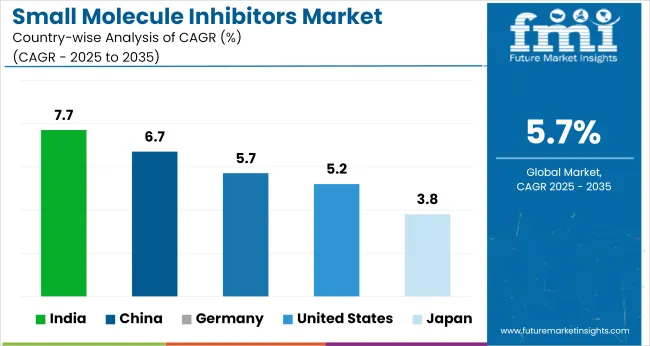
The global small molecule inhibitors market is projected to grow at 5.7% CAGR from 2025 to 2035. Among the 40+ countries analyzed, India leads with 7.7%, followed by China at 6.7%. Both BRICS nations are benefitting from expanded API manufacturing zones, fast-tracked clinical trial approvals, and increasing participation in global oncology supply chains. Domestic companies are investing in kinase inhibitor portfolios targeting breast and lung cancer segments.

Germany, an OECD country, matches the global average at 5.7%, driven by steady institutional demand and reimbursement-backed launches. The United States follows at 5.2%, with market entry slowed by pricing scrutiny and extended HTA cycles. Japan posts the lowest growth at 3.8%, constrained by longer regulatory timelines and stricter formulary restrictions. Diverging growth rates reflect policy regimes, patent cliffs, and the pace of clinical adoption across OECD and BRICS blocs.

Countries CAGR (2025-2035)
United States 5.2%
Germany 5.7%
China 6.7%
Japan 3.8%
India 7.7%

Growth Outlook of the United States Small Molecule Inhibitors Market

Small Molecule Inhibitors Market   Country Value Analysis

A CAGR of 5.2% has been projected for 2025;2035, compared to 3.9% during 2020;2024. During the historical phase, small molecule inhibitors were primarily prescribed in oncology, with limited uptake in primary care settings. The forecast period is expected to reflect broader therapeutic integration, as these inhibitors are increasingly preferred over biologics in autoimmune and metabolic disorders. Patient accessibility has improved due to oral formats and home-care protocols. Formulary inclusion under Medicare accelerated wider coverage, prompting higher outpatient demand.

  • Oncology contributed 48% of inhibitor-related revenue in 2025
  • Kinase-targeting drugs made up 63% of new U.S. filings in 2027
  • Medicare reimbursements increased therapeutic access by 2.2× from 2025 to 2029

In-Depth Analysis of the Small Molecule Inhibitors Market in Germany

Germany posted a projected CAGR of 5.7% for 2025;2035, improving from 4.3% in the 2020;2024 phase. Small molecule inhibitors were initially limited to oncology-based settings. By 2025, a therapeutic expansion into dermatology, neurology, and rheumatology contributed to broader adoption. National reimbursement plans and faster CE approvals allowed physicians to prioritize these inhibitors in outpatient protocols. Public-private partnerships fostered domestic production of generics, while EU-wide procurement frameworks enhanced regional distribution.

  • JAK and BTK prescriptions rose by 38% year-on-year by 2026
  • Public-sector trials funded 22% of national inhibitor access by 2028
  • Biosimilar penetration reached 2.6× the 2024 baseline by 2029

China Small Molecule Inhibitors Market Growth Outlook

The China market is projected to expand at a CAGR of 6.7% during 2025;2035, compared to 5.6% between 2020 and 2024. Initial demand for these inhibitors was focused on high-cost, imported oncology treatments. A significant shift has occurred with the rise of domestic players and fast-tracked NMPA approvals. Small molecule inhibitors are now widely used across gastroenterology, hematology, and infectious diseases. Government tenders and bulk purchase mechanisms have made pricing more competitive across provincial hospitals.

  • API manufacturing capacity increased 58% between 2025 and 2028
  • Over 40 small molecule inhibitor products approved by NMPA in 2026
  • Public hospital uptake rose by 3.1× from 2025 to 2029

Demand Analysis for the Small Molecule Inhibitors Market in Japan

Japan recorded a projected CAGR of 3.8% from 2025 to 2035, up from 3.1% during 2020;2024. Limited early-stage growth was linked to brand-dominated prescribing and slow PMDA approvals. Recent policy changes enabled greater clinical use of small molecule inhibitors beyond oncology, particularly in respiratory and dermatological conditions. Improved pharmacist training and expanded point-of-care dispensing have also supported wider usage. Japanese companies have begun accelerating post-market studies to extend therapeutic labels.

  • Oncology retained 74% of market share in 2025
  • Oral inhibitor prescriptions grew at 4.2% per year from 2025 to 2028
  • Market entry timelines shortened by 18% due to regulatory reform in 2026

India Small Molecule Inhibitors Market Growth Trajectory

A CAGR of 7.7% has been forecasted for 2025;2035, improving from 5.9% during 2020;2024. In the earlier period, small molecule inhibitors were restricted to high-end oncology hospitals in metro cities. By 2025, rapid expansion of domestic API production in Gujarat and Telangana, along with digital prescription platforms, boosted rural and semi-urban access. Government programs now promote inhibitors for respiratory, inflammatory, and cardiovascular indications, particularly through public hospitals and D2C channels.

  • Domestic API production met 61% of demand in 2027
  • Government schemes drove 3.8× rise in purchases from 2025 to 2029
  • Over 90 branded generics launched by Indian companies between 2025 and 2030

Leading Companies in Small Molecule Inhibitors Market

Leading Company ; Novartis AG; Industry Share ; 11%
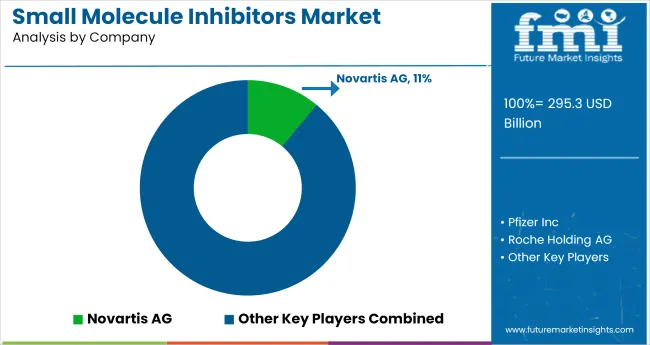
Small Molecule Inhibitors Market   Analysis By Company

The small molecule inhibitors market features a fragmented but intensifying competitive environment, segmented into dominant pharmaceutical innovators, oncology-focused developers, and targeted therapy specialists. Novartis, Pfizer, and Roche lead the category with blockbuster molecules in cancer, inflammation, and cardiovascular pathways. These players leverage proprietary R&D engines, biologics-small molecule hybrids, and multi-indication regulatory strategies to maintain dominance.

Key players like AstraZeneca, Merck & Co., and Bristol-Myers Squibb are doubling down on kinase and PARP inhibitor pipelines, with parallel expansion into companion diagnostics and biosimilars to hedge revenue dependencies. Meanwhile, firms such as Janssen, AbbVie, and Eli Lilly are scaling oral therapeutic portfolios targeting hematological and autoimmune indications.

Emerging participants, including Gilead Sciences, Takeda, and Amgen, are pivoting toward allosteric inhibitors, synthetic lethality, and precision drug delivery technologies. Most companies are advancing three strategic priorities: improving oral bioavailability and selectivity, integrating digital biomarkers for dose modulation, and co-developing synergistic combination regimens to elevate treatment outcomes and lifecycle value.

Recent Small Molecule Inhibitors Industry News

  • In July 2025, Novartis received Swissmedic approval for Coartem Baby, a pediatric antimalarial, to be distributed on a not-for-profit basis in Africa.
  • In October 2024, Pfizer secured FDA approval for Hympavzi, the first once-weekly small-molecule therapy for hemophilia A or B patients without inhibitors, improving treatment adherence.


Research Coverage and Scope Summary

Report Attributes Details
Industry Size (2025) USD 295.3 billion
Projected Industry Size (2035) USD 514.1 billion
CAGR (2025 to 2035) 5.7%
Base Year for Estimation 2024
Historical Period 2020 to 2024
Projections Period 2025 to 2035
Quantitative Units USD billion for value and million doses for volume
Drug Classes Analyzed (Segment 1)/p> Kinase Inhibitors, Proteasome Inhibitors, PARP Inhibitors, BCL-2 Inhibitors, BTK Inhibitors, CDK Inhibitors, Immunomodulatory Small Molecules, CGRP Inhibitors, Others
Therapeutic Areas Analyzed (Segment 2) Oncology, Autoimmune and Inflammatory Diseases, Infectious Diseases, Neurology, Cardiovascular and Metabolic Disorders, Rare Diseases, Pain Management
Sales Channels Analyzed (Segment 3) Hospitals, Cancer Research Institutes, Specialty Clinics, Retail Pharmacy Chains, Specialty Pharmacies, Mail Order Pharmacies
Molecules Analyzed (Segment 4) Small Organic Molecules, Peptidomimetics, Natural Product-Derived Molecules
Regions Covered North America, Latin America, Western Europe, Eastern Europe, East Asia, South Asia & Pacific
Countries Covered United States, Canada, Germany, United Kingdom, France, Italy, Spain, China, India, Japan, South Korea, Australia, Brazil, Mexico, Argentina, Saudi Arabia, UAE, South Africa
Key Players Novartis AG, Pfizer Inc, Roche Holding AG, Bristol-Myers Squibb, AstraZeneca plc, Merck & Co., Inc., Janssen Pharmaceuticals, AbbVie Inc., Takeda Pharmaceutical Co, Gilead Sciences, Inc., Eli Lilly and Company, Amgen Inc.
Additional Attributes Dollar sales by molecule and therapeutic area, oncology market leadership, emerging peptidomimetic therapies, expansion of immunomodulatory inhibitor use, shift toward outpatient and specialty pharmacy distribution

Leading Players in Small Molecule Inhibitors Market

  • Novartis AG
  • Pfizer Inc
  • Roche Holding AG
  • Bristol-Myers Squibb
  • AstraZeneca plc
  • Merck & Co., Inc.
  • Janssen Pharmaceuticals
  • AbbVie Inc.
  • Takeda Pharmaceutical Co
  • Gilead Sciences, Inc.
  • Eli Lilly and Company
  • Amgen Inc.

Key Segments

By Drug Class:

The industry includes kinase inhibitors, proteasome inhibitors, PARP inhibitors, BCL-2 inhibitors, BTK inhibitors, CDK inhibitors, immunomodulatory small molecules, CGRP inhibitors, and others.

By Therapeutic Are:

The industry covers oncology, autoimmune and inflammatory diseases, infectious diseases, neurology, cardiovascular and metabolic disorders, rare diseases, and pain management.

By Sales Channel:

These products are distributed through hospitals, cancer research institutes, specialty clinics, retail pharmacy chains, specialty pharmacies, and mail order pharmacies.

By Molecule:

The segmentation includes small organic molecules, peptidomimetics, and natural product-derived molecules.

By Region:

The industry is segmented as North America, Latin America, Western Europe, Eastern Europe, East Asia, South Asia & Pacific.

Table of Content

  • Executive Summary
    • Global Market Outlook
    • Demand-side Trends
    • Supply-side Trends
    • Technology Roadmap Analysis
    • Analysis and Recommendations
  • Market Overview
    • Market Coverage / Taxonomy
    • Market Definition / Scope / Limitations
  • Market Background
    • Market Dynamics
      • Drivers
      • Restraints
      • Opportunity
      • Trends
    • Scenario Forecast
      • Demand in Optimistic Scenario
      • Demand in Likely Scenario
      • Demand in Conservative Scenario
    • Opportunity Map Analysis
    • Product Life Cycle Analysis
    • Supply Chain Analysis
      • Supply Side Participants and their Roles
        • Producers
        • Mid-Level Participants (Traders/ Agents/ Brokers)
        • Wholesalers and Distributors
      • Value Added and Value Created at Node in the Supply Chain
      • List of Raw Material Suppliers
      • List of Existing and Potential Buyer’s
    • Investment Feasibility Matrix
    • Value Chain Analysis
      • Profit Margin Analysis
      • Wholesalers and Distributors
      • Retailers
    • PESTLE and Porter’s Analysis
    • Regulatory Landscape
      • By Key Regions
      • By Key Countries
    • Regional Parent Market Outlook
    • Production and Consumption Statistics
    • Import and Export Statistics
  • Global Market Analysis 2020-2024 and Forecast, 2025-2035
    • Historical Market Size Value (USD Billion) & Volume (Mn Doses) Analysis, 2020-2024
    • Current and Future Market Size Value (USD Billion) & Volume (Mn Doses) Projections, 2025-2035
      • Y-o-Y Growth Trend Analysis
      • Absolute $ Opportunity Analysis
  • Global Market Pricing Analysis 2020-2024 and Forecast 2025-2035
  • Global Market Analysis 2020-2024 and Forecast 2025-2035, By Drug Class
    • Introduction / Key Findings
    • Historical Market Size Value (USD Billion) & Volume (Mn Doses) Analysis By Drug Class, 2020-2024
    • Current and Future Market Size Value (USD Billion) & Volume (Mn Doses) Analysis and Forecast By Drug Class, 2025-2035
      • Kinase Inhibitors
      • Proteasome Inhibitors
      • PARP Inhibitors
      • BCL-2 Inhibitors
      • BTK Inhibitors
      • CDK Inhibitors
      • Immunomodulatory Small Molecules
      • CGRP Inhibitors
      • Others
    • Y-o-Y Growth Trend Analysis By Drug Class, 2020-2024
    • Absolute $ Opportunity Analysis By Drug Class, 2025-2035
  • Global Market Analysis 2020-2024 and Forecast 2025-2035, By Therapeutic Area
    • Introduction / Key Findings
    • Historical Market Size Value (USD Billion) & Volume (Mn Doses) Analysis By Therapeutic Area, 2020-2024
    • Current and Future Market Size Value (USD Billion) & Volume (Mn Doses) Analysis and Forecast By Therapeutic Area, 2025-2035
      • Oncology
      • Autoimmune & Inflammatory Diseases
      • Infectious Diseases
      • Neurology
      • Cardiovascular and Metabolic Disorders
      • Rare Diseases
      • Pain Management
    • Y-o-Y Growth Trend Analysis By Therapeutic Area, 2020-2024
    • Absolute $ Opportunity Analysis By Therapeutic Area, 2025-2035
  • Global Market Analysis 2020-2024 and Forecast 2025-2035, By Sales Channel
    • Introduction / Key Findings
    • Historical Market Size Value (USD Billion) & Volume (Mn Doses) Analysis By Sales Channel, 2020-2024
    • Current and Future Market Size Value (USD Billion) & Volume (Mn Doses) Analysis and Forecast By Sales Channel, 2025-2035
      • Hospitals
      • Cancer Research Institutes
      • Speciality Clinics
      • Retail Pharmacy Chains
      • Speciality Pharmacies
      • Mail Order Pharmacies
    • Y-o-Y Growth Trend Analysis By Sales Channel, 2020-2024
    • Absolute $ Opportunity Analysis By Sales Channel, 2025-2035
  • Global Market Analysis 2020-2024 and Forecast 2025-2035, By Molecule
    • Introduction / Key Findings
    • Historical Market Size Value (USD Billion) & Volume (Mn Doses) Analysis By Molecule, 2020-2024
    • Current and Future Market Size Value (USD Billion) & Volume (Mn Doses) Analysis and Forecast By Molecule, 2025-2035
      • Small Organic Molecules
      • Peptidomimetics
      • Natural Product-Derived Molecules
    • Y-o-Y Growth Trend Analysis By Molecule, 2020-2024
    • Absolute $ Opportunity Analysis By Molecule, 2025-2035
  • Global Market Analysis 2020-2024 and Forecast 2025-2035, By Region
    • Introduction
    • Historical Market Size Value (USD Billion) & Volume (Mn Doses) Analysis By Region, 2020-2024
    • Current Market Size Value (USD Billion) & Volume (Mn Doses) Analysis and Forecast By Region, 2025-2035
      • North America
      • Latin America
      • Western Europe
      • Eastern Europe
      • East Asia
      • South Asia & Pacific
      • Middle East and Africa
    • Market Attractiveness Analysis By Region
  • North America Market Analysis 2020-2024 and Forecast 2025-2035, By Country
    • Historical Market Size Value (USD Billion) & Volume (Mn Doses) Trend Analysis By Market Taxonomy, 2020-2024
    • Market Size Value (USD Billion) & Volume (Mn Doses) Forecast By Market Taxonomy, 2025-2035
      • By Country
        • U.S.
        • Canada
        • Mexico
      • By Drug Class
      • By Therapeutic Area
      • By Sales Channel
      • By Molecule
    • Market Attractiveness Analysis
      • By Country
      • By Drug Class
      • By Therapeutic Area
      • By Sales Channel
      • By Molecule
    • Key Takeaways
  • Latin America Market Analysis 2020-2024 and Forecast 2025-2035, By Country
    • Historical Market Size Value (USD Billion) & Volume (Mn Doses) Trend Analysis By Market Taxonomy, 2020-2024
    • Market Size Value (USD Billion) & Volume (Mn Doses) Forecast By Market Taxonomy, 2025-2035
      • By Country
        • Brazil 
        • Argentina
        • Rest of LATAM
      • By Drug Class
      • By Therapeutic Area
      • By Sales Channel
      • By Molecule
    • Market Attractiveness Analysis
      • By Country
      • By Drug Class
      • By Therapeutic Area
      • By Sales Channel
      • By Molecule
    • Key Takeaways
  • Western Europe Market Analysis 2020-2024 and Forecast 2025-2035, By Country
    • Historical Market Size Value (USD Billion) & Volume (Mn Doses) Trend Analysis By Market Taxonomy, 2020-2024
    • Market Size Value (USD Billion) & Volume (Mn Doses) Forecast By Market Taxonomy, 2025-2035
      • By Country
        • Germany
        • Italy
        • France
        • UK
        • Spain
        • BENELUX
        • Nordic
        • Rest of W.Europe
      • By Drug Class
      • By Therapeutic Area
      • By Sales Channel
      • By Molecule
    • Market Attractiveness Analysis
      • By Country
      • By Drug Class
      • By Therapeutic Area
      • By Sales Channel
      • By Molecule
    • Key Takeaways
  • Eastern Europe Market Analysis 2020-2024 and Forecast 2025-2035, By Country
    • Historical Market Size Value (USD Billion) & Volume (Mn Doses) Trend Analysis By Market Taxonomy, 2020-2024
    • Market Size Value (USD Billion) & Volume (Mn Doses) Forecast By Market Taxonomy, 2025-2035
      • By Country
        • Russia
        • Hungary
        • Poland
        • Balkan & Baltics
        • Rest of E. Europe
      • By Drug Class
      • By Therapeutic Area
      • By Sales Channel
      • By Molecule
    • Market Attractiveness Analysis
      • By Country
      • By Drug Class
      • By Therapeutic Area
      • By Sales Channel
      • By Molecule
    • Key Takeaways
  • East Asia Market Analysis 2020-2024 and Forecast 2025-2035, By Country
    • Historical Market Size Value (USD Billion) & Volume (Mn Doses) Trend Analysis By Market Taxonomy, 2020-2024
    • Market Size Value (USD Billion) & Volume (Mn Doses) Forecast By Market Taxonomy, 2025-2035
      • By Country
        • China
        • Japan
        • South Korea
      • By Drug Class
      • By Therapeutic Area
      • By Sales Channel
      • By Molecule
    • Market Attractiveness Analysis
      • By Country
      • By Drug Class
      • By Therapeutic Area
      • By Sales Channel
      • By Molecule
    • Key Takeaways
  • South Asia & Pacific Market Analysis 2020-2024 and Forecast 2025-2035, By Country
    • Historical Market Size Value (USD Billion) & Volume (Mn Doses) Trend Analysis By Market Taxonomy, 2020-2024
    • Market Size Value (USD Billion) & Volume (Mn Doses) Forecast By Market Taxonomy, 2025-2035
      • By Country
        • India
        • Australia & New Zealand
        • ASEAN
        • Rest of SAP
      • By Drug Class
      • By Therapeutic Area
      • By Sales Channel
      • By Molecule
    • Market Attractiveness Analysis
      • By Country
      • By Drug Class
      • By Therapeutic Area
      • By Sales Channel
      • By Molecule
    • Key Takeaways
  • Middle East and Africa Market Analysis 2020-2024 and Forecast 2025-2035, By Country
    • Historical Market Size Value (USD Billion) & Volume (Mn Doses) Trend Analysis By Market Taxonomy, 2020-2024
    • Market Size Value (USD Billion) & Volume (Mn Doses) Forecast By Market Taxonomy, 2025-2035
      • By Country
        • GCC Countries
        • Northern Africa
        • South Africa
        • Turkiye
        • Rest of MEA
      • By Drug Class
      • By Therapeutic Area
      • By Sales Channel
      • By Molecule
    • Market Attractiveness Analysis
      • By Country
      • By Drug Class
      • By Therapeutic Area
      • By Sales Channel
      • By Molecule
    • Key Takeaways
  • Key Countries Market Analysis
    • U.S.
      • Pricing Analysis
      • Market Share Analysis, 2024
        • By Drug Class
        • By Therapeutic Area
        • By Sales Channel
        • By Molecule
    • Canada
      • Pricing Analysis
      • Market Share Analysis, 2024
        • By Drug Class
        • By Therapeutic Area
        • By Sales Channel
        • By Molecule
    • Brazil
      • Pricing Analysis
      • Market Share Analysis, 2024
        • By Drug Class
        • By Therapeutic Area
        • By Sales Channel
        • By Molecule
    • Mexico
      • Pricing Analysis
      • Market Share Analysis, 2024
        • By Drug Class
        • By Therapeutic Area
        • By Sales Channel
        • By Molecule
    • Argentina
      • Pricing Analysis
      • Market Share Analysis, 2024
        • By Drug Class
        • By Therapeutic Area
        • By Sales Channel
        • By Molecule
  • Market Structure Analysis
    • Competition Dashboard
    • Competition Benchmarking
    • Market Share Analysis of Top Players
      • By Regional
      • By Drug Class
      • By Therapeutic Area
      • By Sales Channel
      • By Molecule
  • Competition Analysis
    • Competition Deep Dive
      • Novartis AG
        • Overview
        • Product Portfolio
        • Profitability by Market Segments (Product/Age /Sales Channel/Region)
        • Sales Footprint
        • Strategy Overview
          • Marketing Strategy
          • Product Strategy
          • Channel Strategy
      • Pfizer Inc
        • Overview
        • Product Portfolio
        • Profitability by Market Segments (Product/Age /Sales Channel/Region)
        • Sales Footprint
        • Strategy Overview
          • Marketing Strategy
          • Product Strategy
          • Channel Strategy
      • Roche Holding AG
        • Overview
        • Product Portfolio
        • Profitability by Market Segments (Product/Age /Sales Channel/Region)
        • Sales Footprint
        • Strategy Overview
          • Marketing Strategy
          • Product Strategy
          • Channel Strategy
      • Bristol-Myers Squibb
        • Overview
        • Product Portfolio
        • Profitability by Market Segments (Product/Age /Sales Channel/Region)
        • Sales Footprint
        • Strategy Overview
          • Marketing Strategy
          • Product Strategy
          • Channel Strategy
      • AstraZeneca plc
        • Overview
        • Product Portfolio
        • Profitability by Market Segments (Product/Age /Sales Channel/Region)
        • Sales Footprint
        • Strategy Overview
          • Marketing Strategy
          • Product Strategy
          • Channel Strategy
      • Merck & Co., Inc.
        • Overview
        • Product Portfolio
        • Profitability by Market Segments (Product/Age /Sales Channel/Region)
        • Sales Footprint
        • Strategy Overview
          • Marketing Strategy
          • Product Strategy
          • Channel Strategy
      • Janssen Pharmaceuticals
        • Overview
        • Product Portfolio
        • Profitability by Market Segments (Product/Age /Sales Channel/Region)
        • Sales Footprint
        • Strategy Overview
          • Marketing Strategy
          • Product Strategy
          • Channel Strategy
      • AbbVie Inc.
        • Overview
        • Product Portfolio
        • Profitability by Market Segments (Product/Age /Sales Channel/Region)
        • Sales Footprint
        • Strategy Overview
          • Marketing Strategy
          • Product Strategy
          • Channel Strategy
      • Takeda Pharmaceutical Co
        • Overview
        • Product Portfolio
        • Profitability by Market Segments (Product/Age /Sales Channel/Region)
        • Sales Footprint
        • Strategy Overview
          • Marketing Strategy
          • Product Strategy
          • Channel Strategy
      • Gilead Sciences, Inc.
        • Overview
        • Product Portfolio
        • Profitability by Market Segments (Product/Age /Sales Channel/Region)
        • Sales Footprint
        • Strategy Overview
          • Marketing Strategy
          • Product Strategy
          • Channel Strategy
      • Eli Lilly and Company
        • Overview
        • Product Portfolio
        • Profitability by Market Segments (Product/Age /Sales Channel/Region)
        • Sales Footprint
        • Strategy Overview
          • Marketing Strategy
          • Product Strategy
          • Channel Strategy
      • Amgen Inc.
        • Overview
        • Product Portfolio
        • Profitability by Market Segments (Product/Age /Sales Channel/Region)
        • Sales Footprint
        • Strategy Overview
          • Marketing Strategy
          • Product Strategy
          • Channel Strategy
  • Assumptions & Acronyms Used
  • Research Methodology

  •  

List of Tables

  • Table 1: Global Market Value (USD Billion) Forecast by Region, 2020-2035
  • Table 2: Global Market Volume (Mn Doses) Forecast by Region, 2020-2035
  • Table 3: Global Market Value (USD Billion) Forecast by Drug Class, 2020-2035
  • Table 4: Global Market Volume (Mn Doses) Forecast by Drug Class, 2020-2035
  • Table 5: Global Market Value (USD Billion) Forecast by Therapeutic Area, 2020-2035
  • Table 6: Global Market Volume (Mn Doses) Forecast by Therapeutic Area, 2020-2035
  • Table 7: Global Market Value (USD Billion) Forecast by Sales Channel, 2020-2035
  • Table 8: Global Market Volume (Mn Doses) Forecast by Sales Channel, 2020-2035
  • Table 9: Global Market Value (USD Billion) Forecast by Molecule, 2020-2035
  • Table 10: Global Market Volume (Mn Doses) Forecast by Molecule, 2020-2035
  • Table 11: North America Market Value (USD Billion) Forecast by Country, 2020-2035
  • Table 12: North America Market Volume (Mn Doses) Forecast by Country, 2020-2035
  • Table 13: North America Market Value (USD Billion) Forecast by Drug Class, 2020-2035
  • Table 14: North America Market Volume (Mn Doses) Forecast by Drug Class, 2020-2035
  • Table 15: North America Market Value (USD Billion) Forecast by Therapeutic Area, 2020-2035
  • Table 16: North America Market Volume (Mn Doses) Forecast by Therapeutic Area, 2020-2035
  • Table 17: North America Market Value (USD Billion) Forecast by Sales Channel, 2020-2035
  • Table 18: North America Market Volume (Mn Doses) Forecast by Sales Channel, 2020-2035
  • Table 19: North America Market Value (USD Billion) Forecast by Molecule, 2020-2035
  • Table 20: North America Market Volume (Mn Doses) Forecast by Molecule, 2020-2035
  • Table 21: Latin America Market Value (USD Billion) Forecast by Country, 2020-2035
  • Table 22: Latin America Market Volume (Mn Doses) Forecast by Country, 2020-2035
  • Table 23: Latin America Market Value (USD Billion) Forecast by Drug Class, 2020-2035
  • Table 24: Latin America Market Volume (Mn Doses) Forecast by Drug Class, 2020-2035
  • Table 25: Latin America Market Value (USD Billion) Forecast by Therapeutic Area, 2020-2035
  • Table 26: Latin America Market Volume (Mn Doses) Forecast by Therapeutic Area, 2020-2035
  • Table 27: Latin America Market Value (USD Billion) Forecast by Sales Channel, 2020-2035
  • Table 28: Latin America Market Volume (Mn Doses) Forecast by Sales Channel, 2020-2035
  • Table 29: Latin America Market Value (USD Billion) Forecast by Molecule, 2020-2035
  • Table 30: Latin America Market Volume (Mn Doses) Forecast by Molecule, 2020-2035
  • Table 31: Western Europe Market Value (USD Billion) Forecast by Country, 2020-2035
  • Table 32: Western Europe Market Volume (Mn Doses) Forecast by Country, 2020-2035
  • Table 33: Western Europe Market Value (USD Billion) Forecast by Drug Class, 2020-2035
  • Table 34: Western Europe Market Volume (Mn Doses) Forecast by Drug Class, 2020-2035
  • Table 35: Western Europe Market Value (USD Billion) Forecast by Therapeutic Area, 2020-2035
  • Table 36: Western Europe Market Volume (Mn Doses) Forecast by Therapeutic Area, 2020-2035
  • Table 37: Western Europe Market Value (USD Billion) Forecast by Sales Channel, 2020-2035
  • Table 38: Western Europe Market Volume (Mn Doses) Forecast by Sales Channel, 2020-2035
  • Table 39: Western Europe Market Value (USD Billion) Forecast by Molecule, 2020-2035
  • Table 40: Western Europe Market Volume (Mn Doses) Forecast by Molecule, 2020-2035
  • Table 41: Eastern Europe Market Value (USD Billion) Forecast by Country, 2020-2035
  • Table 42: Eastern Europe Market Volume (Mn Doses) Forecast by Country, 2020-2035
  • Table 43: Eastern Europe Market Value (USD Billion) Forecast by Drug Class, 2020-2035
  • Table 44: Eastern Europe Market Volume (Mn Doses) Forecast by Drug Class, 2020-2035
  • Table 45: Eastern Europe Market Value (USD Billion) Forecast by Therapeutic Area, 2020-2035
  • Table 46: Eastern Europe Market Volume (Mn Doses) Forecast by Therapeutic Area, 2020-2035
  • Table 47: Eastern Europe Market Value (USD Billion) Forecast by Sales Channel, 2020-2035
  • Table 48: Eastern Europe Market Volume (Mn Doses) Forecast by Sales Channel, 2020-2035
  • Table 49: Eastern Europe Market Value (USD Billion) Forecast by Molecule, 2020-2035
  • Table 50: Eastern Europe Market Volume (Mn Doses) Forecast by Molecule, 2020-2035
  • Table 51: East Asia Market Value (USD Billion) Forecast by Country, 2020-2035
  • Table 52: East Asia Market Volume (Mn Doses) Forecast by Country, 2020-2035
  • Table 53: East Asia Market Value (USD Billion) Forecast by Drug Class, 2020-2035
  • Table 54: East Asia Market Volume (Mn Doses) Forecast by Drug Class, 2020-2035
  • Table 55: East Asia Market Value (USD Billion) Forecast by Therapeutic Area, 2020-2035
  • Table 56: East Asia Market Volume (Mn Doses) Forecast by Therapeutic Area, 2020-2035
  • Table 57: East Asia Market Value (USD Billion) Forecast by Sales Channel, 2020-2035
  • Table 58: East Asia Market Volume (Mn Doses) Forecast by Sales Channel, 2020-2035
  • Table 59: East Asia Market Value (USD Billion) Forecast by Molecule, 2020-2035
  • Table 60: East Asia Market Volume (Mn Doses) Forecast by Molecule, 2020-2035
  • Table 61: South Asia & Pacific Market Value (USD Billion) Forecast by Country, 2020-2035
  • Table 62: South Asia & Pacific Market Volume (Mn Doses) Forecast by Country, 2020-2035
  • Table 63: South Asia & Pacific Market Value (USD Billion) Forecast by Drug Class, 2020-2035
  • Table 64: South Asia & Pacific Market Volume (Mn Doses) Forecast by Drug Class, 2020-2035
  • Table 65: South Asia & Pacific Market Value (USD Billion) Forecast by Therapeutic Area, 2020-2035
  • Table 66: South Asia & Pacific Market Volume (Mn Doses) Forecast by Therapeutic Area, 2020-2035
  • Table 67: South Asia & Pacific Market Value (USD Billion) Forecast by Sales Channel, 2020-2035
  • Table 68: South Asia & Pacific Market Volume (Mn Doses) Forecast by Sales Channel, 2020-2035
  • Table 69: South Asia & Pacific Market Value (USD Billion) Forecast by Molecule, 2020-2035
  • Table 70: South Asia & Pacific Market Volume (Mn Doses) Forecast by Molecule, 2020-2035
  • Table 71: Middle East and Africa Market Value (USD Billion) Forecast by Country, 2020-2035
  • Table 72: Middle East and Africa Market Volume (Mn Doses) Forecast by Country, 2020-2035
  • Table 73: Middle East and Africa Market Value (USD Billion) Forecast by Drug Class, 2020-2035
  • Table 74: Middle East and Africa Market Volume (Mn Doses) Forecast by Drug Class, 2020-2035
  • Table 75: Middle East and Africa Market Value (USD Billion) Forecast by Therapeutic Area, 2020-2035
  • Table 76: Middle East and Africa Market Volume (Mn Doses) Forecast by Therapeutic Area, 2020-2035
  • Table 77: Middle East and Africa Market Value (USD Billion) Forecast by Sales Channel, 2020-2035
  • Table 78: Middle East and Africa Market Volume (Mn Doses) Forecast by Sales Channel, 2020-2035
  • Table 79: Middle East and Africa Market Value (USD Billion) Forecast by Molecule, 2020-2035
  • Table 80: Middle East and Africa Market  Volume (Mn Doses) Forecast by Molecule, 2020-2035
     

List of Figures

  • Figure 1: Global Market Volume (Mn Doses) Forecast 2020–2035
  • Figure 2: Global Market Pricing Analysis
  • Figure 3: Global Market Value (USD Billion) Forecast 2020–2035
  • Figure 4: Global Market Value Share and BPS Analysis by Drug Class, 2025 and 2035
  • Figure 5: Global Market Y-o-Y Growth Comparison by Drug Class, 2025–2035
  • Figure 6: Global Market Attractiveness Analysis by Drug Class
  • Figure 7: Global Market Value Share and BPS Analysis by Therapeutic Area, 2025 and 2035
  • Figure 8: Global Market Y-o-Y Growth Comparison by Therapeutic Area, 2025–2035
  • Figure 9: Global Market Attractiveness Analysis by Therapeutic Area
  • Figure 10: Global Market Value Share and BPS Analysis by Sales Channel, 2025 and 2035
  • Figure 11: Global Market Y-o-Y Growth Comparison by Sales Channel, 2025–2035
  • Figure 12: Global Market Attractiveness Analysis by Sales Channel
  • Figure 13: Global Market Value Share and BPS Analysis by Molecule, 2025 and 2035
  • Figure 14: Global Market Y-o-Y Growth Comparison by Molecule, 2025–2035
  • Figure 15: Global Market Attractiveness Analysis by Molecule
  • Figure 16: Global Market Value (USD Billion) Share and BPS Analysis by Region, 2025 and 2035
  • Figure 17: Global Market Y-o-Y Growth Comparison by Region, 2025–2035
  • Figure 18: Global Market Attractiveness Analysis by Region
  • Figure 19: North America Market Incremental $ Opportunity, 2025–2035
  • Figure 20: Latin America Market Incremental $ Opportunity, 2025–2035
  • Figure 21: Western Europe Market Incremental $ Opportunity, 2025–2035
  • Figure 22: Eastern Europe Market Incremental $ Opportunity, 2025–2035
  • Figure 23: East Asia Market Incremental $ Opportunity, 2025–2035
  • Figure 24: South Asia & Pacific Market Incremental $ Opportunity, 2025–2035
  • Figure 25: Middle East and Africa Market Incremental $ Opportunity, 2025–2035
  • Figure 26: North America Market Value Share and BPS Analysis by Country, 2025 and 2035
  • Figure 27: North America Market Value Share and BPS Analysis by Drug Class, 2025 and 2035
  • Figure 28: North America Market Y-o-Y Growth Comparison by Drug Class, 2025–2035
  • Figure 29: North America Market Attractiveness Analysis by Drug Class
  • Figure 30: North America Market Value Share and BPS Analysis by Therapeutic Area, 2025 and 2035
  • Figure 31: North America Market Y-o-Y Growth Comparison by Therapeutic Area, 2025–2035
  • Figure 32: North America Market Attractiveness Analysis by Therapeutic Area
  • Figure 33: North America Market Value Share and BPS Analysis by Sales Channel, 2025 and 2035
  • Figure 34: North America Market Y-o-Y Growth Comparison by Sales Channel, 2025–2035
  • Figure 35: North America Market Attractiveness Analysis by Sales Channel
  • Figure 36: North America Market Value Share and BPS Analysis by Molecule, 2025 and 2035
  • Figure 37: North America Market Y-o-Y Growth Comparison by Molecule, 2025–2035
  • Figure 38: North America Market Attractiveness Analysis by Molecule
  • Figure 39: Latin America Market Value Share and BPS Analysis by Country, 2025 and 2035
  • Figure 40: Latin America Market Value Share and BPS Analysis by Drug Class, 2025 and 2035
  • Figure 41: Latin America Market Y-o-Y Growth Comparison by Drug Class, 2025–2035
  • Figure 42: Latin America Market Attractiveness Analysis by Drug Class
  • Figure 43: Latin America Market Value Share and BPS Analysis by Therapeutic Area, 2025 and 2035
  • Figure 44: Latin America Market Y-o-Y Growth Comparison by Therapeutic Area, 2025–2035
  • Figure 45: Latin America Market Attractiveness Analysis by Therapeutic Area
  • Figure 46: Latin America Market Value Share and BPS Analysis by Sales Channel, 2025 and 2035
  • Figure 47: Latin America Market Y-o-Y Growth Comparison by Sales Channel, 2025–2035
  • Figure 48: Latin America Market Attractiveness Analysis by Sales Channel
  • Figure 49: Latin America Market Value Share and BPS Analysis by Molecule, 2025 and 2035
  • Figure 50: Latin America Market Y-o-Y Growth Comparison by Molecule, 2025–2035
  • Figure 51: Latin America Market Attractiveness Analysis by Molecule
  • Figure 52: Western Europe Market Value Share and BPS Analysis by Country, 2025 and 2035
  • Figure 53: Western Europe Market Value Share and BPS Analysis by Drug Class, 2025 and 2035
  • Figure 54: Western Europe Market Y-o-Y Growth Comparison by Drug Class, 2025–2035
  • Figure 55: Western Europe Market Attractiveness Analysis by Drug Class
  • Figure 56: Western Europe Market Value Share and BPS Analysis by Therapeutic Area, 2025 and 2035
  • Figure 57: Western Europe Market Y-o-Y Growth Comparison by Therapeutic Area, 2025–2035
  • Figure 58: Western Europe Market Attractiveness Analysis by Therapeutic Area
  • Figure 59: Western Europe Market Value Share and BPS Analysis by Sales Channel, 2025 and 2035
  • Figure 60: Western Europe Market Y-o-Y Growth Comparison by Sales Channel, 2025–2035
  • Figure 61: Western Europe Market Attractiveness Analysis by Sales Channel
  • Figure 62: Western Europe Market Value Share and BPS Analysis by Molecule, 2025 and 2035
  • Figure 63: Western Europe Market Y-o-Y Growth Comparison by Molecule, 2025–2035
  • Figure 64: Western Europe Market Attractiveness Analysis by Molecule
  • Figure 65: Eastern Europe Market Value Share and BPS Analysis by Country, 2025 and 2035
  • Figure 66: Eastern Europe Market Value Share and BPS Analysis by Drug Class, 2025 and 2035
  • Figure 67: Eastern Europe Market Y-o-Y Growth Comparison by Drug Class, 2025–2035
  • Figure 68: Eastern Europe Market Attractiveness Analysis by Drug Class
  • Figure 69: Eastern Europe Market Value Share and BPS Analysis by Therapeutic Area, 2025 and 2035
  • Figure 70: Eastern Europe Market Y-o-Y Growth Comparison by Therapeutic Area, 2025–2035
  • Figure 71: Eastern Europe Market Attractiveness Analysis by Therapeutic Area
  • Figure 72: Eastern Europe Market Value Share and BPS Analysis by Sales Channel, 2025 and 2035
  • Figure 73: Eastern Europe Market Y-o-Y Growth Comparison by Sales Channel, 2025–2035
  • Figure 74: Eastern Europe Market Attractiveness Analysis by Sales Channel
  • Figure 75: Eastern Europe Market Value Share and BPS Analysis by Molecule, 2025 and 2035
  • Figure 76: Eastern Europe Market Y-o-Y Growth Comparison by Molecule, 2025–2035
  • Figure 77: Eastern Europe Market Attractiveness Analysis by Molecule
  • Figure 78: East Asia Market Value Share and BPS Analysis by Country, 2025 and 2035
  • Figure 79: East Asia Market Value Share and BPS Analysis by Drug Class, 2025 and 2035
  • Figure 80: East Asia Market Y-o-Y Growth Comparison by Drug Class, 2025–2035
  • Figure 81: East Asia Market Attractiveness Analysis by Drug Class
  • Figure 82: East Asia Market Value Share and BPS Analysis by Therapeutic Area, 2025 and 2035
  • Figure 83: East Asia Market Y-o-Y Growth Comparison by Therapeutic Area, 2025–2035
  • Figure 84: East Asia Market Attractiveness Analysis by Therapeutic Area
  • Figure 85: East Asia Market Value Share and BPS Analysis by Sales Channel, 2025 and 2035
  • Figure 86: East Asia Market Y-o-Y Growth Comparison by Sales Channel, 2025–2035
  • Figure 87: East Asia Market Attractiveness Analysis by Sales Channel
  • Figure 88: East Asia Market Value Share and BPS Analysis by Molecule, 2025 and 2035
  • Figure 89: East Asia Market Y-o-Y Growth Comparison by Molecule, 2025–2035
  • Figure 90: East Asia Market Attractiveness Analysis by Molecule
  • Figure 91: South Asia & Pacific Market Value Share and BPS Analysis by Country, 2025 and 2035
  • Figure 92: South Asia & Pacific Market Value Share and BPS Analysis by Drug Class, 2025 and 2035
  • Figure 93: South Asia & Pacific Market Y-o-Y Growth Comparison by Drug Class, 2025–2035
  • Figure 94: South Asia & Pacific Market Attractiveness Analysis by Drug Class
  • Figure 95: South Asia & Pacific Market Value Share and BPS Analysis by Therapeutic Area, 2025 and 2035
  • Figure 96: South Asia & Pacific Market Y-o-Y Growth Comparison by Therapeutic Area, 2025–2035
  • Figure 97: South Asia & Pacific Market Attractiveness Analysis by Therapeutic Area
  • Figure 98: South Asia & Pacific Market Value Share and BPS Analysis by Sales Channel, 2025 and 2035
  • Figure 99: South Asia & Pacific Market Y-o-Y Growth Comparison by Sales Channel, 2025–2035
  • Figure 100: South Asia & Pacific Market Attractiveness Analysis by Sales Channel
  • Figure 101: South Asia & Pacific Market Value Share and BPS Analysis by Molecule, 2025 and 2035
  • Figure 102: South Asia & Pacific Market Y-o-Y Growth Comparison by Molecule, 2025–2035
  • Figure 103: South Asia & Pacific Market Attractiveness Analysis by Molecule
  • Figure 104: Middle East and Africa Market Value Share and BPS Analysis by Country, 2025 and 2035
  • Figure 105: Middle East and Africa Market Value Share and BPS Analysis by Drug Class, 2025 and 2035
  • Figure 106: Middle East and Africa Market Y-o-Y Growth Comparison by Drug Class, 2025–2035
  • Figure 107: Middle East and Africa Market Attractiveness Analysis by Drug Class
  • Figure 108: Middle East and Africa Market Value Share and BPS Analysis by Therapeutic Area, 2025 and 2035
  • Figure 109: Middle East and Africa Market Y-o-Y Growth Comparison by Therapeutic Area, 2025–2035
  • Figure 110: Middle East and Africa Market Attractiveness Analysis by Therapeutic Area
  • Figure 111: Middle East and Africa Market Value Share and BPS Analysis by Sales Channel, 2025 and 2035
  • Figure 112: Middle East and Africa Market Y-o-Y Growth Comparison by Sales Channel, 2025–2035
  • Figure 113: Middle East and Africa Market Attractiveness Analysis by Sales Channel
  • Figure 114: Middle East and Africa Market Value Share and BPS Analysis by Molecule, 2025 and 2035
  • Figure 115: Middle East and Africa Market Y-o-Y Growth Comparison by Molecule, 2025–2035
  • Figure 116: Middle East and Africa Market Attractiveness Analysis by Molecule
  • Figure 117: Global Market – Tier Structure Analysis
  • Figure 118: Global Market – Company Share Analysis


Frequently Asked Questions

What is the projected industry size of the small molecule inhibitors market by 2035?

The industry is projected to reach USD 514.1 billion by 2035.

What is the expected CAGR of the small molecule inhibitors market from 2025 to 2035?

The industry is expected to grow at a CAGR of 5.7% from 2025 to 2035.

Which segment is expected to lead the small molecule inhibitors market in 2025?

Immunomodulatory small molecules are expected to dominate with a 58% share in 2025.

What is the industry size of the small molecule inhibitors market in 2025?

The industry is estimated to reach USD 295.3 billion in 2025.

Which region is expected to witness the highest growth in the small molecule inhibitors

India is expected to be the key growth region with a projected CAGR of 7.7% from 2025 to 2035.

Explore Similar Insights

Future Market Insights

Small Molecule Inhibitors Market