Small Marine Engine Market Size and Share Forecast Outlook From 2025 to 2035
The small marine engine market is witnessing steady expansion, driven by the increasing popularity of recreational boating, fishing activities, and small-scale commercial marine operations. Technological advancements in compact propulsion systems, emphasizing fuel efficiency, reduced emissions, and enhanced durability, have supported market development.
The industry is characterized by a shift toward lightweight, low-maintenance engines that deliver high torque and reliability for varied marine applications. Additionally, rising disposable incomes and the expansion of coastal tourism have stimulated demand for leisure watercraft, particularly in North America, Europe, and Asia-Pacific.
Manufacturers are focusing on hybrid and electric innovations to align with environmental regulations while retaining high-performance standards. As maritime recreation and small-scale transportation gain momentum globally, the market outlook remains positive, supported by sustained consumer interest and infrastructure development in boating facilities..
Quick Stats for Small Marine Engine Market
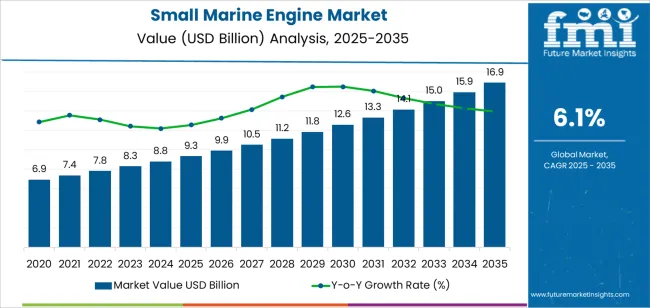
- Small Marine Engine Market Industry Value (2025): USD 9.3 billion
- Small Marine Engine Market Forecast Value (2035): USD 16.9 billion
- Small Marine Engine Market Forecast CAGR: 6.1%
- Leading Segment in Small Marine Engine Market in 2025: Outboard (55.5%)
- Key Growth Region in Small Marine Engine Market: North America, Asia-Pacific, Europe
- Top Key Players in Small Marine Engine Market: Yamaha Motor Co. Ltd., Greaves Cotton Limited, Honda Motor Co. Inc., Caterpillar, Suzuki Motor Corporation, Weichai Holding Group Co. Ltd., Brunswick Corporation, Deere & Company, Volvo Penta, Mercury Marine, Cummins Inc.
| Metric |
Value |
| Small Marine Engine Market Estimated Value in (2025 E) |
USD 9.3 billion |
| Small Marine Engine Market Forecast Value in (2035 F) |
USD 16.9 billion |
| Forecast CAGR (2025 to 2035) |
6.1% |
Segmental Analysis
The market is segmented by Type and Application and region. By Type, the market is divided into Outboard and Inboard. In terms of Application, the market is classified into Recreational Boats, Support Vessels, Coastal Vessels, and Fishing Vessels. Regionally, the market is classified into North America, Latin America, Western Europe, Eastern Europe, Balkan & Baltic Countries, Russia & Belarus, Central Asia, East Asia, South Asia & Pacific, and the Middle East & Africa.
Insights into the Outboard Segment
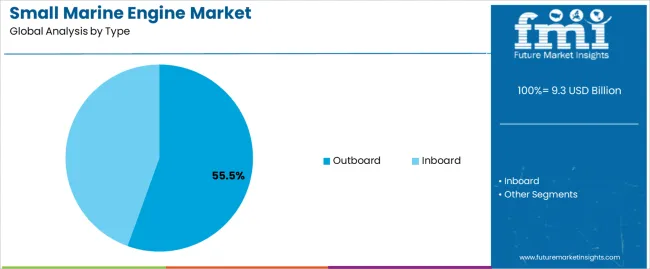
The outboard segment dominates the type category, accounting for approximately 55.50% share of the small marine engine market. Its leadership is attributed to easy installation, lower maintenance requirements, and superior maneuverability compared to inboard alternatives.
Outboard engines are widely favored for small boats, fishing vessels, and recreational crafts due to their compact design and convenient serviceability. The segment benefits from technological upgrades such as electronic fuel injection, digital throttle systems, and noise reduction mechanisms.
Lightweight materials and improved corrosion resistance further enhance operational efficiency in marine environments. With growing adoption among leisure and rental operators, alongside advancements in electric outboard models, the segment is expected to maintain its leading position over the forecast period..
Insights into the Recreational Boats Segment
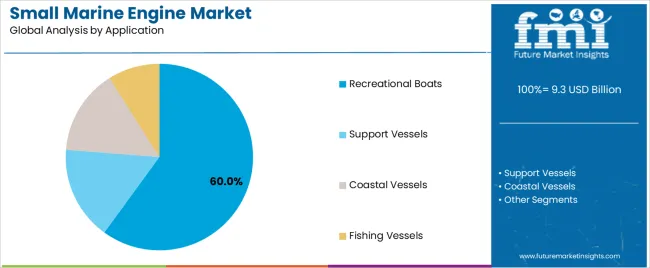
The recreational boats segment holds approximately 60.00% share of the application category, driven by the rising global interest in water-based leisure activities. The segment’s dominance stems from expanding coastal tourism, increased spending on boating and marine sports, and the development of marina infrastructure.
Recreational boating is gaining traction across developed economies, supported by favorable regulations and promotional initiatives for nautical tourism. Manufacturers are offering engines optimized for quieter operation and fuel efficiency to cater to consumer preferences.
Additionally, boat rental services and shared ownership models have made recreational boating more accessible, further supporting demand. With continuous growth in leisure marine participation, the recreational boats segment is projected to retain its substantial share in the market..
Factors Driving the Demand for Small Marine Engines
- The demand for small marine engines is rising due to the increasing popularity of recreational boating activities such as fishing, water sports, and leisure cruising. Small marine engines are widely used in various commercial applications, including small fishing vessels, ferries, water taxis, and other commercial boats, driven by the growth of maritime trade, tourism, and transportation.
- Continuous innovations in small marine engine technology, such as improved fuel efficiency, emission control, and noise reduction, attract consumers looking for more environmentally friendly and efficient propulsion systems.
- The rise in disposable incomes and improved living standards in emerging economies drives the demand for recreational boating activities, leading to a corresponding expansion of the small marine engine industry.
- Government initiatives promoting maritime tourism, supporting the fishing industry, and improving waterway transportation infrastructure are creating favorable conditions for the growth of the small marine engine market.
- The development of nautical tourism, including activities such as cruising, chartering, and island hopping, is fueling the demand for small marine engines, particularly in regions with scenic coastlines and water bodies like Japan and the Middle East.
- The need for engine replacements and upgrades in existing boats and vessels contributes to market growth as boat owners seek to modernize their propulsion systems with more efficient and reliable engines.
- Outboard engines, known for their ease of use, versatility, and ability to operate in shallow waters, are experiencing high demand as well.
Consumption Trends Shaping the Small Marine Engine Market
- More people are seeking leisure opportunities on water bodies, leading to a growing need for small marine engines to power various types of watercraft.
- Technological advancements and innovations in engine design and efficiency have significantly contributed to the adoption of small marine engines.
- Manufacturers are improving engine performance, fuel efficiency, and environmental sustainability, making small marine engines more appealing to consumers.
- The availability of lightweight and compact engine models has made small marine engines more versatile and reliable.
- The small marine engine market is experiencing robust growth as manufacturers expand their product offerings and distribution networks to cater to growing consumer demand.
- The availability of various engine options, including outboard, inboard, and sterndrive configurations, allows consumers to select engines that best suit their specific boating needs and preferences.
- The popularity of small marine engines is expected to continue growing in the coming years, driven by the increasing preference for water sports, fishing, and coastal tourism.
Factors Restraining the Growth of the Small Marine Engine Market
The small marine engine market is anticipated to surpass a valuation of USD 16.9 billion by 2035, with a forecasted 6.1% CAGR. While the market is experiencing growth, several restraining factors can adversely affect its development and expansion.
- Small marine engine manufacturers face challenges due to stringent environmental regulations aimed at reducing emissions and protecting marine ecosystems. Compliance with these regulations requires significant investments in research and development, leading to higher production costs and potential price increases for consumers.
- Fluctuations in disposable income levels and economic downturns affect the demand for small marine engines as individuals and businesses may postpone or scale back investments in new boats or engine upgrades.
- Technological advancements in alternative propulsion systems, such as electric and hybrid engines, present competition and challenges to traditional internal combustion engine manufacturers.
- Geopolitical tensions, trade disputes, and supply chain disruptions can impact the availability and cost of raw materials, components, and finished products in the small marine engine market.
- Changing consumer preferences and shifting demographics, particularly among younger generations, may influence the demand for recreational boating and small marine engines.
- Small marine engine manufacturers need to navigate regulatory compliance, economic uncertainties, technological advancements, supply chain disruptions, and changing consumer preferences to maintain competitiveness and sustain growth in the industry.
Small Marine Engine Industry Analysis by Top Investment Segments
Outboard Engines' Compactness and Lightweight Design offer Superior Power-to-weight Ratios
Based on their popularity, outboard engines dominate the small marine engine market with a 5.8% CAGR. This rising popularity is attributed to:
- Outboard engines are the most popular and versatile small marine engines today. They are widely used because they can be easily mounted and removed from the boat's transom. This feature makes them ideal for various watercraft, including small boats, fishing vessels, pontoon boats, and recreational cruisers.
- Outboard engines offer better performance and reliability than inboard engines, making them highly tempting.
- Outboard engines feature advanced technologies such as electronic fuel injection, variable valve timing, and power steering, contributing to their overall performance, fuel efficiency, and user experience. These features make them highly appealing to end users.
- The external mounting of outboard engines also allows for improved cooling and ventilation, enhancing engine efficiency and longevity as well as making them ideal.
| Attributes |
Details |
| Placement |
Outboard |
| Forecasted CAGR (2025 to 2035) |
5.8% |
Recreational Boating Surges in Popularity Worldwide, Capturing the Hearts of Leisure Seekers Everywhere
Based on their applications, recreational boats dominate the small marine engine market with a 5.5% CAGR. This rising popularity is attributed to:
- Small marine engines, particularly outboard engines, are preferred by recreational boat owners due to their versatility, adaptability, and excellent performance.
- Small marine engines offer easy installation, maneuverability, and reliable performance, making them ideal for various types of watercraft used as recreational boats.
- Advancements in engine technology, including fuel injection, variable valve timing, and electronic controls, enhance the overall performance, fuel efficiency, and reliability of small marine engines, making them the most sought-after choice for recreational boating applications in the market.
| Attributes |
Details |
| Application |
Recreational Boats |
| Forecasted CAGR (2025 to 2035) |
5.5% |
Analysis of Top Countries, Producing and Using Small Marine Engines
The section analyzes the small marine engine market by country, including the United States, the United Kingdom, China, Japan, and South Korea. The table presents the CAGR for each country, indicating the expected market growth in those countries through 2035.
| Countries |
Forecasted CAGR (2025 to 2035) |
| United States |
6.3% |
| United Kingdom |
6.8% |
| China |
7.0% |
| Japan |
7.3% |
| South Korea |
7.7% |
South Korea's Precision Engineering and Manufacturing Expertise Sparks Small Marine Engine Demand
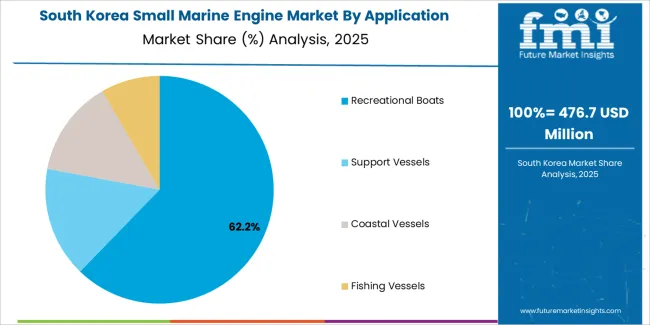
South Korea is the leading Asian country in the small marine engine market. The market in South Korea is anticipated to register a CAGR of 7.7% through 2035.
- South Korea-based manufacturers offer highly competitive engines in terms of their performance, reliability, and value for money.
- South Korea's robust shipbuilding industry and strong government support for maritime infrastructure development have created opportunities for small marine engine manufacturers to expand their presence in domestic and international markets.
- South Korea’s manufacturers continue to innovate and develop engines that offer exceptional performance and efficiency.
Extensive Coastline and Inland Waterways of the United States Surge Small Marine Engine Adoption
The United States dominates the small marine engine market in North America and is expected to exhibit a compound annual growth rate of 6.3% until 2035.
- With a large population of boating enthusiasts and a strong maritime industry, the country's demand for small marine engines continues to grow.
- The United States is also known for its advanced manufacturing capabilities and technological expertise, contributing to its significant global presence.
- Manufacturers from the United States continue to innovate and develop engines that offer exceptional performance, efficiency, and emissions control.
United Kingdom's Rich Maritime Heritage and Strong Recreational Boating Culture Fuels Market Expansion
The United Kingdom is the leading European country in the small marine engine market, and its market is predicted to display a CAGR of 6.8% through 2035.
- The United Kingdom's strategic geographic location and abundant waterways further contribute to its growth in the industry.
- The United Kingdom's emphasis on marine conservation and sustainability has also driven the adoption of eco-friendly propulsion technologies, positioning the country as a leader in this area.
- Manufacturers from this country offer engines that meet high standards of performance, reliability, and environmental sustainability.
China's Rapidly Growing Economy Escalates Recreational Boating Activity which Requires Small Marine Engine
China is a leading Asian country in the small marine engine market, with the market in China anticipated to register a CAGR of 7.0% through 2035.
- With its vast network of rivers, lakes, and coastal areas, China offers ample opportunities for recreational boating and water sports, driving the demand for small marine engines.
- The government's focus on promoting domestic manufacturing and technological innovation in China has also supported the growth of the country's small marine engine industry.
- Manufacturers based in China offer increasingly competitive engines in terms of performance, reliability, and affordability.
Japan's Advanced Engineering Capabilities and Reputation for Producing High-Quality Products Appeals Market Players
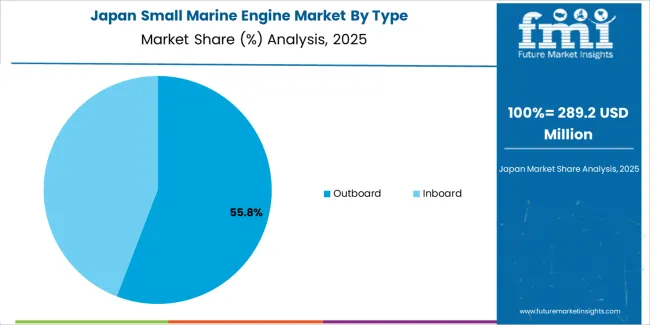
Japan is another Asian country leading in the small marine engine market, with the market in Japan anticipated to record a CAGR of 7.3% through 2035.
- Japan-based manufacturers offer engines that meet stringent emissions standards and deliver exceptional durability and efficiency, making them highly sought after in the global market.
- Japan's focus on marine conservation and eco-tourism has also driven the adoption of eco-friendly propulsion solutions, positioning Japanese companies as leaders.
Key Players and Market Concentration in the Small Marine Engine Industry
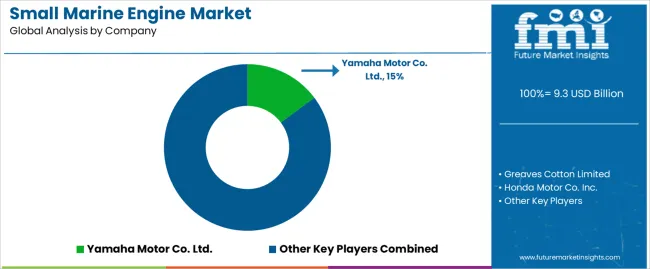
The small marine engine market is witnessing a growth spurt owing to the efforts of key players strategically investing in research and development.
Key companies are developing advanced technologies such as direct fuel injection, variable valve timing, and electronic controls to improve engine performance, efficiency, and environmental sustainability.
They are also expanding their product portfolios and distribution networks to tap into emerging markets and cater to evolving customer needs. To achieve this, they are introducing various engine models with varying power outputs, fuel options, and features to address different boat sizes, applications, and preferences.
Manufacturers are establishing strategic partnerships with boat manufacturers, dealers, and service providers to strengthen their presence in key regions and enhance customer support and aftermarket services.
By focusing on innovation, diversification, and collaboration, major players are driving the growth of the small marine engine market and positioning themselves for long-term success in the marine propulsion industry.
Recent Developments
- On January 30, 2025, Garden Reach Shipbuilders and Engineers Ltd (GRSE) and Rolls-Royce signed a Frame and Individual License Agreement to collaborate on the licensed production and localization of MTU IMO Tier II compliant Series 4000 Marine Engines for governmental ships in India.
- On August 30, 2025, Mercury Marine introduced its latest electric outboard motors, the Avator 20e and Avator 35e, offering increased size and power for small boats. This launch signifies Mercury's commitment to advancing electric propulsion technology in the marine industry.
- On January 18, 2025, vessel owners chose Caterpillar Marine as their partner for engine and hybrid retrofits to reduce emissions and fuel consumption. Caterpillar Marine's commitment to innovation and pilot programs demonstrates its dedication to environmental sustainability in the maritime industry.
- On March 27, 2025, Honda initiated preparations for marine engine production in India. Mohit Kumar Singh emphasized to Honda India Power Products' dealership network the expansion to marine sales, signaling the company's intent to venture into maritime markets.
- On October 4, 2025, manufacturers unveiled new low-emission workboat engines, including diesel and dual-fuel variants, surpassing IMO Tier III and EU Stage V standards. These advancements mark significant progress towards environmentally friendly propulsion solutions for the maritime industries.
Leading Suppliers in the Small Marine Engine Market
- Greaves Cotton Limited
- Yamaha Motor Co. Ltd.
- Honda Motor Co. Inc.
- Caterpillar
- Suzuki Motor Corporation
- Greaves Cotton Limited
- Weichai Holding Group Co. Ltd.
- Brunswick Corporation
- Deere & Company
- Volvo Penta
- Mercury Marine
- Cummins Inc.
Key Shifting Preferences Covered in the Small Marine Engine Market Report
- Demand Analysis of Small Marine Engine Hour Meter
- Opportunity Exploration of Small Engine Marine Transmission
- Global Market Study on BG Marine & Small Engines Inc. Yarker, Devon Small Engine & Marine Services, Devon
- Potential of Marine Diesel Engines in Asia Pacific, Europe, BENELUX, and North America
- In-depth Study on Key Features of Marine Engines
- Competition Analysis of Top Marine Engine Manufacturers
Top Segments Studied in the Small Marine Engine Market
By Placement:
By Application:
- Recreational Boats
- Support Vessels
- Coastal Vessels
- Fishing Vessels
By Region:
- Asia Pacific
- Europe
- North America
- Middle East & Africa
- Latin America
Frequently Asked Questions
How big is the small marine engine market in 2025?
The global small marine engine market is estimated to be valued at USD 9.3 billion in 2025.
What will be the size of small marine engine market in 2035?
The market size for the small marine engine market is projected to reach USD 16.9 billion by 2035.
How much will be the small marine engine market growth between 2025 and 2035?
The small marine engine market is expected to grow at a 6.1% CAGR between 2025 and 2035.
What are the key product types in the small marine engine market?
The key product types in small marine engine market are outboard and inboard.
Which application segment to contribute significant share in the small marine engine market in 2025?
In terms of application, recreational boats segment to command 60.0% share in the small marine engine market in 2025.


