The Small Bowel Enteroscopes Market is estimated to be valued at USD 635.1 million in 2025 and is projected to reach USD 1409.7 million by 2035, registering a compound annual growth rate (CAGR) of 8.3% over the forecast period.
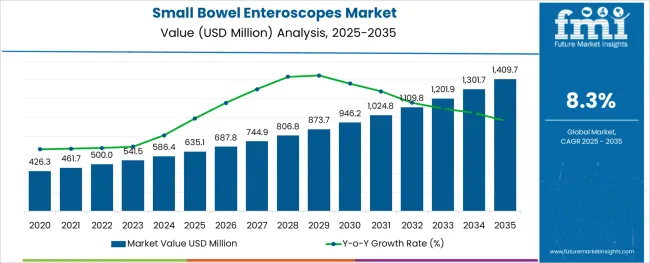
The small bowel enteroscopes market is showing steady expansion driven by the rising incidence of gastrointestinal disorders and the demand for minimally invasive diagnostic solutions. Healthcare professionals have recognized the need for advanced enteroscopy techniques to improve visualization and access within the small intestine. Innovations in device design and imaging clarity have enabled better diagnostic accuracy and procedural safety.
Clinical discussions and healthcare forums have highlighted the growing awareness among patients and physicians regarding the early diagnosis of obscure gastrointestinal conditions. Hospitals and specialty clinics are expanding their endoscopy units to manage the increasing caseload of small bowel investigations.
Looking ahead the market is expected to benefit from the integration of AI-assisted image analysis and the continued shift toward single-use devices that enhance infection control. Segmental growth is expected to be led by Obscure gastrointestinal bleeding in indication and Hospitals as the leading end user due to their large patient volumes and access to advanced diagnostic infrastructure.
The market is segmented by Indication and End User and region. By Indication, the market is divided into Obscure gastrointestinal bleeding, Small bowel tumors, Polyposis syndromes, and Dilation of small bowel stenosis. In terms of End User, the market is classified into Hospitals, Clinics, Diagnostics Laboratories, and Others. Regionally, the market is classified into North America, Latin America, Western Europe, Eastern Europe, Balkan & Baltic Countries, Russia & Belarus, Central Asia, East Asia, South Asia & Pacific, and the Middle East & Africa.
The market is segmented by Indication and End User and region. By Indication, the market is divided into Obscure gastrointestinal bleeding, Small bowel tumors, Polyposis syndromes, and Dilation of small bowel stenosis. In terms of End User, the market is classified into Hospitals, Clinics, Diagnostics Laboratories, and Others. Regionally, the market is classified into North America, Latin America, Western Europe, Eastern Europe, Balkan & Baltic Countries, Russia & Belarus, Central Asia, East Asia, South Asia & Pacific, and the Middle East & Africa.
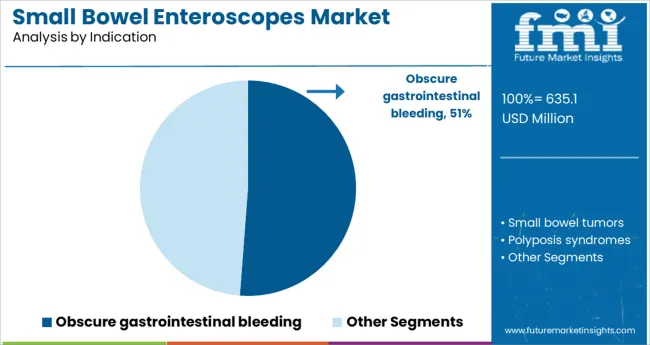
The Obscure gastrointestinal bleeding segment is projected to account for 51.2% of the small bowel enteroscopes market revenue in 2025 maintaining its lead in the indication category. This segment’s growth is influenced by the complexity of diagnosing bleeding sources that cannot be identified through routine endoscopy. Physicians have increasingly relied on small bowel enteroscopy to visualize hidden lesions ulcers and vascular abnormalities responsible for chronic blood loss.
The growing number of patients presenting with unexplained anemia and intermittent bleeding has further driven the demand for these specialized procedures. Early and accurate detection of bleeding sites plays a critical role in guiding treatment decisions and reducing the need for repeat diagnostic workups.
As awareness of obscure gastrointestinal bleeding rises among healthcare providers the use of small bowel enteroscopes is expected to remain strong in this clinical application.
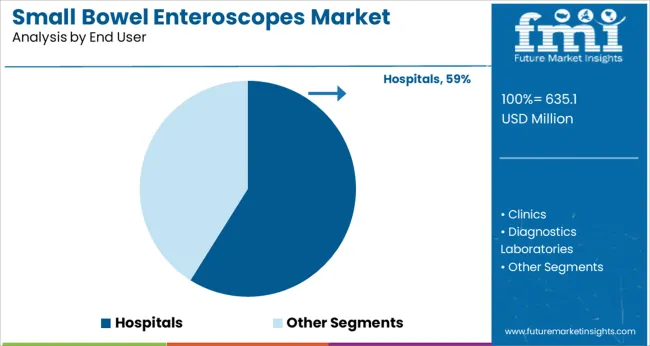
The Hospitals segment is projected to contribute 58.9% of the small bowel enteroscopes market revenue in 2025 continuing its dominance in end user adoption. This segment has gained momentum as hospitals remain the primary settings for complex gastrointestinal diagnostics and interventions. Hospitals have invested in specialized endoscopy suites and skilled gastroenterology teams capable of performing advanced enteroscopy procedures.
Additionally hospitals offer the comprehensive patient care needed for managing complicated cases where obscure bleeding may be linked to other underlying conditions. The availability of post-procedure monitoring and multidisciplinary support has further strengthened the hospital segment’s role in the market.
With the ongoing expansion of tertiary care centers and the rising focus on improving diagnostic pathways hospitals are expected to maintain their leadership in the adoption of small bowel enteroscopes.
Rising demand for accurate and improved diagnosis and treatment for gastrointestinal disorders along with advancing technologies will bolster the growth in the small bowel enteroscope market. Further, small bowel enteroscopes are accepted for a wide range of indications including obscure gastrointestinal bleeding, small bowel tumors, polyposis syndromes, and others.
Certain indications currently under investigation are Crohn’s disease, refractory celiac disease, and small bowel obstruction. The rising prevalence of these diseases will aid the growth of the small bowel enteroscope market.
Surging cases of gastrointestinal disorders and gastrointestinal bleeding in patients will also boost the adoption of small bowel enteroscopes in hospitals, clinics, and diagnostics laboratories. This will further contribute to the growth of the global small bowel enteroscope market.
The high cost of enteroscope in emerging economies is one of the key factors limiting the growth of the small bowel enteroscope market
The small bowel enteroscopes require skilled professionals trained in the medicine and study of enteroscope to perform the examination. Hence, the dearth of trained professionals might impede growth.
Besides this, small bowel enteroscopes require a prolonged time to perform the examination which makes medical professionals reluctant to opt for enteroscope. Hence, the availability of alternative options to enteroscope might hinder sales.
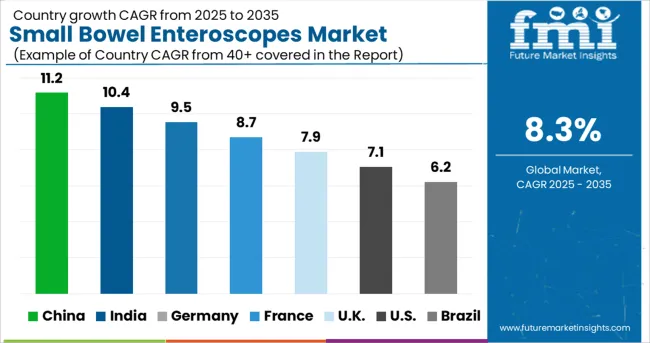
Technological advancements, a rise in demand for more sophisticated diagnoses of gastrointestinal disorders, and an upsurge in applications of small bowel enteroscopes are anticipated to fuel the growth of the small bowel enteroscope market in the Asia Pacific.
The small bowel enteroscope market is expected to grow at a significant growth rate in Asia Pacific. This is owing to the increasing number of bowel disorders in densely populated countries such as India and China.
Swiftly changing healthcare systems and policies, certain government initiatives to improve healthcare and higher per capita healthcare expenditure are likely to propel small bowel enteroscope market growth in Asia Pacific.
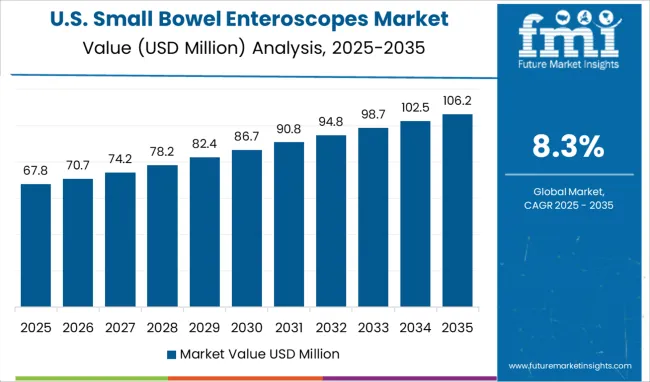
The high prevalence of gastrointestinal disorders especially inflammatory bowel syndrome will drive the market for small bowel enteroscope. According to the Centers for Disease Control (CDC) and Prevention, an estimated 426.3 million USA adults were reported to be diagnosed with inflammatory bowel syndrome in 2020.
This, growing awareness about gastrointestinal disorders, access to advanced healthcare facilities, and increasing investments in the healthcare sector will boost the small bowel enteroscope market in North America.
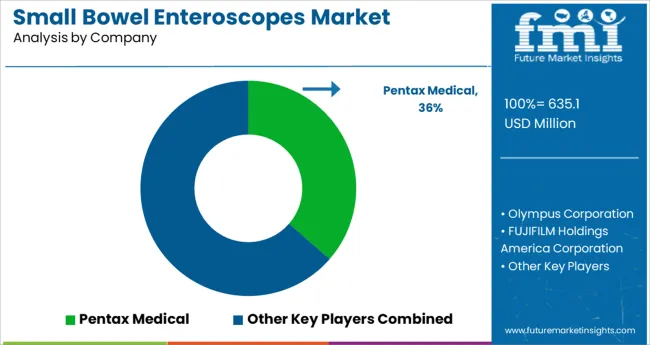
Leading players present in the global small bowel enteroscope market include Pentax Medical, Olympus Corporation, and FUJIFILM Holdings America Corporation among others.
The market is fairly competitive with key companies in the market engaged in developing their portfolio of new enteroscope products and adopting a commercialization strategy. Leading manufacturers are currently carrying out multiple clinical trials related to other indications of small bowel enteroscope to expand their product portfolio and strengthen their position in the market.
| Report Attribute | Details |
|---|---|
| Growth Rate | CAGR of 8 to 9% from 2025 to 2035 |
| Base Year for Estimation | 2024 |
| Historical Data | 2020 to 2024 |
| Forecast Period | 2025 to 2035 |
| Quantitative Units | Revenue in million, and CAGR from 2025 to 2035 |
| Report Coverage | Revenue Forecast, Volume Forecast, Company Ranking, Competitive Landscape, Growth Factors, Trends, and Pricing Analysis |
| Segments Covered | Indication, End User, Region |
| Countries Covered | North America (USA, Canada); Latin America (Mexico, Brazil); Western Europe (Germany, Italy, France, United Kingdom, Spain, Nordic countries, Belgium, Netherlands, Luxembourg); Eastern Europe (Poland, Russia); Asia-Pacific Excluding Japan (China, India, ASEAN, Australia & New Zealand); Japan; The Middle East and Africa (GCC, S. Africa, N. Africa) |
| Key Companies Profiled | Pentax Medical; Olympus Corporation; FUJIFILM Holdings America Corporation |
| Customization | Available Upon Request |
The global small bowel enteroscopes market is estimated to be valued at USD 635.1 million in 2025.
It is projected to reach USD 1,409.7 million by 2035.
The market is expected to grow at a 8.3% CAGR between 2025 and 2035.
The key product types are obscure gastrointestinal bleeding, small bowel tumors, polyposis syndromes and dilation of small bowel stenosis.
hospitals segment is expected to dominate with a 58.9% industry share in 2025.


Our Research Products

The "Full Research Suite" delivers actionable market intel, deep dives on markets or technologies, so clients act faster, cut risk, and unlock growth.

The Leaderboard benchmarks and ranks top vendors, classifying them as Established Leaders, Leading Challengers, or Disruptors & Challengers.

Locates where complements amplify value and substitutes erode it, forecasting net impact by horizon

We deliver granular, decision-grade intel: market sizing, 5-year forecasts, pricing, adoption, usage, revenue, and operational KPIs—plus competitor tracking, regulation, and value chains—across 60 countries broadly.

Spot the shifts before they hit your P&L. We track inflection points, adoption curves, pricing moves, and ecosystem plays to show where demand is heading, why it is changing, and what to do next across high-growth markets and disruptive tech

Real-time reads of user behavior. We track shifting priorities, perceptions of today’s and next-gen services, and provider experience, then pace how fast tech moves from trial to adoption, blending buyer, consumer, and channel inputs with social signals (#WhySwitch, #UX).

Partner with our analyst team to build a custom report designed around your business priorities. From analysing market trends to assessing competitors or crafting bespoke datasets, we tailor insights to your needs.
Supplier Intelligence
Discovery & Profiling
Capacity & Footprint
Performance & Risk
Compliance & Governance
Commercial Readiness
Who Supplies Whom
Scorecards & Shortlists
Playbooks & Docs
Category Intelligence
Definition & Scope
Demand & Use Cases
Cost Drivers
Market Structure
Supply Chain Map
Trade & Policy
Operating Norms
Deliverables
Buyer Intelligence
Account Basics
Spend & Scope
Procurement Model
Vendor Requirements
Terms & Policies
Entry Strategy
Pain Points & Triggers
Outputs
Pricing Analysis
Benchmarks
Trends
Should-Cost
Indexation
Landed Cost
Commercial Terms
Deliverables
Brand Analysis
Positioning & Value Prop
Share & Presence
Customer Evidence
Go-to-Market
Digital & Reputation
Compliance & Trust
KPIs & Gaps
Outputs
Full Research Suite comprises of:
Market outlook & trends analysis
Interviews & case studies
Strategic recommendations
Vendor profiles & capabilities analysis
5-year forecasts
8 regions and 60+ country-level data splits
Market segment data splits
12 months of continuous data updates
DELIVERED AS:
PDF EXCEL ONLINE
Small Molecule Brominated Flame Retardants Market Size and Share Forecast Outlook 2025 to 2035
Small Form Factor (SFF) Connectors Market Size and Share Forecast Outlook 2025 to 2035
Small Satellite Market Size and Share Forecast Outlook 2025 to 2035
Small Marine Engine Market Forecast Outlook 2025 to 2035
Small Gas Engine Market Size and Share Forecast Outlook 2025 to 2035
Small Molecule CDMO Market Size and Share Forecast Outlook 2025 to 2035
Small Molecule CMO/CDMO Market Size and Share Forecast Outlook 2025 to 2035
Small Animal Metabolic Monitoring System Market Size and Share Forecast Outlook 2025 to 2035
Small Animal Running Wheel System Market Size and Share Forecast Outlook 2025 to 2035
Small Molecule-Drug Conjugates Market Size and Share Forecast Outlook 2025 to 2035
Small Caliber Ammunition Market Size and Share Forecast Outlook 2025 to 2035
Small Boats Market Size and Share Forecast Outlook 2025 to 2035
Small Capacity Electrolyzer Market Size and Share Forecast Outlook 2025 to 2035
Small Animal Imaging (In Vivo) Market Size and Share Forecast Outlook 2025 to 2035
Small Cell Lung Cancer (SCLC) Treatment Market Size and Share Forecast Outlook 2025 to 2035
Small Molecule Innovator CDMO Market Size and Share Forecast Outlook 2025 to 2035
Small Cell Network Market Size and Share Forecast Outlook 2025 to 2035
Small Wind Turbine Market Size and Share Forecast Outlook 2025 to 2035
Small Off-Road Engines Market Size and Share Forecast Outlook 2025 to 2035
Small Continuous Fryer Market Size and Share Forecast Outlook 2025 to 2035

Thank you!
You will receive an email from our Business Development Manager. Please be sure to check your SPAM/JUNK folder too.
Chat With
MaRIA