The Small Molecule CMO/CDMO Market is estimated to be valued at USD 75760.0 million in 2025 and is projected to reach USD 125775.8 million by 2035, registering a compound annual growth rate (CAGR) of 5.1% over the forecast period.
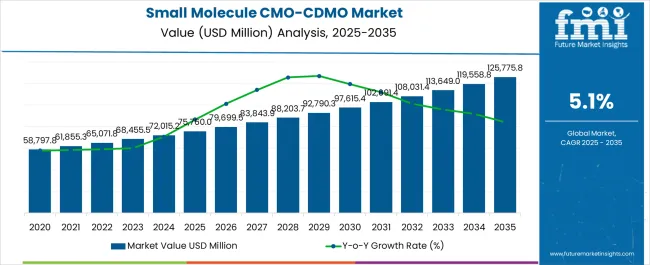
| Metric | Value |
|---|---|
| Small Molecule CMO/CDMO Market Estimated Value in (2025 E) | USD 75760.0 million |
| Small Molecule CMO/CDMO Market Forecast Value in (2035 F) | USD 125775.8 million |
| Forecast CAGR (2025 to 2035) | 5.1% |
The small molecule CMO/CDMO market is expanding significantly, driven by the growing outsourcing of pharmaceutical manufacturing and development services. Rising complexity in drug formulations, cost pressures on pharmaceutical companies, and increasing demand for scalable production capacity have boosted reliance on contract service providers.
The market benefits from robust demand for generics and specialty drugs, as well as the need for flexible partnerships in drug lifecycle management. Regulatory compliance, quality assurance, and global supply chain integration are shaping competitive differentiation among providers.
Current dynamics highlight a strong focus on early-stage development services and process optimization, with companies seeking to reduce time-to-market for critical therapies. With ongoing patent expirations and growing investments in novel drug pipelines, the small molecule CMO/CDMO market is projected to sustain long-term growth across diverse therapeutic areas.
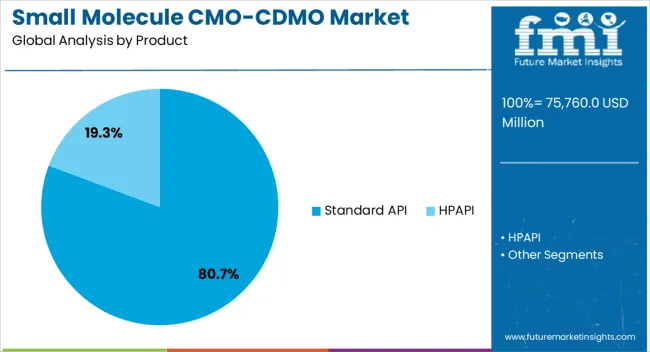
The standard API segment dominates the product category, representing approximately 80.70% share of the small molecule CMO/CDMO market. This leadership reflects strong demand for active pharmaceutical ingredients used in generics and established therapies.
The segment benefits from high-volume production requirements and well-developed regulatory frameworks that guide manufacturing standards. Outsourcing standard API production to CMO/CDMOs allows pharmaceutical companies to optimize resources, reduce costs, and focus on innovation.
Reliable supply chains and economies of scale further support the segment’s dominance. With steady global demand for cost-effective drugs, the standard API segment is expected to maintain its leading share over the forecast period.
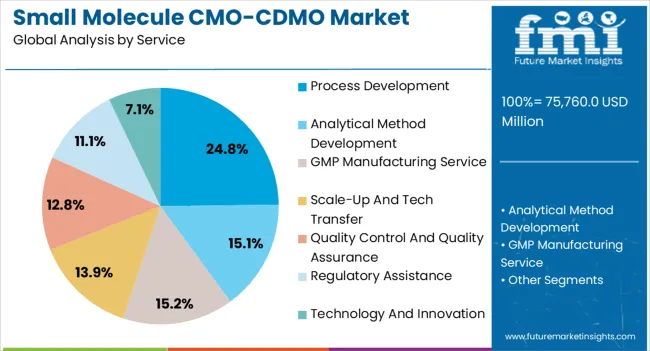
The process development segment accounts for approximately 24.80% share of the service category, underscoring its importance in ensuring scalability and compliance in drug manufacturing. CMO/CDMOs provide specialized expertise in optimizing synthetic routes, improving yields, and enhancing production efficiency.
This service is increasingly sought after during early-stage and clinical development phases, where speed and reliability are critical to regulatory approval timelines. The segment’s growth is reinforced by the rising complexity of chemical synthesis and the need for environmentally sustainable processes.
As pharmaceutical companies seek agile and cost-efficient development strategies, demand for process development services is expected to remain strong, sustaining its share in the market.
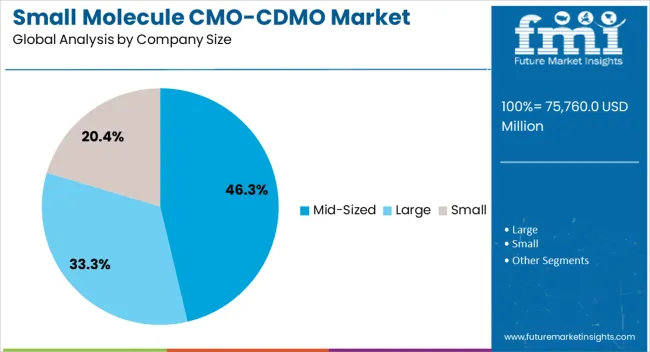
The mid-sized segment leads the company size category with approximately 46.30% share, reflecting its competitive positioning in balancing flexibility with scale. Mid-sized CMO/CDMOs are often preferred by pharmaceutical companies for their ability to provide customized services, faster response times, and cost-effective solutions compared to larger providers.
These companies are well-positioned to handle complex small molecule projects while maintaining operational agility. Their prominence is further supported by strategic partnerships, regional specialization, and investment in advanced manufacturing technologies.
With rising outsourcing demand and the growing importance of tailored solutions, mid-sized providers are expected to retain their leadership in the small molecule CMO/CDMO market.
Companies in the biotechnology and biopharmaceutical industries hire CDMO for development and production services. This allows them to significantly reduce overall costs, save time, and streamline several processes.
A wide range of services, such as development, packaging, clinical supply, analytical testing, biomanufacturing, and fill finishing, are provided by biotechnology CDMOs/CMOs. Pharmaceutical, biopharma, and biotechnology companies would collaborate with CDMOs to outsource drug research and manufacturing.
Production of biopharmaceuticals is determined by manufacturing scale. The final user can choose to use the entire biologics production process for either commercial or clinical uses. The study solely looks at clinical and commercial applications and measures the manufacturing capacity and income generated by biopharmaceutical contract manufacturing.
The global small molecule CMO/CDMO market recorded a CAGR of 3.8% from 2020 to 2025. As per the global small molecule CMO/CDMO industry analysis, the target market is projected to expand at a 5.2% CAGR.
| Historical CAGR (2020 to 2025) | 3.8% |
|---|---|
| Forecast CAGR (2025 to 2035) | 5.2% |
CMOs and CDMOs with a wide range of services, including drug substance manufacturing, drug product formulation, analytical services, and regulatory support, can offer a one-stop shop for pharmaceutical companies. This simplifies the outsourcing process, as pharmaceutical clients can find all the necessary expertise under one roof, reducing the complexity of managing multiple vendors.
The ability to seamlessly integrate different aspects of drug development and manufacturing is a key advantage. CMOs and CDMOs with diverse portfolios can offer integrated solutions that streamline processes, reduce communication gaps, and enhance project efficiency.
Pharmaceutical companies have varying needs at different stages of drug development. CMOs and CDMOs with a diverse service portfolio can adapt to these changing needs, allowing clients to engage with the same partner throughout the drug development lifecycle.
Engaging multiple vendors for different aspects of drug development and manufacturing can increase complexity. CMOs and CDMOs with a comprehensive portfolio simplify this process, offering pharmaceutical companies a single point of contact for a wide array of services.
Complex drug development requires specialized knowledge in areas such as formulation, process optimization, analytical techniques, and regulatory compliance. CMOs and CDMOs with expertise in handling complex molecules and formulations have become sought-after partners for pharmaceutical companies looking to outsource these aspects.
Complex drug development often involves advanced manufacturing technologies and techniques. CMOs and CDMOs that invest in and adopt these technologies, such as continuous manufacturing or advanced analytical methods, can offer unique solutions to address the challenges posed by complex drug candidates.
The complexities of small molecule drugs can lead to challenges in optimizing manufacturing processes. CMOs and CDMOs that specialize in process development and optimization can help pharmaceutical companies streamline production, reduce costs, and improve efficiency.
Complex drug candidates often require tailored solutions to overcome formulation and manufacturing challenges. CMOs and CDMOs that offer customized approaches can provide solutions that meet the specific needs of each drug, enhancing the chances of successful development.
The growing adoption of drug development and manufacturing services by pharmaceutical companies is expected to boost the global small molecule CMO/CDMO market during the forecast period. Similarly, a rising focus on reducing the overall cost of small-molecule drugs is expected to drive demand through 2035.
Concerns about IP protection can lead pharmaceutical companies to limit the information they share with CMOs and CDMOs. This restricted information flow can hinder effective collaboration, as both parties need to work closely and share knowledge for successful drug development and manufacturing.
The fear of IP exposure can discourage CMOs and CDMOs from fully engaging in innovative problem-solving and process optimization. This can hinder the development of more efficient and advanced manufacturing processes, limiting the potential benefits of outsourcing.
Intellectual property concerns can lead to a lack of trust between pharmaceutical companies and CMOs/CDMOs. This lack of trust can hinder open communication, effective project management, and the establishment of long-term partnerships.
Crafting agreements that address IP protection can be complex and time-consuming. Negotiating and finalizing such agreements can delay project initiation and increase administrative burden, potentially affecting project timelines and costs.
If IP concerns are not adequately addressed, pharmaceutical companies can be hesitant to collaborate with CMOs and CDMOs, particularly if the potential benefits of outsourcing are outweighed by the risks associated with IP exposure. These factors can limit market expansion through 2035.
This section brings to the fore key highlights of the small molecule CMO/CDMO industry across prominent countries. Out of all the countries profiled, the United States, China, and Japan are expected to witness lucrative CAGRs of 4.8%, 6.5%, and 5.2%, respectively, through 2035.
Market Growth Outlook by Key Countries
| Countries | Value CAGR |
|---|---|
| United States | 4.8% |
| Germany | 3.9% |
| United Kingdom | 3.5% |
| Japan | 5.2% |
| China | 6.5% |
The United States is expected to retain its dominance in the North America small molecule CMO/CDMO industry during the forecast period. This is due to the robust expansion of the pharmaceutical sector, the strong presence of leading CMO/CDMOs, and the favorable regulatory environment.
As per the latest analysis, the United States small molecule CMO/CDMO market size is projected to reach USD 23,495.7 million by 2035. Over the assessment period, demand in the United States is set to rise at a 4.8% CAGR.
Global operations of CMOs and CDMOs with United States-based operations are being expanded in response to the increasing demand for pharmaceutical manufacturing services across multiple geographies. The pharmaceutical sector has strict regulations, so CMOs and CDMOs who can guarantee compliance with standards are highly sought after.
Advances in manufacturing technologies, such as process analytical technology (PAT) and continuous manufacturing, which are improving operational efficiency, are affecting the CMO/CDMO environment in the United States. Several United States-based pharmaceutical giants are looking to outsource their operations, which will boost the target market.
China’s small molecule CMO/CDMO market is poised to exhibit a CAGR of 6.5% during the assessment period. It will likely attain a valuation of USD 37,932.6 million by 2035. This is attributable to the rising demand for pharmaceuticals in China.
The pharmaceutical industry in China is expanding significantly due to several factors. These include an aging population, growing health awareness, and rising income levels. Opportunities for small molecule CMOs and CDMOs to meet the rising demand for pharmaceuticals will be created by this growth.
China has implemented regulatory reforms to optimize procedures and harmonize with global norms. Due to this, the regulatory landscape has improved, and it is now more favorable for international businesses to interact with China-based CMOs and CDMOs.
International pharmaceutical corporations are forging strategic alliances with a growing number of China-based CMOs and CDMOs. Through these partnerships, China-based businesses can access international markets and expertise, and foreign businesses can take advantage of affordable manufacturing solutions.
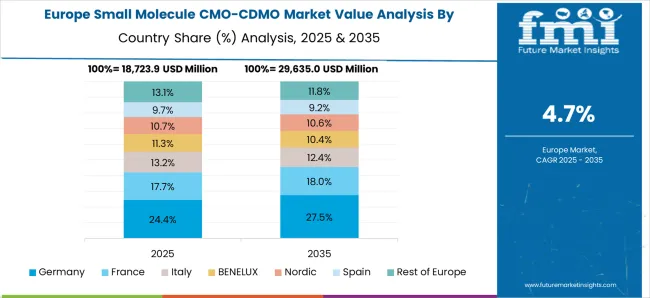
Germany is renowned for upholding strict quality standards and for its advanced industrial skills. Pharmaceutical businesses seeking dependable and effective small molecule CMOs and CDMOs are drawn to this.
With a well-established network of universities and research organizations, Germany places a high priority on research and development. Germany's CMOs and CDMOs gain from having access to state-of-the-art research and a highly qualified workforce.
Germany has strict regulations, and businesses that operate there must abide by rigorous standards of quality and safety. This regulatory compliance is a big draw for businesses looking for trustworthy manufacturing partners.
As per the latest report, Germany’s small molecule CMO/CDMO market value is predicted to reach USD 5,308.6 million by 2035. It will likely exhibit a CAGR of 3.9% during the assessment period.
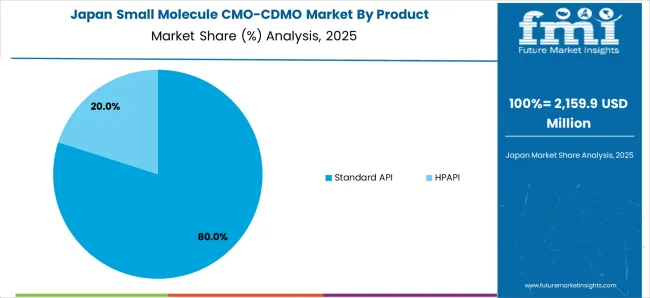
Japan’s small molecule CMO/CDMO market is projected to expand at a 5.2% CAGR during the assessment period. It is expected to total a valuation of USD 22,989.8 million by the end of 2035.
Several factors are expected to drive demand in Japan during the assessment period. These include the rising focus of Japan-based pharmaceutical companies on reducing drug development costs and expansion of the generic drug sector.
Leading pharmaceutical companies across Japan are adopting drug development and manufacturing services to reduce drug development and manufacturing costs. This will continue to boost the target market through 2035.
The United Kingdom’s small molecule CMO/CDMO market is expected to thrive at a 3.5% CAGR during the assessment period. This is attributable to rising outsourcing trends, growing demand for biologics and personalized medicines, and increasing government support.
The United Kingdom’s government is supportive of the CMO/CDMO industry as it has introduced several policies to support its growth. This is anticipated to improve the share of the United Kingdom's small molecule CMO/CDMO market share.
The section below shows the standard API segment dominating the small molecule CMO/CDMO market. It is predicted to expand at 4.5% CAGR during the assessment period. Based on services, the process development category is expected to generate significant revenue in the market, exhibiting a CAGR of 4.1% through 2035.
By company size, the mid-sized segment is expected to lead the market, thriving at a 4.8% CAGR between 2025 and 2035. Based on the scale of operation, the commercial segment is predicted to rise at a CAGR of 5.6% during the forecast period.
Market Growth Outlook by Key Product
| Product | Value CAGR |
|---|---|
| Standard API | 4.5% |
| HPAPI | 7.5% |
As per the latest analysis, the standard API segment is expected to dominate the market for small molecule CMO/CDMOs during the forecast period. It is poised to exhibit a CAGR of 4.5%, totaling USD 89,420.2 million by 2035.
Standard APIs are frequently found in a wide variety of pharmaceutical goods. These typical, well-researched active compounds are present in multiple drugs and have a broad range of therapeutic applications.
As standard APIs are used in different pharmaceutical formulations, it is frequently necessary to demand them in large amounts. Owing to their high demand, they are a top choice for CMOs and CDMOs looking to take advantage of economies of scale.
Economies of scale can lead to more cost-effective manufacturing of conventional APIs. Pharmaceutical businesses can benefit from cost-competitive pricing and process optimization provided by CMOs and CDMOs that specialize in producing standard APIs.
Market Growth Outlook by Services
| Service | Value CAGR |
|---|---|
| Process Development | 4.1% |
| Analytical Method Development | 4.5% |
| GMP Manufacturing Service | 4.9% |
| Scale-Up and Tech Transfer | 7.4% |
| Quality Control and Quality Assurance | 5.6% |
| Regulatory Assistance | 6.4% |
| Technology and Innovation | 7.9% |
Based on services, the process development segment is projected to hold a dominant revenue share of 24.8% by 2035. The target segment will likely thrive at a 4.1% CAGR during the assessment period, reaching USD 29,381.4 million by the end of 2035.
Customizing and streamlining manufacturing procedures for particular small molecule compounds is the focus of process development services. This customized method guarantees economical and successful manufacture while satisfying the particular needs of every client's molecule.
Process development-focused CMOs and CDMOs usually possess both chemical and engineering knowledge. Their interdisciplinary understanding enables them to create manufacturing techniques for complex tiny compounds that are both scalable and sturdy.
Early on in the drug development process, CMOs and CDMOs that provide process development services are frequently involved. They help a drug candidate successfully go from the lab to commercial production by offering support starting in the discovery phase. Process development services assist in identifying and reducing risks and obstacles that can arise during the production of a certain small molecule.
Market Growth Outlook by Key Company Size
| Company Size | Value CAGR |
|---|---|
| Large | 5.3% |
| Mid-sized | 4.8% |
| Small | 6.0% |
The mid-sized segment is predicted to lead the global small molecule CMO/CDMO industry during the assessment period. It is set to progress at a 4.8% CAGR, totaling a valuation of USD 55,615.8 million by 2035.
Compared to larger firms, mid-sized businesses are frequently more nimble and adaptable. Their flexibility enables them to promptly address shifts in customer requirements, adjust to new technological advancements, and personalize services to the unique requirements of pharmaceutical customers.
Several mid-sized CMOs and CDMOs focus on certain therapeutic areas or classes of small compounds. They can become authorities in particular fields thanks to their specialist emphasis, which draws in customers seeking particular skills and knowledge. When compared to giant international firms, mid-sized businesses frequently have reduced overhead and operational costs.
Pharmaceutical firms that are looking for high-quality services at a competitive price find mid-sized companies appealing due to their cost competitiveness. Pharmaceutical clients are frequently more receptive to collaborative relationships with mid-sized CMOs and CDMOs.
Mid-sized businesses can provide a more individualized and customer-focused service compared to larger organizations. The clients frequently appreciate mid-sized CMOs and CDMOs for their attentiveness and promptness.
Market Growth Outlook by Scale of Operation
| Scale of Operation | Value CAGR |
|---|---|
| Clinical | 3.8% |
| Commercial | 5.6% |
Based on the scale of operation, the commercial segment is anticipated to generate significant revenue in the global small molecule CMO/CDMO market during the assessment period. It is set to expand at a high CAGR of 5.6%, totaling USD 90,027.3 million in 2035.
Several pharmaceutical companies are turning to CMOs and CDMOs to handle their manufacturing operations. This is because they look to cut expenses, concentrate on their core skills, and shorten the time it takes to create new drugs. The commercial segment's expansion has probably been aided by this tendency of outsourcing.
Since several branded drugs' patents are about to expire, there has been an increasing demand for generic medications worldwide. Commercial manufacturing operations have surged because of generic medicine makers' frequent partnerships with CMOs and CDMOs to make use of their knowledge and ability for cost-effective production.
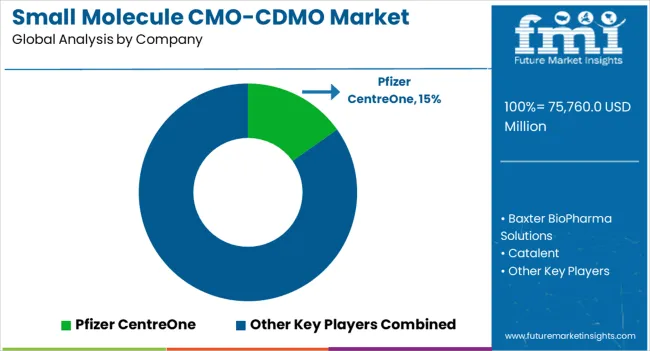
Leading small molecule CMO/CDMO companies prioritize acquisitions and expansion as they work to create new product lines and expand their customer base. Top players are also looking to offer new services by integrating novel technologies in drug manufacturing, development, and packaging.
Recent Developments in the Small Molecule CMO/CDMO Market
| Attribute | Details |
|---|---|
| Estimated Market Size (2025) | USD 75760.0 million |
| Projected Market Value (2035) | USD 125775.8 million |
| Anticipated Growth Rate (2025 to 2035) | 5.1% CAGR |
| Forecast Period | 2025 to 2035 |
| Historical Data Available for | 2020 to 2025 |
| Market Analysis | USD million for Value |
| Key Regions Covered | North America; East Asia; Western Europe; Eastern Europe |
| Key Countries Covered | United States, Canada, China, Japan, South Korea, Germany, France, Spain, Italy, BENELUX, Nordic Countries, United Kingdom, Poland, Hungary, Romania, Czech Republic. |
| Key Market Segments Covered | Product, Service, Company Size, Scale of Operation, and Region |
| Key Companies Profiled | Pfizer CentreOne; Baxter BioPharma Solutions; Catalent; Lonza; Syngene International; Boehringer Ingelheim; Piramal Pharma Solutions; Wuxi AppTec; Patheon (Thermo Fisher Scientific Inc.); Adare Pharma Solutions; Ajinomoto Bio-Pharma Services; Ascendia Pharma; Asymchem; August Bioservices; Cambrex; Nanoform; PCI Pharma Services; Quotient Sciences; Societal™ CDMO; Siegfried Holding AG; Corden Pharma International |
| Report Coverage | Market Forecast, Competition Intelligence, Market Dynamics and Challenges, Strategic Growth Initiatives |
The global small molecule CMO/CDMO market is estimated to be valued at USD 75,760.0 million in 2025.
The market size for the small molecule CMO/CDMO market is projected to reach USD 125,775.8 million by 2035.
The small molecule CMO/CDMO market is expected to grow at a 5.1% CAGR between 2025 and 2035.
The key product types in small molecule CMO/CDMO market are standard API and hpapi.
In terms of service, process development segment to command 24.8% share in the small molecule CMO/CDMO market in 2025.


Full Research Suite comprises of:
Market outlook & trends analysis
Interviews & case studies
Strategic recommendations
Vendor profiles & capabilities analysis
5-year forecasts
8 regions and 60+ country-level data splits
Market segment data splits
12 months of continuous data updates
DELIVERED AS:
PDF EXCEL ONLINE
Small Marine Engine Market Forecast Outlook 2025 to 2035
Small Gas Engine Market Size and Share Forecast Outlook 2025 to 2035
Small Animal Metabolic Monitoring System Market Size and Share Forecast Outlook 2025 to 2035
Small Animal Running Wheel System Market Size and Share Forecast Outlook 2025 to 2035
Small Caliber Ammunition Market Size and Share Forecast Outlook 2025 to 2035
Small Boats Market Size and Share Forecast Outlook 2025 to 2035
Small Capacity Electrolyzer Market Size and Share Forecast Outlook 2025 to 2035
Small Animal Imaging (In Vivo) Market Size and Share Forecast Outlook 2025 to 2035
Small Cell Lung Cancer (SCLC) Treatment Market Size and Share Forecast Outlook 2025 to 2035
Small Cell Network Market Size and Share Forecast Outlook 2025 to 2035
Small Wind Turbine Market Size and Share Forecast Outlook 2025 to 2035
Small Satellite Market by Ticketing Infrastructure, by Orbit Type, by Application & Region Forecast till 2035
Small Off-Road Engines Market Size and Share Forecast Outlook 2025 to 2035
Small Continuous Fryer Market Size and Share Forecast Outlook 2025 to 2035
Small Signal Transistor Market Size and Share Forecast Outlook 2025 to 2035
Small Bowel Enteroscopes Market Size and Share Forecast Outlook 2025 to 2035
Small Paint Pail Market Size and Share Forecast Outlook 2025 to 2035
Small Bore Connectors Market Analysis - Size, Growth, and Forecast 2025 to 2035
Small Space Furniture Market Trends – Growth & Demand 2025 to 2035
Small-Scale Bioreactors Market Analysis by Product, Capacity, End-User, and Region through 2035

Thank you!
You will receive an email from our Business Development Manager. Please be sure to check your SPAM/JUNK folder too.
Chat With
MaRIA