Small Molecule Innovator CDMO Market

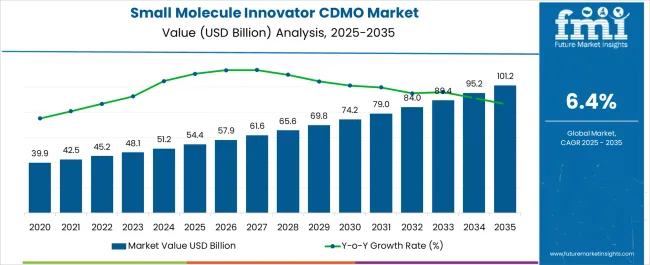
The small molecule innovator CDMO market size is projected to be valued at US$ 48.09 billion in 2023 and is expected to rise to US$ 89.43 billion by 2033. The sales of small molecule innovator CDMO are expected to grow at a significant CAGR of 6.4% during the forecast period. Various factors propelling the demand for small molecule innovator CDMO are:

  • The small molecule innovator CDMO (Contract Development and Manufacturing Organization) market refers to a segment of the pharmaceutical industry that provides contract services for the development and manufacturing of small molecule drugs. Small molecule drugs are typically synthesized organic compounds with a molecular weight of fewer than 900 Daltons.
  • Small molecule innovator CDMOs work with pharmaceutical and biotech companies to provide a range of services including drug development, process development, analytical testing, and commercial manufacturing. These services are provided on a contract basis, allowing the client companies to outsource the development and manufacturing of their drugs while focusing on other aspects of their business such as research, marketing, and sales.
  • The small molecule innovator CDMO market has been growing in recent years, driven by factors such as increasing demand for small molecule drugs, rising R&D costs, and the need for specialized expertise in drug development and manufacturing. The market is highly competitive, with a large number of players offering a wide range of services.

Overall, the small molecule innovator CDMO market is expected to continue to grow in the coming years, driven by increasing demand for small molecule drugs and the need for specialized expertise in drug development and manufacturing.

Attribute Details
Small Molecule Innovator CDMO Market Estimated Size (2023) US$ 48.09 billion
Small Molecule Innovator CDMO Market CAGR (2023 to 2033) 6.4%
Small Molecule Innovator CDMO Market Forecasted Size (2033) US$ 89.43 billion

Don't pay for what you don't need

Customize your report by selecting specific countries or regions and save 30%!

2018 to 2022 Small Molecule Innovator CDMO Market Outlook Compared to 2023 to 2033 Forecast

The Small Molecule Innovator CDMO market was valued at US$ 45.2 billion in 2022, with a substantial growth trajectory of 6.1%% between the analysis period of 2018 to 2022.

The small molecule innovator CDMO market is a growing segment of the pharmaceutical industry that provides contract services for developing and manufacturing small molecule drugs. The market is driven by increasing demand for small-molecule drugs, rising R&D costs, and the need for specialized expertise in drug development and manufacturing.

Future Market Insights expects the small molecule innovator CDMO market to grow at a CAGR of 6.4% from 2023 to 2033. The growth can be attributed to the following reasons

The market is driven by increasing demand for small-molecule drugs, which effectively treat various diseases and disorders. The trend of outsourcing drug development and manufacturing is also driving the market as companies look to reduce costs and gain access to specialized expertise. Additionally, the need for innovative and efficient drug development and manufacturing processes is driving the market.

Overall, the small molecule innovator CDMO market is poised for continued growth, driven by increasing demand for small molecule drugs and the outsourcing of drug development and manufacturing. Companies in this space have to need to stay abreast of new technologies and regulatory requirements to remain competitive in the market.

Considering the factors mentioned above, FMI opines the small molecule innovator CDMO market is more likely to witness a market value of US$ 89.43 billion by the end of 2033.

Insights on the Small Molecule Innovator CDMO Market

  • Growing Demand for Small Molecule Drugs: The demand for small molecule drugs is on the rise due to their effectiveness in treating a wide range of diseases and disorders. Small molecule drugs are also easier to manufacture and have a lower cost of goods, making them attractive to pharmaceutical companies. This has led to an increased demand for small molecule innovator CDMO services.
  • Increasing Outsourcing of Drug Development and Manufacturing: The trend of outsourcing drug development and manufacturing has been gaining momentum in recent years due to rising R&D costs and the need for specialized expertise. Small molecule innovator CDMOs are well-positioned to provide these services, as they have the necessary infrastructure, technology, and expertise to support the development and manufacturing of small molecule drugs.
  • Focus on Quality and Compliance: The small molecule innovator CDMO market is highly regulated, and companies in this space must comply with strict quality and safety standards. As a result, there is a strong focus on quality and compliance, with companies investing in technology and processes to ensure that they meet regulatory requirements.
  • Consolidation in the Market: The small molecule innovator CDMO market is highly fragmented, with a large number of players offering similar services. However, there has been a trend of consolidation in the market, with larger companies acquiring smaller ones to expand their capabilities and geographic reach.
  • Emergence of New Technologies: The small molecule innovator CDMO market is constantly evolving, with new technologies and processes emerging to improve drug development and manufacturing. For example, advances in synthetic biology and biocatalysis are enabling the production of complex small molecules more efficiently and sustainably.
Sabyasachi Ghosh
Sabyasachi Ghosh

Principal Consultant

Talk to Analyst

Find your sweet spots for generating winning opportunities in this market.

Comparative View of Small Molecule Innovator CDMO Market

The following tables analyze the growth prospects of three interrelated markets: the small molecule innovator CDMO market, the small cell lung cancer (SCLC) treatment market, and the infectious disease diagnostics market. Key factors, trends, and restraints influencing their growth are highlighted below.

Small Molecule Innovator CDMO Market:

Attributes Small Molecule Innovator CDMO Market
CAGR (2023 to 2033) 6.4%
Market Value (2033) US$ 89.43 billion
Growth Factor The primary drivers of this expansion are increased pharmaceutical R&D investment, rising demand for small molecules, and rising cancer and age-related disorders incidence.
Opportunity Small molecules are less expensive than biological drugs. As a result, the increasing demand for cost-effective drugs is expected to fuel market growth.

Small Cell Lung Cancer (SCLC) Treatment Market:

Attributes Small Cell Lung Cancer (SCLC) Treatment Market
CAGR (2023 to 2033) 13.1%
Market Value (2033) US$ 3.47 million
Growth Factor The increasing need for personalized therapy, the availability of extremely effective drugs, the growing elderly population, and the prevalence of unhealthy habits are the primary factors driving the global small cell lung cancer therapeutics market.
Opportunity Increased funding for research and the development of novel treatments, increased pollution as a result of rapid industrialization, and an increase in the number of smokers are all factors contributing to the rising prevalence of lung cancer.

Infectious Disease Diagnostics Market:

Attributes Infectious Disease Diagnostics Market
CAGR (2023 to 2033) 4.3%
Market Value (2033) US$ 747.3 million
Growth Factor Small bore connectors are devices that connect medical equipment such as syringes, tubing, drips, and others in order to deliver gases, medicines, and fluids to patients. As a result, increased emphasis on the use of high-performance medical devices to improve patient safety and reduce medical errors is expected to favor market growth.
Opportunity Since small-bore connectors are widely used to deliver oxygen and other liquid medications to patients suffering from these diseases, the rising prevalence of respiratory disorders is expected to drive market growth in the coming years.

Category-wise Insights of Small Molecule Innovator CDMO

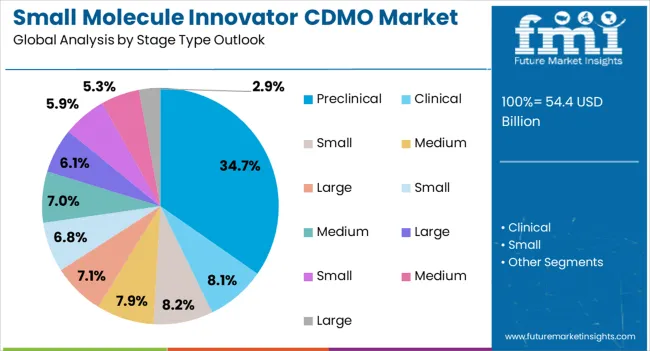
In 2022, the clinical stage segment is expected to have a prominent share of 55.1%.

The market is divided into three stages: preclinical, clinical, and commercial. A large number of small-molecule drugs are in the clinical stage. Aside from that, drug research and development spending is constantly increasing. For example, according to World Preview, total research and development spending on drugs accounted for US$ 226.0 billion in 2022, and total R&D spending on drugs is expected to reach US$ 254.0 billion by 2026. The increase in R&D spending is expected to boost clinical segment growth.

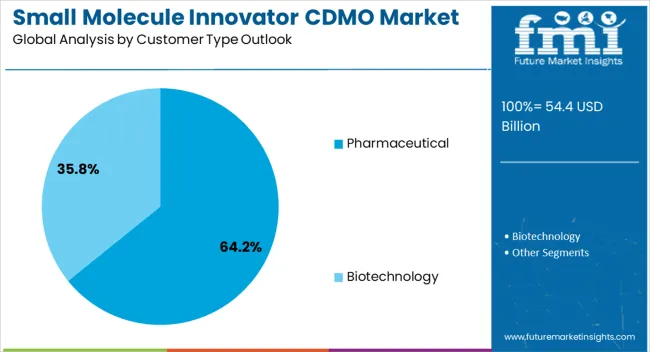
The biotechnology sector is expected to grow at a 4.8% annual rate during the forecast period.

The rapid advancement of biopharmaceutical research and technology creates new opportunities for developing innovative and creative small-molecule drugs. Advances in prediction, structure-based design, and imaging, as well as automation, artificial intelligence, and machine learning, have all become major enablers for small molecule-led optimization to speed up and improve success rates in recent years.

The oncology segment held a prominent share of 41.8% in 2022 and is expected to record a profitable CAGR of more than 7.0% during the forecast period.

The market is divided into therapeutic areas such as cardiovascular diseases, oncology, respiratory disorders, neurology, metabolic disorders, infectious diseases, and others. Other factors driving segment growth include an increase in cancer cases worldwide, significant government reimbursement policies, and an increase in funding for the development of small-molecule oncology therapies.

Get the data you need at a Fraction of the cost

Personalize your report by choosing insights you need
and save 40%!

Regional Analysis of Small Molecule Innovator CDMO Market

North America is expected to record a CAGR of 5.8% through 2033

North America is a significant contributor to the growth of the Contract Development & Manufacturing Organization (CDMO) industry for small molecule API innovators.

North America is one of the significant markets for small molecule innovator CDMOs, accounting for a significant share of the global market. The region is home to many large pharmaceutical companies and has a well-established healthcare infrastructure, which drives demand for small-molecule drugs. Additionally, the trend of outsourcing drug development and manufacturing is also driving the market in the region.
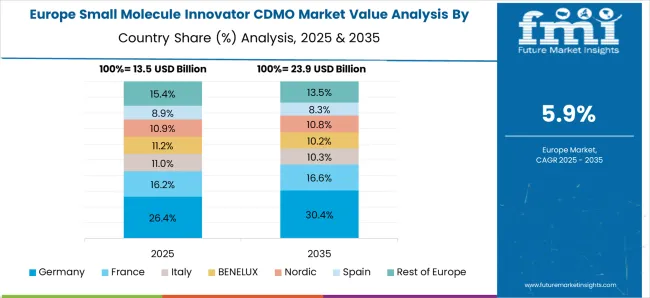
European region has a well-developed healthcare system, and the authority is supportive of the pharmaceutical industry's development

Europe is another potential market for small molecule innovator CDMOs, with a well-established pharmaceutical industry and a strong focus on research and development. The region is also home to many contract manufacturing organizations (CMOs) that provide small molecule innovator CDMO services.

In 2022, Asia Pacific had the Prominent Revenue Share of 42.1%.

Technological advancements, low service costs, and the availability of skilled labor are expected to drive regional market growth.

Asia Pacific region is expected to be the highly progressive market for small molecule innovator CDMOs, driven by increasing demand for small molecule drugs and a growing pharmaceutical industry. The region is home to many contract manufacturing organizations, particularly in countries such as India and China, which offer cost-effective services.

Given the presence of a large number of pharmaceutical and biotechnology companies, the Latin American small molecule innovator CDMO market is expected to grow at a moderate rate.

Latin America is a growing market for small molecule innovator CDMOs, driven by increasing demand for affordable healthcare and rising investment in the pharmaceutical industry. Brazil and Mexico are the potential markets in the region.

Middle East and Africa

The Middle East and Africa region is a relatively small market for small molecule innovator CDMOs. However, the region is experiencing significant growth in the pharmaceutical industry, driven by rising demand for affordable healthcare and increasing investment in healthcare infrastructure.
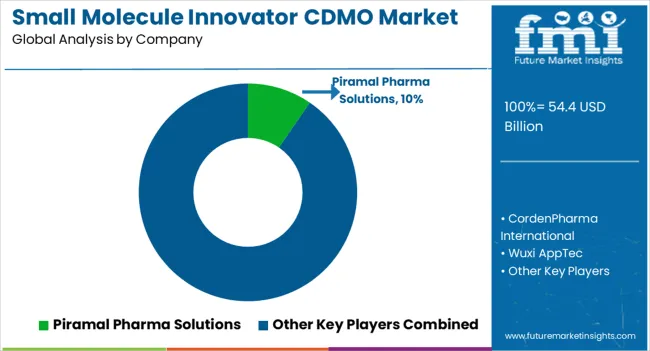
Competitive Landscape/Key Players Operating in Small Molecule Innovator CDMO Market Include

The small molecule innovator CDMO market is highly competitive, with several key players dominating the market. The market is characterized by a few large players and many smaller players, with some companies offering a full suite of services while others focus on a specific aspect of drug development or manufacturing. Here is an overview of the competitive landscape in the market:

Key Companies Profile

  • Lonza Group: Lonza Group is a leading player in the Small Molecule Innovator CDMO Market, offering a wide range of services, including drug development, process development, and commercial manufacturing. The company operates in North America, Europe, and Asia-Pacific, and serves both pharmaceutical and biotech companies.
  • Catalent, Inc.: Catalent, Inc. is another significant player in the market, offering services in drug development, process development, analytical testing, and commercial manufacturing. The company operates in North America, Europe, and Asia-Pacific, and serves both branded and generic small molecule drugs.
  • Thermo Fisher Scientific, Inc.: Thermo Fisher Scientific, Inc. is a global leader in the life sciences industry and offers a wide range of services for small molecule drug development and manufacturing. The company operates in North America, Europe, and Asia-Pacific, and serves both pharmaceutical and biotech companies.
  • Patheon N.V.: Patheon N.V. is a leading contract development and manufacturing organization, offering services in drug development, process development, and commercial manufacturing. The company operates in North America, Europe, and Asia-Pacific, and serves both branded and generic small molecule drugs.
  • Cambrex Corporation: Cambrex Corporation is a global leader in the small molecule innovator CDMO market, offering services in drug development, process development, and commercial manufacturing. The company operates in North America, Europe, and Asia-Pacific, and serves both pharmaceutical and biotech companies.

Other key players in the market include WuXi AppTec Co., Ltd., Piramal Pharma Solutions, Jubilant Life Sciences Ltd., Recipharm AB, and Sterling Pharma Solutions.

Overall, the small molecule innovator CDMO market is highly competitive, with several large players dominating the market. These companies offer a wide range of services and operate globally, serving both pharmaceutical and biotech companies. The market is also characterized by many smaller players, particularly in the Asia-Pacific region, which offer cost-effective services. Companies in the space will need to navigate intense competition, changing customer demands, and evolving regulatory requirements to remain competitive.

Recent Developments

  • Catalent, a global provider and distributor of superior medicines, announced the completion of a US$ 2.2 million expansion to its clinical supply facility in Singapore, resulting in a 31,000 square-foot increase in the site's footprint, allowing for the installation of 35 additional new ultra-low temperature (ULT) freezers. The facility is now better equipped to handle biopharmaceuticals and advanced modalities such as mRNA-based vaccines, cell and gene therapies, and larger packaging campaigns as a result of the investment.
  • December 2022: Thermo Fisher Scientific, a global leader in scientific services, recently opened a new facility in Hangzhou, China, as part of a global initiative to help businesses deliver treatments to patients more quickly.

Scope of the Report

Attribute Details
Growth Rate CAGR of 6.4% from 2023 to 2033
Base Year of Estimation 2022
Historical Data 2018 to 2022
Forecast Period 2023 to 2033
Quantitative Units Revenue in US$ Billion and Volume in Units and F-CAGR from 2022-2032
Report Coverage Revenue Forecast, Volume Forecast, Company Ranking, Competitive Landscape, growth factors, Trends and Pricing Analysis
Key Segments Covered By Therapeutic Area, By Product, By Stage Type, By Customer Type, By Region
Regions Covered North America; Latin America; Europe; East Asia; South Asia; Middle East & Africa; Oceania
Key Countries Profiled USA, Canada, Brazil, Mexico, Germany, Italy, France, United kingdom, Spain, Russia, China, Japan, India, GCC Countries, Australia
Key Companies Profiled Piramal Pharma Solutions; CordenPharma International; Wuxi AppTec; Cambrex Corporation; Recipharm AB; Pantheon (Thermo Fisher Scientific); Lonza; Catalent Inc.; Siegfried Holding AG; Boehringer Ingelheim; Labcorp Drug Development
Customization & Pricing Available upon Request

Key Segments Covered in the Small Molecule Innovator CDMO Market Report

  • Product Outlook
  • Small Molecule API
    • Small Molecule Drug Product
    • Oral solid dose
    • Semi-Solid Dose
    • Liquid Dose
    • Others

Stage Type Outlook:

  • Preclinical
  • Clinical
    • Phase I
  • Small
  • Medium
  • Large
    • Phase II
  • Small
  • Medium
  • Large
    • Phase III
  • Small
  • Medium
  • Large
  • Commercial

Customer Type Outlook:

  • Pharmaceutical
    • Small
    • Medium
    • Large
  • Biotechnology

Therapeutic Area Outlook:

  • Cardiovascular disease
  • Oncology
  • Respiratory disorders
  • Neurology
  • Metabolic disorders
  • Infectious disease
  • Others

By Region:

  • North America
  • Latin America
  • Western Europe
  • Eastern Europe
  • Asia Pacific excluding Japan (APEJ)
  • Japan
  • Middle East & Africa (MEA)

Frequently Asked Questions

Which Countries Dominate the Global Small Molecule Innovator CDMO Market?

The United States, Japan, and China dominate the global market.

What is the Growth Forecast for the Small Molecule Innovator CDMO Market?

The market is forecast to register a CAGR of 6.4% through 2033.

How was the Historical Performance of the Small Molecule Innovator CDMO Market?

During 2018 to 2022, the market recorded a CAGR of 6.1%.

Which is the Top Trend in the Small Molecule Innovator CDMO Market?

Technological advancement is the current market trends.

What is the Projected Size of the Market by 2033?

The global market size to reach US$ 89.43 billion by 2033.

Table of Content
1. Executive Summary | Small Molecule Innovator CDMO Market

    1.1. Global Market Outlook

    1.2. Demand-side Trends

    1.3. Supply-side Trends

    1.4. Technology Roadmap Analysis

    1.5. Analysis and Recommendations

2. Market Overview

    2.1. Market Coverage / Taxonomy

    2.2. Market Definition / Scope / Limitations

3. Market Background

    3.1. Market Dynamics

        3.1.1. Drivers

        3.1.2. Restraints

        3.1.3. Opportunity

        3.1.4. Trends

    3.2. Scenario Forecast

        3.2.1. Demand in Optimistic Scenario

        3.2.2. Demand in Likely Scenario

        3.2.3. Demand in Conservative Scenario

    3.3. Opportunity Map Analysis

    3.4. Investment Feasibility Matrix

    3.5. PESTLE and Porter’s Analysis

    3.6. Regulatory Landscape

        3.6.1. By Key Regions

        3.6.2. By Key Countries

    3.7. Regional Parent Market Outlook

4. Global Market Analysis 2018 to 2022 and Forecast, 2023 to 2033

    4.1. Historical Market Size Value (US$ Million) Analysis, 2018 to 2022

    4.2. Current and Future Market Size Value (US$ Million) Projections, 2023 to 2033

        4.2.1. Y-o-Y Growth Trend Analysis

        4.2.2. Absolute $ Opportunity Analysis

5. Global Market Analysis 2018 to 2022 and Forecast 2023 to 2033, By Product

    5.1. Introduction / Key Findings

    5.2. Historical Market Size Value (US$ Million) Analysis By Product, 2018 to 2022

    5.3. Current and Future Market Size Value (US$ Million) Analysis and Forecast By Product, 2023 to 2033

        5.3.1. Small Molecule API

        5.3.2. Small Molecule Drug Product

    5.4. Y-o-Y Growth Trend Analysis By Product, 2018 to 2022

    5.5. Absolute $ Opportunity Analysis By Product, 2023 to 2033

6. Global Market Analysis 2018 to 2022 and Forecast 2023 to 2033, By Stage Type

    6.1. Introduction / Key Findings

    6.2. Historical Market Size Value (US$ Million) Analysis By Stage Type, 2018 to 2022

    6.3. Current and Future Market Size Value (US$ Million) Analysis and Forecast By Stage Type, 2023 to 2033

        6.3.1. Preclinical

        6.3.2. Clinical

            6.3.2.1. Phase I

            6.3.2.2. Phase II

            6.3.2.3. Phase III

        6.3.3. Commercial

    6.4. Y-o-Y Growth Trend Analysis By Stage Type, 2018 to 2022

    6.5. Absolute $ Opportunity Analysis By Stage Type, 2023 to 2033

7. Global Market Analysis 2018 to 2022 and Forecast 2023 to 2033, By Customer Type

    7.1. Introduction / Key Findings

    7.2. Historical Market Size Value (US$ Million) Analysis By Customer Type , 2018 to 2022

    7.3. Current and Future Market Size Value (US$ Million) Analysis and Forecast By Customer Type , 2023 to 2033

        7.3.1. Pharmaceutical

        7.3.2. Biotechnology

    7.4. Y-o-Y Growth Trend Analysis By Customer Type , 2018 to 2022

    7.5. Absolute $ Opportunity Analysis By Customer Type , 2023 to 2033

8. Global Market Analysis 2018 to 2022 and Forecast 2023 to 2033, By Therapeutic Area

    8.1. Introduction / Key Findings

    8.2. Historical Market Size Value (US$ Million) Analysis By Therapeutic Area, 2018 to 2022

    8.3. Current and Future Market Size Value (US$ Million) Analysis and Forecast By Therapeutic Area, 2023 to 2033

        8.3.1. Cardiovascular disease

        8.3.2. Oncology

        8.3.3. Respiratory disorders

        8.3.4. Neurology

        8.3.5. Metabolic disorders

        8.3.6. Infectious disease

        8.3.7. Others

    8.4. Y-o-Y Growth Trend Analysis By Therapeutic Area, 2018 to 2022

    8.5. Absolute $ Opportunity Analysis By Therapeutic Area, 2023 to 2033

9. Global Market Analysis 2018 to 2022 and Forecast 2023 to 2033, By Region

    9.1. Introduction

    9.2. Historical Market Size Value (US$ Million) Analysis By Region, 2018 to 2022

    9.3. Current Market Size Value (US$ Million) Analysis and Forecast By Region, 2023 to 2033

        9.3.1. North America

        9.3.2. Latin America

        9.3.3. Europe

        9.3.4. South Asia

        9.3.5. East Asia

        9.3.6. Oceania

        9.3.7. MEA

    9.4. Market Attractiveness Analysis By Region

10. North America Market Analysis 2018 to 2022 and Forecast 2023 to 2033, By Country

    10.1. Historical Market Size Value (US$ Million) Trend Analysis By Market Taxonomy, 2018 to 2022

    10.2. Market Size Value (US$ Million) Forecast By Market Taxonomy, 2023 to 2033

        10.2.1. By Country

            10.2.1.1. USA

            10.2.1.2. Canada

        10.2.2. By Product

        10.2.3. By Stage Type

        10.2.4. By Customer Type

        10.2.5. By Therapeutic Area

    10.3. Market Attractiveness Analysis

        10.3.1. By Country

        10.3.2. By Product

        10.3.3. By Stage Type

        10.3.4. By Customer Type

        10.3.5. By Therapeutic Area

    10.4. Key Takeaways

11. Latin America Market Analysis 2018 to 2022 and Forecast 2023 to 2033, By Country

    11.1. Historical Market Size Value (US$ Million) Trend Analysis By Market Taxonomy, 2018 to 2022

    11.2. Market Size Value (US$ Million) Forecast By Market Taxonomy, 2023 to 2033

        11.2.1. By Country

            11.2.1.1. Brazil

            11.2.1.2. Mexico

            11.2.1.3. Rest of Latin America

        11.2.2. By Product

        11.2.3. By Stage Type

        11.2.4. By Customer Type

        11.2.5. By Therapeutic Area

    11.3. Market Attractiveness Analysis

        11.3.1. By Country

        11.3.2. By Product

        11.3.3. By Stage Type

        11.3.4. By Customer Type

        11.3.5. By Therapeutic Area

    11.4. Key Takeaways

12. Europe Market Analysis 2018 to 2022 and Forecast 2023 to 2033, By Country

    12.1. Historical Market Size Value (US$ Million) Trend Analysis By Market Taxonomy, 2018 to 2022

    12.2. Market Size Value (US$ Million) Forecast By Market Taxonomy, 2023 to 2033

        12.2.1. By Country

            12.2.1.1. Germany

            12.2.1.2. United kingdom

            12.2.1.3. France

            12.2.1.4. Spain

            12.2.1.5. Italy

            12.2.1.6. Rest of Europe

        12.2.2. By Product

        12.2.3. By Stage Type

        12.2.4. By Customer Type

        12.2.5. By Therapeutic Area

    12.3. Market Attractiveness Analysis

        12.3.1. By Country

        12.3.2. By Product

        12.3.3. By Stage Type

        12.3.4. By Customer Type

        12.3.5. By Therapeutic Area

    12.4. Key Takeaways

13. South Asia Market Analysis 2018 to 2022 and Forecast 2023 to 2033, By Country

    13.1. Historical Market Size Value (US$ Million) Trend Analysis By Market Taxonomy, 2018 to 2022

    13.2. Market Size Value (US$ Million) Forecast By Market Taxonomy, 2023 to 2033

        13.2.1. By Country

            13.2.1.1. India

            13.2.1.2. Malaysia

            13.2.1.3. Singapore

            13.2.1.4. Thailand

            13.2.1.5. Rest of South Asia

        13.2.2. By Product

        13.2.3. By Stage Type

        13.2.4. By Customer Type

        13.2.5. By Therapeutic Area

    13.3. Market Attractiveness Analysis

        13.3.1. By Country

        13.3.2. By Product

        13.3.3. By Stage Type

        13.3.4. By Customer Type

        13.3.5. By Therapeutic Area

    13.4. Key Takeaways

14. East Asia Market Analysis 2018 to 2022 and Forecast 2023 to 2033, By Country

    14.1. Historical Market Size Value (US$ Million) Trend Analysis By Market Taxonomy, 2018 to 2022

    14.2. Market Size Value (US$ Million) Forecast By Market Taxonomy, 2023 to 2033

        14.2.1. By Country

            14.2.1.1. China

            14.2.1.2. Japan

            14.2.1.3. South Korea

        14.2.2. By Product

        14.2.3. By Stage Type

        14.2.4. By Customer Type

        14.2.5. By Therapeutic Area

    14.3. Market Attractiveness Analysis

        14.3.1. By Country

        14.3.2. By Product

        14.3.3. By Stage Type

        14.3.4. By Customer Type

        14.3.5. By Therapeutic Area

    14.4. Key Takeaways

15. Oceania Market Analysis 2018 to 2022 and Forecast 2023 to 2033, By Country

    15.1. Historical Market Size Value (US$ Million) Trend Analysis By Market Taxonomy, 2018 to 2022

    15.2. Market Size Value (US$ Million) Forecast By Market Taxonomy, 2023 to 2033

        15.2.1. By Country

            15.2.1.1. Australia

            15.2.1.2. New Zealand

        15.2.2. By Product

        15.2.3. By Stage Type

        15.2.4. By Customer Type

        15.2.5. By Therapeutic Area

    15.3. Market Attractiveness Analysis

        15.3.1. By Country

        15.3.2. By Product

        15.3.3. By Stage Type

        15.3.4. By Customer Type

        15.3.5. By Therapeutic Area

    15.4. Key Takeaways

16. MEA Market Analysis 2018 to 2022 and Forecast 2023 to 2033, By Country

    16.1. Historical Market Size Value (US$ Million) Trend Analysis By Market Taxonomy, 2018 to 2022

    16.2. Market Size Value (US$ Million) Forecast By Market Taxonomy, 2023 to 2033

        16.2.1. By Country

            16.2.1.1. GCC Countries

            16.2.1.2. South Africa

            16.2.1.3. Israel

            16.2.1.4. Rest of MEA

        16.2.2. By Product

        16.2.3. By Stage Type

        16.2.4. By Customer Type

        16.2.5. By Therapeutic Area

    16.3. Market Attractiveness Analysis

        16.3.1. By Country

        16.3.2. By Product

        16.3.3. By Stage Type

        16.3.4. By Customer Type

        16.3.5. By Therapeutic Area

    16.4. Key Takeaways

17. Key Countries Market Analysis

    17.1. USA

        17.1.1. Pricing Analysis

        17.1.2. Market Share Analysis, 2022

            17.1.2.1. By Product

            17.1.2.2. By Stage Type

            17.1.2.3. By Customer Type

            17.1.2.4. By Therapeutic Area

    17.2. Canada

        17.2.1. Pricing Analysis

        17.2.2. Market Share Analysis, 2022

            17.2.2.1. By Product

            17.2.2.2. By Stage Type

            17.2.2.3. By Customer Type

            17.2.2.4. By Therapeutic Area

    17.3. Brazil

        17.3.1. Pricing Analysis

        17.3.2. Market Share Analysis, 2022

            17.3.2.1. By Product

            17.3.2.2. By Stage Type

            17.3.2.3. By Customer Type

            17.3.2.4. By Therapeutic Area

    17.4. Mexico

        17.4.1. Pricing Analysis

        17.4.2. Market Share Analysis, 2022

            17.4.2.1. By Product

            17.4.2.2. By Stage Type

            17.4.2.3. By Customer Type

            17.4.2.4. By Therapeutic Area

    17.5. Germany

        17.5.1. Pricing Analysis

        17.5.2. Market Share Analysis, 2022

            17.5.2.1. By Product

            17.5.2.2. By Stage Type

            17.5.2.3. By Customer Type

            17.5.2.4. By Therapeutic Area

    17.6. United kingdom

        17.6.1. Pricing Analysis

        17.6.2. Market Share Analysis, 2022

            17.6.2.1. By Product

            17.6.2.2. By Stage Type

            17.6.2.3. By Customer Type

            17.6.2.4. By Therapeutic Area

    17.7. France

        17.7.1. Pricing Analysis

        17.7.2. Market Share Analysis, 2022

            17.7.2.1. By Product

            17.7.2.2. By Stage Type

            17.7.2.3. By Customer Type

            17.7.2.4. By Therapeutic Area

    17.8. Spain

        17.8.1. Pricing Analysis

        17.8.2. Market Share Analysis, 2022

            17.8.2.1. By Product

            17.8.2.2. By Stage Type

            17.8.2.3. By Customer Type

            17.8.2.4. By Therapeutic Area

    17.9. Italy

        17.9.1. Pricing Analysis

        17.9.2. Market Share Analysis, 2022

            17.9.2.1. By Product

            17.9.2.2. By Stage Type

            17.9.2.3. By Customer Type

            17.9.2.4. By Therapeutic Area

    17.10. India

        17.10.1. Pricing Analysis

        17.10.2. Market Share Analysis, 2022

            17.10.2.1. By Product

            17.10.2.2. By Stage Type

            17.10.2.3. By Customer Type

            17.10.2.4. By Therapeutic Area

    17.11. Malaysia

        17.11.1. Pricing Analysis

        17.11.2. Market Share Analysis, 2022

            17.11.2.1. By Product

            17.11.2.2. By Stage Type

            17.11.2.3. By Customer Type

            17.11.2.4. By Therapeutic Area

    17.12. Singapore

        17.12.1. Pricing Analysis

        17.12.2. Market Share Analysis, 2022

            17.12.2.1. By Product

            17.12.2.2. By Stage Type

            17.12.2.3. By Customer Type

            17.12.2.4. By Therapeutic Area

    17.13. Thailand

        17.13.1. Pricing Analysis

        17.13.2. Market Share Analysis, 2022

            17.13.2.1. By Product

            17.13.2.2. By Stage Type

            17.13.2.3. By Customer Type

            17.13.2.4. By Therapeutic Area

    17.14. China

        17.14.1. Pricing Analysis

        17.14.2. Market Share Analysis, 2022

            17.14.2.1. By Product

            17.14.2.2. By Stage Type

            17.14.2.3. By Customer Type

            17.14.2.4. By Therapeutic Area

    17.15. Japan

        17.15.1. Pricing Analysis

        17.15.2. Market Share Analysis, 2022

            17.15.2.1. By Product

            17.15.2.2. By Stage Type

            17.15.2.3. By Customer Type

            17.15.2.4. By Therapeutic Area

    17.16. South Korea

        17.16.1. Pricing Analysis

        17.16.2. Market Share Analysis, 2022

            17.16.2.1. By Product

            17.16.2.2. By Stage Type

            17.16.2.3. By Customer Type

            17.16.2.4. By Therapeutic Area

    17.17. Australia

        17.17.1. Pricing Analysis

        17.17.2. Market Share Analysis, 2022

            17.17.2.1. By Product

            17.17.2.2. By Stage Type

            17.17.2.3. By Customer Type

            17.17.2.4. By Therapeutic Area

    17.18. New Zealand

        17.18.1. Pricing Analysis

        17.18.2. Market Share Analysis, 2022

            17.18.2.1. By Product

            17.18.2.2. By Stage Type

            17.18.2.3. By Customer Type

            17.18.2.4. By Therapeutic Area

    17.19. GCC Countries

        17.19.1. Pricing Analysis

        17.19.2. Market Share Analysis, 2022

            17.19.2.1. By Product

            17.19.2.2. By Stage Type

            17.19.2.3. By Customer Type

            17.19.2.4. By Therapeutic Area

    17.20. South Africa

        17.20.1. Pricing Analysis

        17.20.2. Market Share Analysis, 2022

            17.20.2.1. By Product

            17.20.2.2. By Stage Type

            17.20.2.3. By Customer Type

            17.20.2.4. By Therapeutic Area

    17.21. Israel

        17.21.1. Pricing Analysis

        17.21.2. Market Share Analysis, 2022

            17.21.2.1. By Product

            17.21.2.2. By Stage Type

            17.21.2.3. By Customer Type

            17.21.2.4. By Therapeutic Area

18. Market Structure Analysis

    18.1. Competition Dashboard

    18.2. Competition Benchmarking

    18.3. Market Share Analysis of Top Players

        18.3.1. By Regional

        18.3.2. By Product

        18.3.3. By Stage Type

        18.3.4. By Customer Type

        18.3.5. By Therapeutic Area

19. Competition Analysis

    19.1. Competition Deep Dive

        19.1.1. Piramal Pharma Solutions

            19.1.1.1. Overview

            19.1.1.2. Product Portfolio

            19.1.1.3. Profitability by Market Segments

            19.1.1.4. Sales Footprint

            19.1.1.5. Strategy Overview

                19.1.1.5.1. Marketing Strategy

        19.1.2. CordenPharma International

            19.1.2.1. Overview

            19.1.2.2. Product Portfolio

            19.1.2.3. Profitability by Market Segments

            19.1.2.4. Sales Footprint

            19.1.2.5. Strategy Overview

                19.1.2.5.1. Marketing Strategy

        19.1.3. Wuxi AppTec

            19.1.3.1. Overview

            19.1.3.2. Product Portfolio

            19.1.3.3. Profitability by Market Segments

            19.1.3.4. Sales Footprint

            19.1.3.5. Strategy Overview

                19.1.3.5.1. Marketing Strategy

        19.1.4. Cambrex Corporation

            19.1.4.1. Overview

            19.1.4.2. Product Portfolio

            19.1.4.3. Profitability by Market Segments

            19.1.4.4. Sales Footprint

            19.1.4.5. Strategy Overview

                19.1.4.5.1. Marketing Strategy

        19.1.5. Recipharm AB

            19.1.5.1. Overview

            19.1.5.2. Product Portfolio

            19.1.5.3. Profitability by Market Segments

            19.1.5.4. Sales Footprint

            19.1.5.5. Strategy Overview

                19.1.5.5.1. Marketing Strategy

        19.1.6. Thermo Fisher Scientific

            19.1.6.1. Overview

            19.1.6.2. Product Portfolio

            19.1.6.3. Profitability by Market Segments

            19.1.6.4. Sales Footprint

            19.1.6.5. Strategy Overview

                19.1.6.5.1. Marketing Strategy

        19.1.7. Lonza

            19.1.7.1. Overview

            19.1.7.2. Product Portfolio

            19.1.7.3. Profitability by Market Segments

            19.1.7.4. Sales Footprint

            19.1.7.5. Strategy Overview

                19.1.7.5.1. Marketing Strategy

        19.1.8. Catalent Inc.

            19.1.8.1. Overview

            19.1.8.2. Product Portfolio

            19.1.8.3. Profitability by Market Segments

            19.1.8.4. Sales Footprint

            19.1.8.5. Strategy Overview

                19.1.8.5.1. Marketing Strategy

        19.1.9. Siegfried Holding AG

            19.1.9.1. Overview

            19.1.9.2. Product Portfolio

            19.1.9.3. Profitability by Market Segments

            19.1.9.4. Sales Footprint

            19.1.9.5. Strategy Overview

                19.1.9.5.1. Marketing Strategy

        19.1.10. Boehringer Ingelheim

            19.1.10.1. Overview

            19.1.10.2. Product Portfolio

            19.1.10.3. Profitability by Market Segments

            19.1.10.4. Sales Footprint

            19.1.10.5. Strategy Overview

                19.1.10.5.1. Marketing Strategy

        19.1.11. Labcorp Drug Development

            19.1.11.1. Overview

            19.1.11.2. Product Portfolio

            19.1.11.3. Profitability by Market Segments

            19.1.11.4. Sales Footprint

            19.1.11.5. Strategy Overview

                19.1.11.5.1. Marketing Strategy

20. Assumptions & Acronyms Used

21. Research Methodology
Recommendations

Healthcare

Small Molecule API Market

March 2021

REP-GB-4591

November 2023

300 pages

Healthcare

RNA-Targeted Small Molecules Market

September 2024

REP-GB-13901

Upcoming

Explore Healthcare Insights

View Reports
Future Market Insights

Small Molecule Innovator CDMO Market