
- Market Size (2026)
- USD 7095.0 Mn
- Forecast (2036)
- USD 12948.0 Mn
- CAGR (2026 to 2036)
- 6.2%
How big is Small Space Furniture Market in 2026?
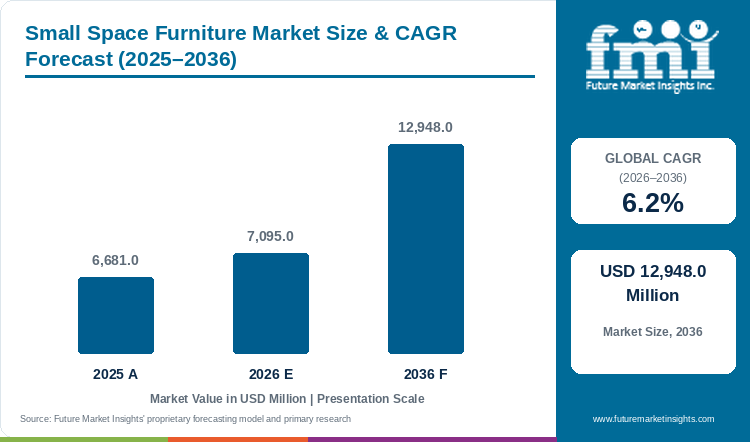
Small space furniture sales rise from USD 6,681 million in 2025 to USD 7,095 million in 2026 and are projected to reach USD 12,948 million by 2036, growing at a CAGR of 6.2% from 2026 to 2036, as one-person households and smaller rental units push buyers toward convertible and compact pieces.
Small space furniture market size stood at USD 6,681 million in 2025, is estimated at USD 7,095 million in 2026 and is projected to reach USD 12,948 million by 2036, according to FMI. Sales of small space furniture will grow at a CAGR of 6.2% from 2026 to 2036, as per FMI. Housing data from the main profiled markets points to tighter rooms and stretched budgets. The median US rental unit completed in 2025 measured 1,000 square feet against 2,142 square feet for a new single-family home.[1] Some 22.7 million US renter households, or 49%, were cost-burdened in 2024, a record high.[2]
The UK had 8.6 million people living alone in 2025, 29.5% of households.[3] South Korea counted 8.24 million one-person households in 2025, 36.6% of the total, up from 23.9% in 2010.[4] Together these indicators point to a structural shift in which more households furnish fewer square metres on tighter budgets, a pattern that favours pieces doing two jobs in one footprint.
Retailers are reshaping stores and price points around compact homes. In February 2026, IKEA announced 10 US stores for 2026, including a city-centre store in Los Angeles.[5] Online demand is holding up, as Wayfair's US revenue grew 8.7% in the second quarter of 2026.[6] Ori reports robotic systems in about 1,750 apartments across 140 buildings, installed with developers such as Greystar and Related Companies.[7] Suppliers that sell planning services, compact-format stores and developer contracts alongside product will take a larger share of new demand through 2036.
Key Market Trends & Insights
- By furniture type, seating led the market with an estimated 36% of sales in 2026, ahead of beds at 24% and tables and desks at 18%, as the core purchase for a studio or one-bedroom home. About 42% of the 484,000 US multifamily units completed in 2025 had one bedroom.[1]
- By material, wood held an estimated 46% of sales in 2026, ahead of metal at 22%, plastic at 14%, glass at 7% and others at 11%, covering solid and engineered wood frames used in wall-bed cabinets and extending tables. A 10% duty on softwood lumber and a 25% duty on certain imported furniture remain in effect in the US.[8]
- By end use, residential buyers accounted for an estimated 74% of sales in 2026, and commercial buyers for 26%. The UK had 8.6 million people living alone in 2025, 29.5% of all households.[3]
- By distribution channel, offline channels held an estimated 58% of sales in 2026 and online channels 42%, and both expanded. Wayfair counted 21.7 million active customers at June 2026, up 3.3%.[6]
Regional Highlights
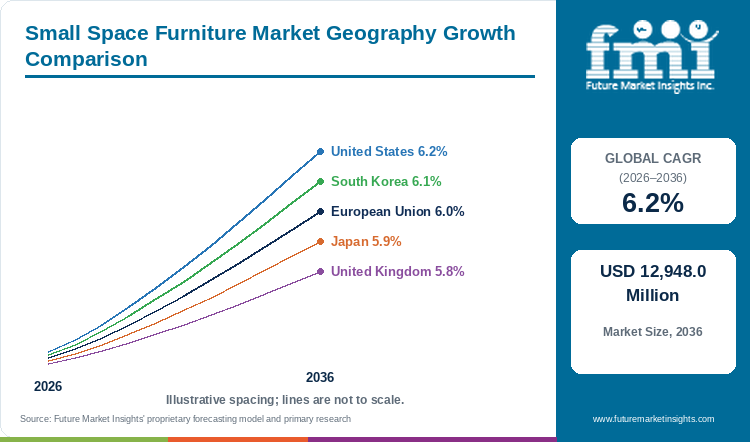
- The United States leads the profiled set at 6.2% CAGR from 2026 to 2036, level with the global rate.
- South Korea follows at 6.1% CAGR, the European Union at 6.0%, Japan at 5.9% and the United Kingdom at 5.8%.
- South Korea's one-person households reached 36.6% of the total in 2025, and apartments made up 65.8% of homes.[4]
Market Size & Forecast
Table 1: Market Size and Forecast for the Small Space Furniture Market (USD million and percentage), 2025 to 2036
| Metric | Value |
|---|---|
| 2025 Market Size | USD 6,681 million |
| Estimated Market Size in 2026 | USD 7,095 million |
| Projected Market Size by 2036 | USD 12,948 million |
| CAGR, 2026 to 2036 | 6.2% |
| Added Revenue, 2026 to 2036 | USD 5,853 million |
| Market Expansion Multiple | 1.8x |
Housing Size, Affordability and Furniture-Fit
Table 2: Housing Size, Affordability and Furniture-Fit Indicators for the Small Space Furniture Market (square feet, percentage and count), mixed reporting years from 2024 to 2025
| Indicator | Data Point | Relevance | Source |
|---|---|---|---|
| Median floor area, US multifamily units built for rent, 2025 | 1,000 sq ft, against 2,142 sq ft for new single-family homes; 42% of 484,000 multifamily units had one bedroom | Sets the room sizes that sofas, beds and tables need to fit in new rental stock | [1] |
| US renter households paying over 30% of income for housing, 2024 | 22.7 million, 49% of renters | Caps budget per piece and favours one item doing two jobs | [2] |
| People living alone, UK, 2025 | 8.6 million, 29.5% of households | Supports demand for single-room furniture sets | [3] |
| One-person households, South Korea, 2025 | 36.6% of households, up from 23.9% in 2010 | Marks a large buyer group for single-room furniture sets | [4] |
| Households, Japan, 2025 | 57.1 million, up 2.3% from 2020; average household size 2.15 | Shows more households on a shrinking population | [9] |
Analyst Perspective
“Rooms in new rental stock are getting smaller and rents are taking a larger slice of income. That combination rewards furniture that folds, stacks or converts. Brands that plan rooms with customers, sell online and supply developers directly will gain as urban homes shrink through 2036.”
- Rahul Pandita, Principal Consultant, Future Market Insights.
How is the Small Space Furniture Market segmented?
The small space furniture market is segmented by furniture type, material, end use, distribution channel, and region.
By furniture type: seating (chairs, sofas and sofa beds), tables and desks, beds (wall beds, storage beds, bunk and loft beds), storage (cupboards, cabinets and shelving), and others.
By material: wood (solid and engineered), metal, plastic, glass, and others (including leather and fabric upholstered pieces).
By end use: residential (living room, kitchen and dining, bedroom, outdoor, and others) and commercial (hotels and hospitality, offices, and others).
By distribution channel: offline channels and online channels.
By region: North America, Latin America, Western Europe, Eastern Europe, East Asia, South Asia and Pacific, and Middle East and Africa.
Why does seating lead the furniture type axis?
Seating holds an estimated 36% of furniture type sales in 2026, as a convertible sofa or folding chair set is usually the first piece bought for a studio or one-bedroom unit.
Table 3: Furniture Type Share for the Small Space Furniture Market (percentage share), 2026
| Furniture Type | Estimated Share (2026) |
|---|---|
| Seating | 36% |
| Tables and Desks | 18% |
| Beds | 24% |
| Storage | 15% |
| Others | 7% |
| Total | 100.0% |
Table 4: Furniture Type Leadership and Market Growth for the Small Space Furniture Market (segment and CAGR percentage), 2026 to 2036
| Metric | Value |
|---|---|
| Global CAGR (2026 to 2036) | 6.2% |
| Leading Segment | Seating |
Seating holds an estimated 36% of furniture type sales in 2026 because one sofa often serves as living room, guest bed and workspace in a one-bedroom unit. Of the 484,000 US multifamily units completed in 2025, 42% had one bedroom.[1] The main room therefore carries most daytime use. Upholstered sleeper ranges overlap with FMI's bedroom furniture coverage. Convertible seating will keep the lead as one-bedroom supply grows.
- Seating stays the entry purchase for single-room living in 2026.
- Mechanism life and mattress quality decide repeat purchase in sofa beds.
What keeps wood the leading material?
Wood holds an estimated 46% of material sales in 2026, as engineered and solid wood cabinets carry wall-bed mechanisms and extending table leaves at mass-market prices.
Table 5: Material Share for the Small Space Furniture Market (percentage share), 2026
| Material | Estimated Share (2026) |
|---|---|
| Wood (Solid and Engineered) | 46% |
| Metal | 22% |
| Plastic | 14% |
| Glass | 7% |
| Others | 11% |
| Total | 100.0% |
Wood frames dominate wall-bed cabinets, drop-leaf tables and storage units sold for compact homes. Duties of 10% on softwood lumber and 25% on certain imported furniture remain in effect in the US.[8] Input costs for US producers will rise, and mass brands may move further toward engineered panels. FMI's wooden furniture analysis covers the wider category.
- Engineered wood keeps wall-bed and storage pieces within renter budgets.
- Hinge and gas-strut hardware ratings matter more than panel finish in convertible units.
Why do residential buyers lead end use?
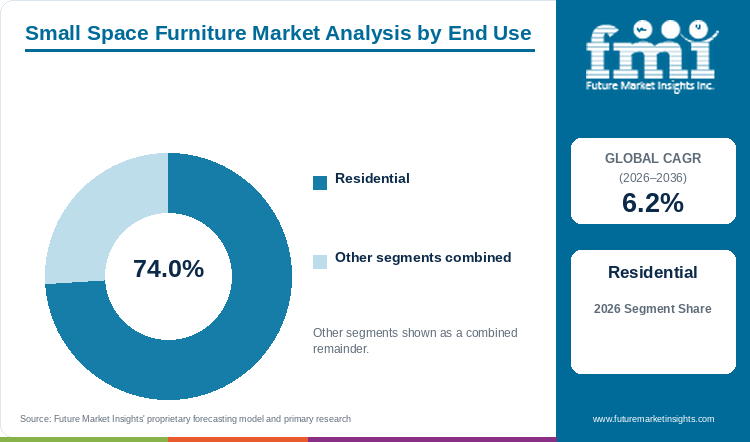
Residential buyers hold an estimated 74% of end use sales in 2026, driven by one-person households and renters furnishing smaller units.
Table 6: End Use Share for the Small Space Furniture Market (percentage share), 2026
| End Use | Estimated Share (2026) |
|---|---|
| Residential | 74% |
| Commercial | 26% |
| Total | 100.0% |
One-person living is the strongest residential signal. The UK had 8.6 million people living alone in 2025, 29.5% of households,[3] and South Korea's one-person share reached 36.6% in the same year.[4] Commercial demand comes from rental buildings. Ori installs robotic bed and closet systems for developers and markets 300 square foot studios with the function of 500 square feet.[7]
- Bedroom and living room pieces lead residential demand.
- Developer-specified furniture links commercial demand to new rental completions.
How is the distribution channel split developing?
Offline channels hold an estimated 58% of distribution channel sales in 2026 and online channels 42%, and both grow in compact furniture.
Table 7: Distribution Channel Share for the Small Space Furniture Market (percentage share), 2026
| Distribution Channel | Estimated Share (2026) |
|---|---|
| Offline Channels | 58% |
| Online Channels | 42% |
| Total | 100.0% |
Online platforms gained ground in 2026, with Wayfair reporting second-quarter revenue of USD 3.5 billion, up 7.5%.[6] IKEA said in February 2026 that 10 US stores will open in 2026, including a city-centre site in Los Angeles.[5] Store formats will keep moving closer to dense housing.
- Online channels suit flat-packed compact pieces that ship in cartons.
- Showrooms keep a role for wall beds and transforming tables that buyers want to test.
What are the drivers, restraints, and opportunities in the Small Space Furniture Market?
In the small space furniture market, shrinking rental units and one-person households drive purchases, furniture tariffs and buyer doubts over convertible durability hold back sales, and developer-supplied furniture in new rental buildings opens the principal commercial opportunity.
- Driver: Smaller new rental units and the rise of one-person households.
- Restraint: Import duties on furniture and lumber, and buyer concern over mechanism life.
- Opportunity: Furniture supplied with the apartment by developers and operators.
Smaller units and solo households
New US rental units completed in 2025 had a median of 1,000 square feet.[1] Japan's households grew 2.3% between 2020 and 2025 and population shrank.[9] Each additional small household buys a compact bed, seating and storage set. Part of this overlaps with FMI's modular furniture analysis.
Tariffs and durability concerns
Duties of 25% on certain imported furniture and 10% on softwood lumber remain in effect in the US, and Ashley said in March 2026 that manufacturing at the Mesquite, Texas facility would conclude on May 7, 2026.[8] Convertible pieces carry hinges, gas struts and motors that wear with daily use. Repair cost will lead some renters to choose standard furniture.
Developer-supplied furniture
Ori lists Greystar, Lincoln Property Company and Related Companies as developer partners and is launching 100% Ori buildings in 2026.[7] Developer supply reaches renters before move-in. Flexible workspace at home adds to this need, a demand covered in FMI's home office furniture analysis.
Which country CAGRs are profiled in the Small Space Furniture Market?
Table 8: Country CAGR Comparison for the Small Space Furniture Market (CAGR percentage), 2026 to 2036
| Country | CAGR |
|---|---|
| United States | 6.2% |
| South Korea | 6.1% |
| European Union | 6.0% |
| Japan | 5.9% |
| United Kingdom | 5.8% |
How do country-level CAGRs compare in the Small Space Furniture Market?
The five profiled geographies fall within 0.4 percentage points of each other. Large rental pipelines and fast household formation mark the top of the range, and mature, already compact housing marks the bottom. As per the analysis from FMI, the United States (6.2%) and South Korea (6.1%) lead, the European Union records 6.0%, and Japan (5.9%) and the United Kingdom (5.8%) follow.
- United States: rental completions and record renter cost burdens.
- South Korea: one-person households above a third of the total.
- European Union: compact housing in dense cities across member states.
- Japan: more households on a shrinking population and a dense Tokyo base.
- United Kingdom: a large share of one-person households.
Full report country CAGRs cover: North America; Latin America; Western Europe; Eastern Europe; East Asia; South Asia and Pacific; Middle East and Africa.
Country-wise Analysis
- The United States heads the profiled set at 6.2% CAGR from 2026 to 2036. The median rental unit completed in 2025 measured 1,000 square feet.[1] A record 22.7 million renter households were cost-burdened in 2024.[2] IKEA plans 10 new US stores in 2026, including a city-centre location in Los Angeles.[5] Wayfair's US revenue rose 8.7% in the second quarter of 2026.[6]
- South Korea follows at 6.1% CAGR. One-person households reached 36.6% of the total in 2025, and apartments made up 65.8% of homes.[4]
- The European Union is projected at 6.0% CAGR from 2026 to 2036, with demand centred on dense city housing across member states.
- Japan records 5.9% CAGR. Households rose 2.3% between 2020 and 2025 even as population fell, and Tokyo-to held 14.2 million people.[9] Nitori ran 860 stores in Japan at March 2026 and plans 1,212 stores group-wide by March 2027.[10]
- The United Kingdom records 5.8% CAGR. The UK had 8.6 million people living alone in 2025, 29.5% of households.[3]
Who are the notable companies in the Small Space Furniture Market?
Notable companies in the small space furniture market include IKEA (Ingka Group), Ashley Furniture, Wayfair, La-Z-Boy, Williams-Sonoma (West Elm), Nitori Holdings, Dorel Home (Dorel Industries), Resource Furniture, Expand Furniture, and Ori.
Mass home furnishing retailers set price points for compact ranges. Manufacturers and online platforms supply volume. A smaller group of specialists sells wall beds, transforming tables and robotic systems at premium prices. Results in the year to mid-2026 were mixed. Wayfair's second-quarter net revenue rose 7.5% in 2026,[6] and Nitori revenue fell 1.8% in the year to March 2026 even as operating profit rose 6.7%.[10]
- Mass home furnishing retailers: IKEA (Ingka Group), Nitori Holdings, Williams-Sonoma (West Elm).
- Manufacturers and online platforms: Ashley Furniture, La-Z-Boy, Wayfair, Dorel Home (Dorel Industries).
- Transforming furniture specialists: Resource Furniture, Expand Furniture, Ori.
Competitive Benchmarking: Small Space Furniture Market
Table 9: Competitive Benchmarking for the Small Space Furniture Market (qualitative capability ratings), 2026
| Company | Convertible Range | Compact Retail and Online Access | Developer and Project Supply | Reach |
|---|---|---|---|---|
| IKEA (Ingka Group) | Medium | High | Low | High |
| Ashley Furniture | Low | Medium | Low | High |
| Wayfair | Low | High | Low | High |
| La-Z-Boy | Low | Medium | Low | Medium |
| Williams-Sonoma (West Elm) | Low | Medium | Low | High |
| Nitori Holdings | Low | High | Low | High |
| Dorel Home (Dorel Industries) | Low | Medium | Low | Medium |
| Resource Furniture | High | Medium | Medium | Medium |
| Expand Furniture | High | Medium | Medium | Medium |
| Ori | High | Low | High | Medium |
Ratings: High = wide public documentation, Medium = moderate public documentation, Low = limited public documentation.
Key Developments in the Small Space Furniture Market
- In August 2026, Wayfair posted USD 3.5 billion in net revenue for the April to June quarter, a 7.5% gain, with US net revenue up 8.7%.[6]
- In May 2026, Nitori Holdings reported 1,069 stores at March 2026 and set a target of 1,212 stores by March 2027.[10]
- In March 2026, Ashley said manufacturing at the Mesquite, Texas facility would conclude on May 7, 2026.[8]
- In February 2026, IKEA announced 10 new US stores for 2026, including a city-centre store in Los Angeles.[5]
Key Players in the Small Space Furniture Market
Mass Home Furnishing Retailers
- IKEA (Ingka Group)
- Nitori Holdings
- Williams-Sonoma (West Elm)
Manufacturers and Online Platforms
- Ashley Furniture
- La-Z-Boy
- Wayfair
- Dorel Home (Dorel Industries)
Transforming Furniture Specialists
- Resource Furniture
- Expand Furniture
- Ori
Small Space Furniture Market - Report Scope
Table 10: Report Scope for the Small Space Furniture Market (coverage fields and definitions), 2026 to 2036
| Coverage field | Report scope |
|---|---|
| Market breakdown | Furniture type; material; end use; distribution channel; region |
| Quantitative units | USD million |
| Market definition | Sales of furniture designed or sized for compact interiors, including multifunctional, convertible, folding, nesting, stackable, wall-mounted, modular and compact-footprint pieces such as wall beds, sofa beds, storage beds, drop-leaf and extending tables, nesting tables, folding chairs, compact sectionals and vertical storage, sold to households and commercial buyers through offline and online channels. Excludes full-size standard furniture without space-saving design, built-in joinery and kitchen cabinetry installed during construction, furniture rental and subscription income, and office systems furniture. |
| Regions covered | North America; Latin America; Western Europe; Eastern Europe; East Asia; South Asia and Pacific; Middle East and Africa |
| Countries covered | United States; South Korea; European Union; Japan; United Kingdom |
| Key companies profiled | IKEA (Ingka Group); Ashley Furniture; Wayfair; La-Z-Boy; Williams-Sonoma (West Elm); Nitori Holdings; Dorel Home (Dorel Industries); Resource Furniture; Expand Furniture; Ori |
| Forecast period | 2026 to 2036 |
| Approach | Hybrid bottom-up and top-down sizing that reconciles compact household formation and furniture purchases per household with retailer and manufacturer sales within the defined scope. |
Small Space Furniture Market - Research Methodology
Table 11: Research Methodology for the Small Space Furniture Market (research methods and approach), 2026 edition
| Method | Approach |
|---|---|
| Primary Research | Interviews with furniture manufacturers, retailers, online marketplaces, multifamily developers and interior planners. |
| Desk Research | Company results, national housing and household statistics, housing affordability data and trade press. |
| Market Sizing and Forecasting | Household formation, unit size and furniture purchases by country, reconciled with company results and store and online channel data. |
| Data Validation | Triangulation of primary inputs, company disclosures and official statistics, with review of outliers by the analyst team. |
Small Space Furniture Market by Segments
Small Space Furniture Market segmented by Furniture Type:
- Seating (Chairs, Sofas and Sofa Beds)
- Tables and Desks
- Beds (Wall Beds, Storage Beds, Bunk and Loft Beds)
- Storage (Cupboards, Cabinets and Shelving)
- Others
Small Space Furniture Market segmented by Material:
- Wood (Solid and Engineered)
- Metal
- Plastic
- Glass
- Others
Small Space Furniture Market segmented by End Use:
- Residential
-
Commercial
Small Space Furniture Market segmented by Distribution Channel:
- Offline Channels
- Online Channels
Small Space Furniture Market by Region
- North America
- United States
- Canada
- Latin America
- Brazil
- Mexico
- Argentina
- Chile
- Western Europe
- Germany
- France
- United Kingdom
- Italy
- Spain
- Benelux
- Nordics
- Eastern Europe
- Poland
- Czech Republic
- Romania
- Hungary
- East Asia
- China
- Japan
- South Korea
- South Asia and Pacific
- India
- ASEAN
- Australia and New Zealand
- Middle East and Africa
- GCC Countries
- South Africa
- Türkiye
- Israel
Research Sources and Bibliography
- [1] U.S. Census Bureau. (n.d.). Highlights of 2025 Characteristics of New Housing. https://www.census.gov/construction/chars/highlights.html
- [2] National Low Income Housing Coalition. (2026, July 13). JCHS's 2026 State of the Nation's Housing Report Finds Cost Burdens for Renters Continue to Rise Amid Cooling Demand and Housing Market Uncertainty. https://nlihc.org/resource/jchss-2026-state-nations-housing-report-finds-cost-burdens-renters-continue-rise-amid
- [3] Office for National Statistics. (2026, April 17). Families and households in the UK: 2025. https://www.ons.gov.uk/peoplepopulationandcommunity/birthsdeathsandmarriages/families/bulletins/familiesandhouseholds/2025
- [4] The Korea Herald. (2026, July 28). S. Korea's population slightly up in 2025 on immigration: census. https://www.koreaherald.com/article/10823097
- [5] Retail Dive. (2026, February 18). Ikea to open 10 US stores this year. https://www.retaildive.com/news/ikea-open-10-us-stores/812435/
- [6] Wayfair Inc. (2026, August 4). Wayfair Announces Second Quarter 2026 Results, Reports Strongest Free Cash Flow Since 2020. https://www.sec.gov/Archives/edgar/data/0001616707/000161670726000147/a2026-08x04ex991.htm
- [7] Ori. (n.d.). Ori Expandable Apartments. https://oriliving.com/
- [8] FOX 26 Houston. (2026, March 19). World's largest furniture maker cuts hundreds of jobs amid major restructuring. https://www.fox26houston.com/news/worlds-largest-furniture-maker-cuts-hundreds-jobs-amid-major-restructuring
- [9] Statistics Bureau of Japan. (2026, June 25). News Bulletin June 25, 2026. https://www.stat.go.jp/english/info/news/20260625.html
- [10] Nitori Holdings Co., Ltd. (2026, May 14). Financial Results Presentation for the FY2025. https://www.marketscreener.com/news/nitori-e-ae--ce7f5bddd88af42c
This bibliography is provided for reader reference. The full report contains the complete reference list and detailed citations.
This Report Answers
- How big is the small space furniture market during 2026?
- What market size is projected by 2036?
- Which furniture type holds notable share?
- Which material holds notable share?
- Which countries have notable growth?
- Which companies are notable in the market?
Table of Content
Table of Content
- Key Takeaways
- Market Size and CAGR
- Top Growth Driver
- Fastest Growing Segment
- Leading Region
- Key Companies
- Emerging Opportunities
- Executive Summary
- Global Market Outlook
- Demand-side Trends
- Supply-side Trends
- Technology Roadmap Analysis
- Analysis and Recommendations
- Analyst Perspective (What is happening? Why now? What should investors know?)
- Key Questions Answered
- How large is the market?
- What is the CAGR?
- What are key trends?
- Which region dominates?
- Who are the leaders?
Read More...
- Market Overview
- Market Coverage / Taxonomy
- Market Definition / Scope / Limitations
- Research Methodology
- Chapter Orientation
- Analytical Lens and Working Hypotheses
- Market Structure, Signals, and Trend Drivers
- Benchmarking and Cross-market Comparability
- Market Sizing, Forecasting, and Opportunity Mapping
- Research Design and Evidence Framework
- Desk Research Programme (Secondary Evidence)
- Expert Input and Fieldwork (Primary Evidence)
- Tooling, Models, and Reference Databases
- Data Engineering and Model Build
- Quality Assurance and Audit Trail
- Market Background
- Market Dynamics (Drivers, Restraints, Opportunity, Trends)
- Scenario Forecast (Optimistic, Likely, Conservative)
- Impact Analysis
- AI Impact
- Sustainability Impact
- Regulatory Impact
- Technology Impact
- Consumer / Buyer Analysis
- Purchase Drivers
- Adoption Barriers
- Buyer Journey
- Opportunity Map Analysis
- Product Life Cycle Analysis
- Supply Chain Analysis
- Investment Feasibility Matrix
- Value Chain Analysis
- PESTLE and Porter's Analysis
- Regulatory Landscape
- Regional Parent Market Outlook
- Production and Consumption Statistics
- Import and Export Statistics
- Global Market Analysis and Forecast, 2021 to 2036
- Historical Market Size Value (USD Million) Analysis, 2021 to 2025
- Current and Future Market Size Value (USD Million) Projections, 2026 to 2036
- Y-o-Y Growth Trend Analysis
- Absolute $ Opportunity Analysis
- Global Market Pricing Analysis, 2021 to 2036
- Global Market Analysis and Forecast, By Furniture Type, 2021 to 2036
- Introduction / Key Findings
- Historical Market Size Value (USD Million) Analysis By Furniture Type, 2021 to 2025
- Current and Future Market Size Value (USD Million) Analysis and Forecast By Furniture Type, 2026 to 2036
- Seating (Chairs, Sofas and Sofa Beds)
- Tables and Desks
- Beds (Wall Beds, Storage Beds, Bunk and Loft Beds)
- Storage (Cupboards, Cabinets and Shelving)
- Others
- Y-o-Y Growth Trend Analysis By Furniture Type, 2021 to 2025
- Absolute $ Opportunity Analysis By Furniture Type, 2026 to 2036
- Global Market Analysis and Forecast, By Material, 2021 to 2036
- Introduction / Key Findings
- Historical Market Size Value (USD Million) Analysis By Material, 2021 to 2025
- Current and Future Market Size Value (USD Million) Analysis and Forecast By Material, 2026 to 2036
- Wood (Solid and Engineered)
- Metal
- Plastic
- Glass
- Others
- Y-o-Y Growth Trend Analysis By Material, 2021 to 2025
- Absolute $ Opportunity Analysis By Material, 2026 to 2036
- Global Market Analysis and Forecast, By End Use, 2021 to 2036
- Introduction / Key Findings
- Historical Market Size Value (USD Million) Analysis By End Use, 2021 to 2025
- Current and Future Market Size Value (USD Million) Analysis and Forecast By End Use, 2026 to 2036
- Residential
- Commercial
- Y-o-Y Growth Trend Analysis By End Use, 2021 to 2025
- Absolute $ Opportunity Analysis By End Use, 2026 to 2036
- Global Market Analysis and Forecast, By Distribution Channel, 2021 to 2036
- Introduction / Key Findings
- Historical Market Size Value (USD Million) Analysis By Distribution Channel, 2021 to 2025
- Current and Future Market Size Value (USD Million) Analysis and Forecast By Distribution Channel, 2026 to 2036
- Offline Channels
- Online Channels
- Y-o-Y Growth Trend Analysis By Distribution Channel, 2021 to 2025
- Absolute $ Opportunity Analysis By Distribution Channel, 2026 to 2036
- Global Market Analysis and Forecast, By Region, 2021 to 2036
- Introduction
- Historical Market Size Value (USD Million) Analysis By Region, 2021 to 2025
- Current Market Size Value (USD Million) Analysis and Forecast By Region, 2026 to 2036
- North America
- Latin America
- Western Europe
- Eastern Europe
- East Asia
- South Asia and Pacific
- Middle East and Africa
- Market Attractiveness Analysis By Region
- North America Market Analysis and Forecast, By Country, 2021 to 2036
- Historical Market Size Value (USD Million) Trend Analysis By Market Taxonomy, 2021 to 2025
- Market Size Value (USD Million) Forecast By Market Taxonomy, 2026 to 2036
- By Country
- United States
- Canada
- By Furniture Type
- By Material
- By End Use
- By Distribution Channel
- By Country
- Market Attractiveness Analysis
- By Country
- By Furniture Type
- By Material
- By End Use
- By Distribution Channel
- Key Takeaways
- Latin America Market Analysis and Forecast, By Country
- Historical Market Size Value (USD Million) Trend Analysis By Market Taxonomy, 2021 to 2025
- Market Size Value (USD Million) Forecast By Market Taxonomy, 2026 to 2036
- By Country
- Brazil
- Mexico
- Argentina
- Chile
- By Furniture Type
- By Material
- By End Use
- By Distribution Channel
- By Country
- Market Attractiveness Analysis
- By Country
- By Furniture Type
- By Material
- By End Use
- By Distribution Channel
- Key Takeaways
- Western Europe Market Analysis and Forecast, By Country
- Historical Market Size Value (USD Million) Trend Analysis By Market Taxonomy, 2021 to 2025
- Market Size Value (USD Million) Forecast By Market Taxonomy, 2026 to 2036
- By Country
- Germany
- France
- United Kingdom
- Italy
- Spain
- Benelux
- Nordics
- By Furniture Type
- By Material
- By End Use
- By Distribution Channel
- By Country
- Market Attractiveness Analysis
- By Country
- By Furniture Type
- By Material
- By End Use
- By Distribution Channel
- Key Takeaways
- Eastern Europe Market Analysis and Forecast, By Country
- Historical Market Size Value (USD Million) Trend Analysis By Market Taxonomy, 2021 to 2025
- Market Size Value (USD Million) Forecast By Market Taxonomy, 2026 to 2036
- By Country
- Poland
- Czech Republic
- Romania
- Hungary
- By Furniture Type
- By Material
- By End Use
- By Distribution Channel
- By Country
- Market Attractiveness Analysis
- By Country
- By Furniture Type
- By Material
- By End Use
- By Distribution Channel
- Key Takeaways
- East Asia Market Analysis and Forecast, By Country
- Historical Market Size Value (USD Million) Trend Analysis By Market Taxonomy, 2021 to 2025
- Market Size Value (USD Million) Forecast By Market Taxonomy, 2026 to 2036
- By Country
- China
- Japan
- South Korea
- By Furniture Type
- By Material
- By End Use
- By Distribution Channel
- By Country
- Market Attractiveness Analysis
- By Country
- By Furniture Type
- By Material
- By End Use
- By Distribution Channel
- Key Takeaways
- South Asia and Pacific Market Analysis and Forecast, By Country
- Historical Market Size Value (USD Million) Trend Analysis By Market Taxonomy, 2021 to 2025
- Market Size Value (USD Million) Forecast By Market Taxonomy, 2026 to 2036
- By Country
- India
- ASEAN
- Australia and New Zealand
- By Furniture Type
- By Material
- By End Use
- By Distribution Channel
- By Country
- Market Attractiveness Analysis
- By Country
- By Furniture Type
- By Material
- By End Use
- By Distribution Channel
- Key Takeaways
- Middle East and Africa Market Analysis and Forecast, By Country
- Historical Market Size Value (USD Million) Trend Analysis By Market Taxonomy, 2021 to 2025
- Market Size Value (USD Million) Forecast By Market Taxonomy, 2026 to 2036
- By Country
- GCC Countries
- South Africa
- Türkiye
- Israel
- By Furniture Type
- By Material
- By End Use
- By Distribution Channel
- By Country
- Market Attractiveness Analysis
- By Country
- By Furniture Type
- By Material
- By End Use
- By Distribution Channel
- Key Takeaways
- Key Countries Market Analysis
- United States
- Pricing Analysis
- Market Share Analysis, 2025
- By Furniture Type
- By Material
- By End Use
- By Distribution Channel
- Canada
- Pricing Analysis
- Market Share Analysis, 2025
- By Furniture Type
- By Material
- By End Use
- By Distribution Channel
- Mexico
- Pricing Analysis
- Market Share Analysis, 2025
- By Furniture Type
- By Material
- By End Use
- By Distribution Channel
- Brazil
- Pricing Analysis
- Market Share Analysis, 2025
- By Furniture Type
- By Material
- By End Use
- By Distribution Channel
- Chile
- Pricing Analysis
- Market Share Analysis, 2025
- By Furniture Type
- By Material
- By End Use
- By Distribution Channel
- Germany
- Pricing Analysis
- Market Share Analysis, 2025
- By Furniture Type
- By Material
- By End Use
- By Distribution Channel
- United Kingdom
- Pricing Analysis
- Market Share Analysis, 2025
- By Furniture Type
- By Material
- By End Use
- By Distribution Channel
- Italy
- Pricing Analysis
- Market Share Analysis, 2025
- By Furniture Type
- By Material
- By End Use
- By Distribution Channel
- Spain
- Pricing Analysis
- Market Share Analysis, 2025
- By Furniture Type
- By Material
- By End Use
- By Distribution Channel
- France
- Pricing Analysis
- Market Share Analysis, 2025
- By Furniture Type
- By Material
- By End Use
- By Distribution Channel
- India
- Pricing Analysis
- Market Share Analysis, 2025
- By Furniture Type
- By Material
- By End Use
- By Distribution Channel
- ASEAN
- Pricing Analysis
- Market Share Analysis, 2025
- By Furniture Type
- By Material
- By End Use
- By Distribution Channel
- Australia and New Zealand
- Pricing Analysis
- Market Share Analysis, 2025
- By Furniture Type
- By Material
- By End Use
- By Distribution Channel
- China
- Pricing Analysis
- Market Share Analysis, 2025
- By Furniture Type
- By Material
- By End Use
- By Distribution Channel
- Japan
- Pricing Analysis
- Market Share Analysis, 2025
- By Furniture Type
- By Material
- By End Use
- By Distribution Channel
- South Korea
- Pricing Analysis
- Market Share Analysis, 2025
- By Furniture Type
- By Material
- By End Use
- By Distribution Channel
- Poland
- Pricing Analysis
- Market Share Analysis, 2025
- By Furniture Type
- By Material
- By End Use
- By Distribution Channel
- Hungary
- Pricing Analysis
- Market Share Analysis, 2025
- By Furniture Type
- By Material
- By End Use
- By Distribution Channel
- Türkiye
- Pricing Analysis
- Market Share Analysis, 2025
- By Furniture Type
- By Material
- By End Use
- By Distribution Channel
- South Africa
- Pricing Analysis
- Market Share Analysis, 2025
- By Furniture Type
- By Material
- By End Use
- By Distribution Channel
- European Union
- Pricing Analysis
- Market Share Analysis, 2025
- By Furniture Type
- By Material
- By End Use
- By Distribution Channel
- United States
- Market Structure Analysis
- Competition Dashboard
- Competition Benchmarking
- Market Share Analysis of Top Players
- By Regional
- By Furniture Type
- By Material
- By End Use
- By Distribution Channel
- Emerging Startups
- Innovation Benchmarking
- Competition Analysis
- Competition Deep Dive
- IKEA (Ingka Group)
- Overview
- Product Portfolio
- Profitability by Market Segments
- Sales Footprint
- Strategy Overview
- Marketing Strategy
- Product Strategy
- Channel Strategy
- Ashley Furniture
- Wayfair
- La-Z-Boy
- Williams-Sonoma (West Elm)
- Nitori Holdings
- Dorel Home (Dorel Industries)
- Resource Furniture
- Expand Furniture
- Ori
- IKEA (Ingka Group)
- Case Studies
- Success Stories
- Recent Developments
- Competition Deep Dive
- Assumptions & Acronyms Used
List of Tables
- Table 1: Global Market Value (USD Million) Forecast by Region, 2021 to 2036
- Table 2: Global Market Value (USD Million) Forecast by Furniture Type, 2021 to 2036
- Table 3: Global Market Value (USD Million) Forecast by Material, 2021 to 2036
- Table 4: Global Market Value (USD Million) Forecast by End Use, 2021 to 2036
- Table 5: Global Market Value (USD Million) Forecast by Distribution Channel, 2021 to 2036
- Table 6: North America Market Value (USD Million) Forecast by Country, 2021 to 2036
- Table 7: North America Market Value (USD Million) Forecast by Furniture Type, 2021 to 2036
- Table 8: North America Market Value (USD Million) Forecast by Material, 2021 to 2036
- Table 9: North America Market Value (USD Million) Forecast by End Use, 2021 to 2036
- Table 10: North America Market Value (USD Million) Forecast by Distribution Channel, 2021 to 2036
- Table 11: Latin America Market Value (USD Million) Forecast by Country, 2021 to 2036
- Table 12: Latin America Market Value (USD Million) Forecast by Furniture Type, 2021 to 2036
- Table 13: Latin America Market Value (USD Million) Forecast by Material, 2021 to 2036
- Table 14: Latin America Market Value (USD Million) Forecast by End Use, 2021 to 2036
- Table 15: Latin America Market Value (USD Million) Forecast by Distribution Channel, 2021 to 2036
- Table 16: Western Europe Market Value (USD Million) Forecast by Country, 2021 to 2036
- Table 17: Western Europe Market Value (USD Million) Forecast by Furniture Type, 2021 to 2036
- Table 18: Western Europe Market Value (USD Million) Forecast by Material, 2021 to 2036
- Table 19: Western Europe Market Value (USD Million) Forecast by End Use, 2021 to 2036
- Table 20: Western Europe Market Value (USD Million) Forecast by Distribution Channel, 2021 to 2036
- Table 21: Eastern Europe Market Value (USD Million) Forecast by Country, 2021 to 2036
- Table 22: Eastern Europe Market Value (USD Million) Forecast by Furniture Type, 2021 to 2036
- Table 23: Eastern Europe Market Value (USD Million) Forecast by Material, 2021 to 2036
- Table 24: Eastern Europe Market Value (USD Million) Forecast by End Use, 2021 to 2036
- Table 25: Eastern Europe Market Value (USD Million) Forecast by Distribution Channel, 2021 to 2036
- Table 26: East Asia Market Value (USD Million) Forecast by Country, 2021 to 2036
- Table 27: East Asia Market Value (USD Million) Forecast by Furniture Type, 2021 to 2036
- Table 28: East Asia Market Value (USD Million) Forecast by Material, 2021 to 2036
- Table 29: East Asia Market Value (USD Million) Forecast by End Use, 2021 to 2036
- Table 30: East Asia Market Value (USD Million) Forecast by Distribution Channel, 2021 to 2036
- Table 31: South Asia and Pacific Market Value (USD Million) Forecast by Country, 2021 to 2036
- Table 32: South Asia and Pacific Market Value (USD Million) Forecast by Furniture Type, 2021 to 2036
- Table 33: South Asia and Pacific Market Value (USD Million) Forecast by Material, 2021 to 2036
- Table 34: South Asia and Pacific Market Value (USD Million) Forecast by End Use, 2021 to 2036
- Table 35: South Asia and Pacific Market Value (USD Million) Forecast by Distribution Channel, 2021 to 2036
- Table 36: Middle East and Africa Market Value (USD Million) Forecast by Country, 2021 to 2036
- Table 37: Middle East and Africa Market Value (USD Million) Forecast by Furniture Type, 2021 to 2036
- Table 38: Middle East and Africa Market Value (USD Million) Forecast by Material, 2021 to 2036
- Table 39: Middle East and Africa Market Value (USD Million) Forecast by End Use, 2021 to 2036
- Table 40: Middle East and Africa Market Value (USD Million) Forecast by Distribution Channel, 2021 to 2036
List of Figures
- Figure 1: Global Market Pricing Analysis
- Figure 2: Global Market Value (USD Million) Forecast 2021-2036
- Figure 3: Global Market Value Share and BPS Analysis by Furniture Type, 2026 and 2036
- Figure 4: Global Market Y-o-Y Growth Comparison by Furniture Type, 2026-2036
- Figure 5: Global Market Attractiveness Analysis by Furniture Type
- Figure 6: Global Market Value Share and BPS Analysis by Material, 2026 and 2036
- Figure 7: Global Market Y-o-Y Growth Comparison by Material, 2026-2036
- Figure 8: Global Market Attractiveness Analysis by Material
- Figure 9: Global Market Value Share and BPS Analysis by End Use, 2026 and 2036
- Figure 10: Global Market Y-o-Y Growth Comparison by End Use, 2026-2036
- Figure 11: Global Market Attractiveness Analysis by End Use
- Figure 12: Global Market Value Share and BPS Analysis by Distribution Channel, 2026 and 2036
- Figure 13: Global Market Y-o-Y Growth Comparison by Distribution Channel, 2026-2036
- Figure 14: Global Market Attractiveness Analysis by Distribution Channel
- Figure 15: Global Market Value (USD Million) Share and BPS Analysis by Region, 2026 and 2036
- Figure 16: Global Market Y-o-Y Growth Comparison by Region, 2026-2036
- Figure 17: Global Market Attractiveness Analysis by Region
- Figure 18: North America Market Incremental Dollar Opportunity, 2026-2036
- Figure 19: Latin America Market Incremental Dollar Opportunity, 2026-2036
- Figure 20: Western Europe Market Incremental Dollar Opportunity, 2026-2036
- Figure 21: Eastern Europe Market Incremental Dollar Opportunity, 2026-2036
- Figure 22: East Asia Market Incremental Dollar Opportunity, 2026-2036
- Figure 23: South Asia and Pacific Market Incremental Dollar Opportunity, 2026-2036
- Figure 24: Middle East and Africa Market Incremental Dollar Opportunity, 2026-2036
- Figure 25: North America Market Value Share and BPS Analysis by Country, 2026 and 2036
- Figure 26: North America Market Value Share and BPS Analysis by Furniture Type, 2026 and 2036
- Figure 27: North America Market Y-o-Y Growth Comparison by Furniture Type, 2026-2036
- Figure 28: North America Market Attractiveness Analysis by Furniture Type
- Figure 29: North America Market Value Share and BPS Analysis by Material, 2026 and 2036
- Figure 30: North America Market Y-o-Y Growth Comparison by Material, 2026-2036
- Figure 31: North America Market Attractiveness Analysis by Material
- Figure 32: North America Market Value Share and BPS Analysis by End Use, 2026 and 2036
- Figure 33: North America Market Y-o-Y Growth Comparison by End Use, 2026-2036
- Figure 34: North America Market Attractiveness Analysis by End Use
- Figure 35: North America Market Value Share and BPS Analysis by Distribution Channel, 2026 and 2036
- Figure 36: North America Market Y-o-Y Growth Comparison by Distribution Channel, 2026-2036
- Figure 37: North America Market Attractiveness Analysis by Distribution Channel
- Figure 38: Latin America Market Value Share and BPS Analysis by Country, 2026 and 2036
- Figure 39: Latin America Market Value Share and BPS Analysis by Furniture Type, 2026 and 2036
- Figure 40: Latin America Market Y-o-Y Growth Comparison by Furniture Type, 2026-2036
- Figure 41: Latin America Market Attractiveness Analysis by Furniture Type
- Figure 42: Latin America Market Value Share and BPS Analysis by Material, 2026 and 2036
- Figure 43: Latin America Market Y-o-Y Growth Comparison by Material, 2026-2036
- Figure 44: Latin America Market Attractiveness Analysis by Material
- Figure 45: Latin America Market Value Share and BPS Analysis by End Use, 2026 and 2036
- Figure 46: Latin America Market Y-o-Y Growth Comparison by End Use, 2026-2036
- Figure 47: Latin America Market Attractiveness Analysis by End Use
- Figure 48: Latin America Market Value Share and BPS Analysis by Distribution Channel, 2026 and 2036
- Figure 49: Latin America Market Y-o-Y Growth Comparison by Distribution Channel, 2026-2036
- Figure 50: Latin America Market Attractiveness Analysis by Distribution Channel
- Figure 51: Western Europe Market Value Share and BPS Analysis by Country, 2026 and 2036
- Figure 52: Western Europe Market Value Share and BPS Analysis by Furniture Type, 2026 and 2036
- Figure 53: Western Europe Market Y-o-Y Growth Comparison by Furniture Type, 2026-2036
- Figure 54: Western Europe Market Attractiveness Analysis by Furniture Type
- Figure 55: Western Europe Market Value Share and BPS Analysis by Material, 2026 and 2036
- Figure 56: Western Europe Market Y-o-Y Growth Comparison by Material, 2026-2036
- Figure 57: Western Europe Market Attractiveness Analysis by Material
- Figure 58: Western Europe Market Value Share and BPS Analysis by End Use, 2026 and 2036
- Figure 59: Western Europe Market Y-o-Y Growth Comparison by End Use, 2026-2036
- Figure 60: Western Europe Market Attractiveness Analysis by End Use
- Figure 61: Western Europe Market Value Share and BPS Analysis by Distribution Channel, 2026 and 2036
- Figure 62: Western Europe Market Y-o-Y Growth Comparison by Distribution Channel, 2026-2036
- Figure 63: Western Europe Market Attractiveness Analysis by Distribution Channel
- Figure 64: Eastern Europe Market Value Share and BPS Analysis by Country, 2026 and 2036
- Figure 65: Eastern Europe Market Value Share and BPS Analysis by Furniture Type, 2026 and 2036
- Figure 66: Eastern Europe Market Y-o-Y Growth Comparison by Furniture Type, 2026-2036
- Figure 67: Eastern Europe Market Attractiveness Analysis by Furniture Type
- Figure 68: Eastern Europe Market Value Share and BPS Analysis by Material, 2026 and 2036
- Figure 69: Eastern Europe Market Y-o-Y Growth Comparison by Material, 2026-2036
- Figure 70: Eastern Europe Market Attractiveness Analysis by Material
- Figure 71: Eastern Europe Market Value Share and BPS Analysis by End Use, 2026 and 2036
- Figure 72: Eastern Europe Market Y-o-Y Growth Comparison by End Use, 2026-2036
- Figure 73: Eastern Europe Market Attractiveness Analysis by End Use
- Figure 74: Eastern Europe Market Value Share and BPS Analysis by Distribution Channel, 2026 and 2036
- Figure 75: Eastern Europe Market Y-o-Y Growth Comparison by Distribution Channel, 2026-2036
- Figure 76: Eastern Europe Market Attractiveness Analysis by Distribution Channel
- Figure 77: East Asia Market Value Share and BPS Analysis by Country, 2026 and 2036
- Figure 78: East Asia Market Value Share and BPS Analysis by Furniture Type, 2026 and 2036
- Figure 79: East Asia Market Y-o-Y Growth Comparison by Furniture Type, 2026-2036
- Figure 80: East Asia Market Attractiveness Analysis by Furniture Type
- Figure 81: East Asia Market Value Share and BPS Analysis by Material, 2026 and 2036
- Figure 82: East Asia Market Y-o-Y Growth Comparison by Material, 2026-2036
- Figure 83: East Asia Market Attractiveness Analysis by Material
- Figure 84: East Asia Market Value Share and BPS Analysis by End Use, 2026 and 2036
- Figure 85: East Asia Market Y-o-Y Growth Comparison by End Use, 2026-2036
- Figure 86: East Asia Market Attractiveness Analysis by End Use
- Figure 87: East Asia Market Value Share and BPS Analysis by Distribution Channel, 2026 and 2036
- Figure 88: East Asia Market Y-o-Y Growth Comparison by Distribution Channel, 2026-2036
- Figure 89: East Asia Market Attractiveness Analysis by Distribution Channel
- Figure 90: South Asia and Pacific Market Value Share and BPS Analysis by Country, 2026 and 2036
- Figure 91: South Asia and Pacific Market Value Share and BPS Analysis by Furniture Type, 2026 and 2036
- Figure 92: South Asia and Pacific Market Y-o-Y Growth Comparison by Furniture Type, 2026-2036
- Figure 93: South Asia and Pacific Market Attractiveness Analysis by Furniture Type
- Figure 94: South Asia and Pacific Market Value Share and BPS Analysis by Material, 2026 and 2036
- Figure 95: South Asia and Pacific Market Y-o-Y Growth Comparison by Material, 2026-2036
- Figure 96: South Asia and Pacific Market Attractiveness Analysis by Material
- Figure 97: South Asia and Pacific Market Value Share and BPS Analysis by End Use, 2026 and 2036
- Figure 98: South Asia and Pacific Market Y-o-Y Growth Comparison by End Use, 2026-2036
- Figure 99: South Asia and Pacific Market Attractiveness Analysis by End Use
- Figure 100: South Asia and Pacific Market Value Share and BPS Analysis by Distribution Channel, 2026 and 2036
- Figure 101: South Asia and Pacific Market Y-o-Y Growth Comparison by Distribution Channel, 2026-2036
- Figure 102: South Asia and Pacific Market Attractiveness Analysis by Distribution Channel
- Figure 103: Middle East and Africa Market Value Share and BPS Analysis by Country, 2026 and 2036
- Figure 104: Middle East and Africa Market Value Share and BPS Analysis by Furniture Type, 2026 and 2036
- Figure 105: Middle East and Africa Market Y-o-Y Growth Comparison by Furniture Type, 2026-2036
- Figure 106: Middle East and Africa Market Attractiveness Analysis by Furniture Type
- Figure 107: Middle East and Africa Market Value Share and BPS Analysis by Material, 2026 and 2036
- Figure 108: Middle East and Africa Market Y-o-Y Growth Comparison by Material, 2026-2036
- Figure 109: Middle East and Africa Market Attractiveness Analysis by Material
- Figure 110: Middle East and Africa Market Value Share and BPS Analysis by End Use, 2026 and 2036
- Figure 111: Middle East and Africa Market Y-o-Y Growth Comparison by End Use, 2026-2036
- Figure 112: Middle East and Africa Market Attractiveness Analysis by End Use
- Figure 113: Middle East and Africa Market Value Share and BPS Analysis by Distribution Channel, 2026 and 2036
- Figure 114: Middle East and Africa Market Y-o-Y Growth Comparison by Distribution Channel, 2026-2036
- Figure 115: Middle East and Africa Market Attractiveness Analysis by Distribution Channel
- Figure 116: Global Market - Tier Structure Analysis
- Figure 117: Global Market - Company Share Analysis
Frequently Asked Questions
How large is the Small Space Furniture Market expected in 2026?
Future Market Insights estimates market size at USD 7,095 million in 2026. Market size is projected to reach USD 12,948 million by 2036.
What CAGR is projected for the Small Space Furniture Market through 2036?
As per FMI, sales of small space furniture will grow at a CAGR of 6.2% from 2026 to 2036. Smaller rental units and one-person households support the outlook.
Which furniture type holds a notable market share in 2026?
Seating, covering chairs, sofas and sofa beds, holds an estimated 36% of furniture type sales in 2026.
Which material holds a notable share in 2026?
Wood, in solid and engineered forms, leads by material, carrying most wall-bed cabinets, extending tables and storage units.
Which country has a notable expansion outlook through 2036?
The United States is projected to record the fastest growth at 6.2% CAGR from 2026 to 2036, according to FMI. The median new US rental unit measured 1,000 square feet in 2025.[1] South Korea follows at 6.1%.
Who are the key companies in the Small Space Furniture Market?
Notable companies include IKEA (Ingka Group), Ashley Furniture, Wayfair, La-Z-Boy, Williams-Sonoma (West Elm), Nitori Holdings, Dorel Home (Dorel Industries), Resource Furniture, Expand Furniture, and Ori.
Preview the report firsthand - request a free sample
Get SampleGet the brochure for pricing and purchase details.
Get PDF
