Small Gas Engine Market Outlook from 2024 to 2034

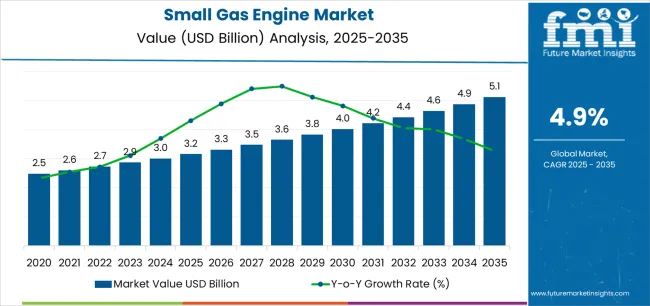
The small gas engine market is projected to be worth USD 3.0 billion in 2024. The market is anticipated to reach USD 5.0 billion by 2034. The market is further expected to surge at a CAGR of 5.2% during the forecast period 2024 to 2034.

Attributes Key Insights
Small Gas Engine Market Estimated Size in 2024 USD 3.0 billion
Projected Market Value in 2034 USD 5.0 billion
Value-based CAGR from 2024 to 2034 5.2%

Key Market Trends and Highlights

The growth of the construction industry, particularly in emerging economies, drives the demand for construction equipment powered by small gas engines, such as concrete mixers, pumps, and compactors.

  • The modernization and mechanization of the agriculture sector drive the demand for small gas engines used in various agricultural equipment, including tillers, sprayers, and pumps.
  • The rise of do-it-yourself culture, particularly in home maintenance and improvement projects, fuels the demand for handheld power tools such as trimmers, chainsaws, and leaf blowers, which are powered by small gas engines.
  • The increasing popularity of recreational activities such as camping, boating, and off-roading drives the demand for recreational vehicles equipped with small gas engines, including RV generators, boat engines, and ATV engines.

2019 to 2023 Historical Analysis vs. 2024 to 2034 Market Forecast Projections

The scope for small gas engine rose at a 6.9% CAGR between 2019 and 2023. The global market is anticipated to grow at a moderate CAGR of 5.2% over the forecast period 2024 to 2034.

The market experienced steady growth during the historical period, driven by factors such as increasing demand for outdoor power equipment, expansion of the landscaping and gardening services industry, technological advancements improving engine efficiency and emissions control, and the rising popularity of portable generators for residential and commercial use.

The market had also witnessed trends such as the integration of smart technologies into small gas powered equipment, a shift towards environmentally friendly engines to comply with emissions regulations, and expansion into emerging markets with growing infrastructure development and urbanization.

Forecast projections for the small gas engine market during the forecast period are anticipate continued growth fueled by several factors, including sustained demand for outdoor power equipment driven by landscaping services, urbanization, and infrastructure development.

Technological advancements are likely to play a significant role, with manufacturers focusing on developing cleaner, more fuel efficient engines and integrating smart features for improved performance and maintenance.

The market is also expected to witness increasing competition from electric powered alternatives, prompting small gas engine manufacturers to innovate and differentiate their products to maintain market share.

Small Gas Engine Market Key Drivers

The growing demand for outdoor power equipment such as lawnmowers, trimmers, chainsaws, and generators, which rely on small gas engines, is a significant driver of market growth.

  • The demand for small gas engines used in lawn mowers and landscaping equipment is expected to rise, as landscaping and gardening services continue to expand, particularly in urban and suburban areas.
  • There is a growing demand for portable generators powered by small gas engines, both for residential and commercial applications, with increasing instances of power outages due to natural disasters and aging power infrastructure.
  • Advancements in engine technology, including improvements in fuel efficiency, emissions reduction, and noise reduction, are driving market growth. Manufacturers are investing in research and development to produce more efficient and environmentally friendly small gas engines.

Challenges in the Small Gas Engine Market

Increasingly stringent emissions regulations, particularly in regions like Europe and North America, pose a challenge for small gas engine manufacturers. Compliance with emission standards requires investments in research and development to develop cleaner and more efficient engine technologies, which can increase production costs.

  • The rising popularity of electric powered outdoor equipment presents a significant challenge to the small gas engine market. Electric alternatives are perceived as more environmentally friendly and quieter, leading to consumer preferences shifting away from traditional gas powered equipment. The trend is expected to erode market share for small gas engines if manufacturers fail to innovate and compete effectively.
  • Environmental awareness and concerns about air and noise pollution are driving demand for greener alternatives to gas powered engines. Consumers, businesses, and regulatory bodies are increasingly prioritizing sustainability, which could dampen the demand for small gas engines in favor of cleaner technologies.
  • Fluctuations in fuel prices can impact the operating costs of small gas powered equipment. Higher fuel prices may discourage consumers and businesses from using gas powered equipment, leading to reduced demand for small gas engines.

Country-wise Insights

The below table showcases revenues in terms of the top 5 leading countries, spearheaded by Japan, and the United Kingdom. The countries are expected to lead the market through 2034.

Countries Forecast CAGRs from 2024 to 2034
The United States 5.5%
The United Kingdom 6.5%
China 5.9%
Japan 6.9%
Korea 3.2%

Demand for Outdoor Power Equipment Driving the Market in the United States

The small gas engine market in the United States expected to expand at a CAGR of 5.5% through 2034. The country has a large market for outdoor power equipment such as lawn mowers, trimmers, chainsaws, and leaf blowers, all of which rely on small gas engines. The demand for these products is driven by residential and commercial landscaping needs, as well as maintenance of parks, golf courses, and other outdoor spaces.

The high homeownership rate in the United States contributes to the demand for small gas powered equipment for lawn care and maintenance. Homeowners often invest in lawn mowers, trimmers, and other tools powered by small gas engines to maintain their properties.

Landscaping and Gardening Trends to Accelerate Market Growth in the United Kingdom

The small gas engine market in the United Kingdom is anticipated to expand at a CAGR of 6.5% through 2034. There is a significant demand for landscaping and gardening services in the United Kingdom.

Small gas powered equipment such as lawn mowers, trimmers, and leaf blowers are essential tools for maintaining gardens, parks, and outdoor spaces, driving demand for small gas engines.

The construction industry in the United Kingdom, both residential and commercial sectors, drives demand for small gas powered equipment used in construction activities. Tools such as portable generators, concrete mixers, and pressure washers are commonly powered by small gas engines and are essential for construction projects.

Agricultural Mechanization Spearhead the Market in China

Small gas engine trends in China are taking a turn for the better. A 5.9% CAGR is forecast for the country from 2024 to 2034. The agricultural sector in China is undergoing mechanization, with farmers increasingly adopting small gas powered equipment such as tillers, sprayers, and pumps. Small gas engines play a crucial role in modernizing agricultural practices and improving productivity.

China experiences frequent power outages, especially in rural areas, due to infrastructure limitations and weather related events. Portable generators powered by small gas engines provide backup power during emergencies, contributing to market growth.

Technological Advancements and Efficiency Improvements Fueling the Market in Japan

The small gas engine market in Japan is poised to expand at a CAGR of 6.9% through 2034. Japanese manufacturers are known for their innovation and focus on technological advancements.

Continuous improvements in engine design, fuel efficiency, and emission reduction contribute to the appeal of small gas engines in the Japanese market. Consumers are increasingly inclined towards eco friendly and energy efficient products, which drive the adoption of advanced small gas engines.

The Japanese government implements regulations and incentives to promote energy efficiency, reduce emissions, and encourage the adoption of environmentally friendly technologies. Compliance with these regulations drives innovation in small gas engine technology and encourages manufacturers to develop cleaner and more efficient engines, thereby boosting market growth.

Growth in Tourism Industry Driving the Demand in Korea

The small gas engine market in Korea is anticipated to expand at a CAGR of 3.2% through 2034. The tourism industry in Korea continues to grow, attracting domestic and international visitors to its diverse attractions and natural landscapes.

Small gas engines power equipment used in the tourism sector, including recreational vehicles, tour boats, and outdoor event equipment, contributing to market growth.

Infrastructure development projects in rural areas, including road construction, irrigation systems, and rural electrification, drive demand for small gas powered equipment. Portable generators, water pumps, and compactors are essential tools for these projects, stimulating market growth in rural regions.

Category-wise Insights

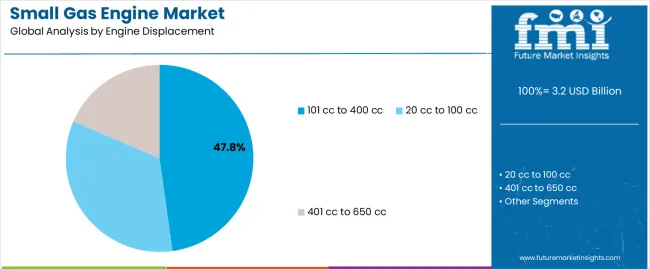
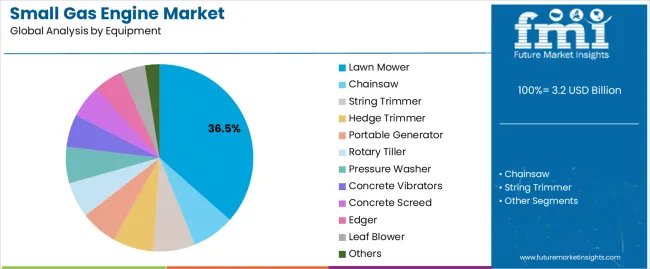
The below table highlights how 20 cc to 100 cc segment is projected to lead the market in terms of engine displacement, and is expected to account for a CAGR of 5.0% through 2034. Based on equipment, the lawn mower segment is expected to account for a CAGR of 4.7% through 2034.

Category CAGR through 2034
20 cc to 100 cc 5.0%
Lawn Mower 4.7%

20 cc to 100 cc Claims High Demand for Small Gas Engine

Based on engine displacement, the 20 cc to 100 cc segment is expected to continue dominating the small gas engine market. The 20 cc to 100 cc engine segment is commonly used in various outdoor power equipment such as lawn mowers, trimmers, chainsaws, and small generators. The demand for small gas engines within this displacement range increases, as homeowners, landscapers, and commercial users seek efficient and reliable equipment for lawn care and landscaping tasks.

There is a corresponding rise in the demand for small gas engines to power equipment used in maintaining lawns, gardens, and green spaces, with an increasing focus on landscaping and gardening activities for residential and commercial properties.

Lawn Mower Segment to Hold High Demand for Small Gas Engine

In terms of equipment, the lawn mower segment is expected to continue dominating the small gas engine market, attributed to several key factors. There is a growing demand for lawn mowers and related equipment, as homeowners, landscaping companies, and commercial property owners prioritize lawn maintenance and landscaping. Lawn mowers powered by small gas engines are widely used for cutting grass in residential yards, parks, golf courses, and commercial landscapes.

Gas powered lawn mowers offer several advantages over electric and manual mowers, including greater power, longer run times, and the ability to handle larger lawns and thicker grass. Many users prefer gas powered mowers for their performance and convenience, especially in areas without easy access to electrical outlets or for properties with extensive grass areas.
Competitive Landscape

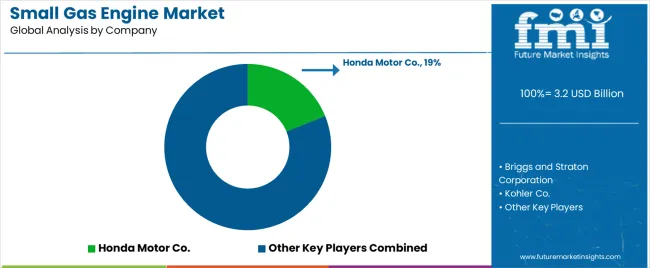
The competitive landscape of the small gas engine market is dynamic and diverse, characterized by a mix of established players, emerging companies, and regional manufacturers.

Company Portfolio

  • Briggs & Stratton Corporation is a renowned manufacturer of small gas engines used in a wide range of applications, including outdoor power equipment, residential and commercial lawn care, and portable generators. The company offers a diverse portfolio of small gas engines tailored to various power equipment, including lawn mowers, pressure washers, snow blowers, and standby generators.
  • Honda Motor Co., Ltd. is a leading manufacturer of small gas engines used in power equipment, motorcycles, and automobiles. The small gas engines of the company power a wide range of outdoor power equipment, including lawn mowers, trimmers, tillers, and water pumps.

Key Coverage in the Small Gas Engine Industry Report

  • High-Efficiency Small Gas Engines
  • Eco-Friendly Engine Solutions
  • Compact Powerplant Technology
  • Advanced Small Engine Performance
  • Fuel-Efficient Gasoline Engines
  • Next-Generation Engine Designs
  • Versatile Small Gas Engine Applications
  • Reliable Small Engine Solutions
  • Low-Emission Engine Technologies
  • Durable Small Engine Components
  • Outdoor Power Equipment Market
  • Portable Generator Market
  • Lawn and Garden Equipment Market

Report Scope

Attribute Details
Estimated Market Size in 2024 USD 3.0 billion
Projected Market Valuation in 2034 USD 5.0 billion
Value-based CAGR 2024 to 2034 5.2%
Forecast Period 2024 to 2034
Historical Data Available for 2019 to 2023
Market Analysis Value in USD billion
Key Regions Covered North America; Latin America; Western Europe; Eastern Europe; South Asia and Pacific; East Asia; The Middle East & Africa
Key Market Segments Covered Engine Displacement, Equipment, End Use, Region
Key Countries Profiled The United States, Canada, Brazil, Mexico, Germany, France, France, Spain, Italy, Russia, Poland, Czech Republic, Romania, India, Bangladesh, Australia, New Zealand, China, Japan, South Korea, GCC countries, South Africa, Israel
Key Companies Profiled Briggs and Straton Corporation; Honda Motor Co.; Kohler Co.; Kawasaki Heavy Industries; Fuji Heavy Industries; Yamaha Motor Co.; Kubota Corporation; Liquid Combustion Technology LLC.; Champion Power Equipment; Fuzhou Launtop M&E Co. Ltd.; Maruyama Mfg. Co. Inc.; Lifan Power

Segmentation Analysis of the Small Gas Engine Market

By Engine Displacement:

  • 20 cc to 100 cc
  • 101 cc to 400 cc
  • 401 cc to 650 cc

By Equipment:

  • Lawn Mower
  • Chainsaw
  • String Trimmer
  • Hedge Trimmer
  • Portable Generator
  • Rotary Tiller
  • Pressure Washer
  • Concrete Vibrators
  • Concrete Screed
  • Edger
  • Leaf Blower
  • Others

By End Use:

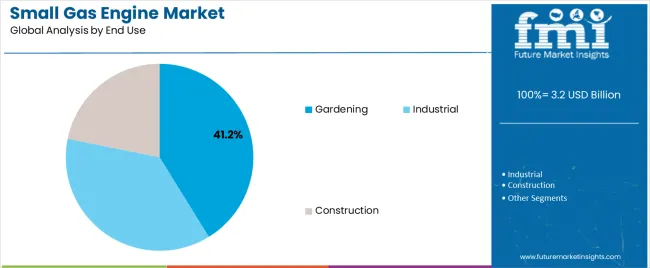
  • Industrial
  • Construction
  • Gardening

By Region:

  • North America
  • Latin America
  • Western Europe
  • Eastern Europe
  • South Asia and Pacific
  • East Asia
  • The Middle East and Africa

Table of Content

  • 1. Executive Summary
  • 2. Market Overview
  • 3. Market Background
  • 4. Global Market Analysis 2019 to 2023 and Forecast, 2024 to 2034
  • 5. Global Market Analysis 2019 to 2023 and Forecast 2024 to 2034, By Engine Displacement
    • 5.1. 20 cc to 100 cc
    • 5.2. 101 cc to 400 cc
    • 5.3. 401 cc to 650 cc
  • 6. Global Market Analysis 2019 to 2023 and Forecast 2024 to 2034, By Equipment
    • 6.1. Lawn Mower
    • 6.2. Chainsaw
    • 6.3. String Trimmer
    • 6.4. Hedge Trimmer
    • 6.5. Portable Generator
    • 6.6. Rotary Tiller
    • 6.7. Pressure Washer
    • 6.8. Concrete Vibrators
    • 6.9. Concrete Screed
    • 6.10. Edger
    • 6.11. Leaf Blower
    • 6.12. Others
  • 7. Global Market Analysis 2019 to 2023 and Forecast 2024 to 2034, By End Use
    • 7.1. Industrial
    • 7.2. Construction
    • 7.3. Gardening
  • 8. Global Market Analysis 2019 to 2023 and Forecast 2024 to 2034, By Region
    • 8.1. North America
    • 8.2. Latin America
    • 8.3. Western Europe
    • 8.4. Eastern Europe
    • 8.5. South Asia and Pacific
    • 8.6. East Asia
    • 8.7. Middle East and Africa
  • 9. North America Market Analysis 2019 to 2023 and Forecast 2024 to 2034, By Country
  • 10. Latin America Market Analysis 2019 to 2023 and Forecast 2024 to 2034, By Country
  • 11. Western Europe Market Analysis 2019 to 2023 and Forecast 2024 to 2034, By Country
  • 12. Eastern Europe Market Analysis 2019 to 2023 and Forecast 2024 to 2034, By Country
  • 13. South Asia and Pacific Market Analysis 2019 to 2023 and Forecast 2024 to 2034, By Country
  • 14. East Asia Market Analysis 2019 to 2023 and Forecast 2024 to 2034, By Country
  • 15. Middle East and Africa Market Analysis 2019 to 2023 and Forecast 2024 to 2034, By Country
  • 16. Key Countries Market Analysis
  • 17. Market Structure Analysis
  • 18. Competition Analysis
    • 18.1. Briggs and Stratton Corporation
    • 18.2. Honda Motor Co.
    • 18.3. Kohler Co.
    • 18.4. Kawasaki Heavy Industries
    • 18.5. Fuji Heavy Industries
    • 18.6. Yamaha Motor Co.
    • 18.7. Kubota Corporation
    • 18.8. Liquid Combustion Technology LLC.
    • 18.9. Champion Power Equipment
    • 18.10. Fuzhou Launtop M&E Co. Ltd.
    • 18.11. Maruyama Mfg. Co. Inc.
    • 18.12. Lifan Power
  • 19. Assumptions & Acronyms Used
  • 20. Research Methodology

List of Tables

Table 1: Global Market Value (US$ Million) Forecast by Region, 2019 to 2034

Table 2: Global Market Volume (Units) Forecast by Region, 2019 to 2034

Table 3: Global Market Value (US$ Million) Forecast by Engine Displacement, 2019 to 2034

Table 4: Global Market Volume (Units) Forecast by Engine Displacement, 2019 to 2034

Table 5: Global Market Value (US$ Million) Forecast by Equipment, 2019 to 2034

Table 6: Global Market Volume (Units) Forecast by Equipment, 2019 to 2034

Table 7: Global Market Value (US$ Million) Forecast by End Use, 2019 to 2034

Table 8: Global Market Volume (Units) Forecast by End Use, 2019 to 2034

Table 9: North America Market Value (US$ Million) Forecast by Country, 2019 to 2034

Table 10: North America Market Volume (Units) Forecast by Country, 2019 to 2034

Table 11: North America Market Value (US$ Million) Forecast by Engine Displacement, 2019 to 2034

Table 12: North America Market Volume (Units) Forecast by Engine Displacement, 2019 to 2034

Table 13: North America Market Value (US$ Million) Forecast by Equipment, 2019 to 2034

Table 14: North America Market Volume (Units) Forecast by Equipment, 2019 to 2034

Table 15: North America Market Value (US$ Million) Forecast by End Use, 2019 to 2034

Table 16: North America Market Volume (Units) Forecast by End Use, 2019 to 2034

Table 17: Latin America Market Value (US$ Million) Forecast by Country, 2019 to 2034

Table 18: Latin America Market Volume (Units) Forecast by Country, 2019 to 2034

Table 19: Latin America Market Value (US$ Million) Forecast by Engine Displacement, 2019 to 2034

Table 20: Latin America Market Volume (Units) Forecast by Engine Displacement, 2019 to 2034

Table 21: Latin America Market Value (US$ Million) Forecast by Equipment, 2019 to 2034

Table 22: Latin America Market Volume (Units) Forecast by Equipment, 2019 to 2034

Table 23: Latin America Market Value (US$ Million) Forecast by End Use, 2019 to 2034

Table 24: Latin America Market Volume (Units) Forecast by End Use, 2019 to 2034

Table 25: Western Europe Market Value (US$ Million) Forecast by Country, 2019 to 2034

Table 26: Western Europe Market Volume (Units) Forecast by Country, 2019 to 2034

Table 27: Western Europe Market Value (US$ Million) Forecast by Engine Displacement, 2019 to 2034

Table 28: Western Europe Market Volume (Units) Forecast by Engine Displacement, 2019 to 2034

Table 29: Western Europe Market Value (US$ Million) Forecast by Equipment, 2019 to 2034

Table 30: Western Europe Market Volume (Units) Forecast by Equipment, 2019 to 2034

Table 31: Western Europe Market Value (US$ Million) Forecast by End Use, 2019 to 2034

Table 32: Western Europe Market Volume (Units) Forecast by End Use, 2019 to 2034

Table 33: Eastern Europe Market Value (US$ Million) Forecast by Country, 2019 to 2034

Table 34: Eastern Europe Market Volume (Units) Forecast by Country, 2019 to 2034

Table 35: Eastern Europe Market Value (US$ Million) Forecast by Engine Displacement, 2019 to 2034

Table 36: Eastern Europe Market Volume (Units) Forecast by Engine Displacement, 2019 to 2034

Table 37: Eastern Europe Market Value (US$ Million) Forecast by Equipment, 2019 to 2034

Table 38: Eastern Europe Market Volume (Units) Forecast by Equipment, 2019 to 2034

Table 39: Eastern Europe Market Value (US$ Million) Forecast by End Use, 2019 to 2034

Table 40: Eastern Europe Market Volume (Units) Forecast by End Use, 2019 to 2034

Table 41: South Asia and Pacific Market Value (US$ Million) Forecast by Country, 2019 to 2034

Table 42: South Asia and Pacific Market Volume (Units) Forecast by Country, 2019 to 2034

Table 43: South Asia and Pacific Market Value (US$ Million) Forecast by Engine Displacement, 2019 to 2034

Table 44: South Asia and Pacific Market Volume (Units) Forecast by Engine Displacement, 2019 to 2034

Table 45: South Asia and Pacific Market Value (US$ Million) Forecast by Equipment, 2019 to 2034

Table 46: South Asia and Pacific Market Volume (Units) Forecast by Equipment, 2019 to 2034

Table 47: South Asia and Pacific Market Value (US$ Million) Forecast by End Use, 2019 to 2034

Table 48: South Asia and Pacific Market Volume (Units) Forecast by End Use, 2019 to 2034

Table 49: East Asia Market Value (US$ Million) Forecast by Country, 2019 to 2034

Table 50: East Asia Market Volume (Units) Forecast by Country, 2019 to 2034

Table 51: East Asia Market Value (US$ Million) Forecast by Engine Displacement, 2019 to 2034

Table 52: East Asia Market Volume (Units) Forecast by Engine Displacement, 2019 to 2034

Table 53: East Asia Market Value (US$ Million) Forecast by Equipment, 2019 to 2034

Table 54: East Asia Market Volume (Units) Forecast by Equipment, 2019 to 2034

Table 55: East Asia Market Value (US$ Million) Forecast by End Use, 2019 to 2034

Table 56: East Asia Market Volume (Units) Forecast by End Use, 2019 to 2034

Table 57: Middle East and Africa Market Value (US$ Million) Forecast by Country, 2019 to 2034

Table 58: Middle East and Africa Market Volume (Units) Forecast by Country, 2019 to 2034

Table 59: Middle East and Africa Market Value (US$ Million) Forecast by Engine Displacement, 2019 to 2034

Table 60: Middle East and Africa Market Volume (Units) Forecast by Engine Displacement, 2019 to 2034

Table 61: Middle East and Africa Market Value (US$ Million) Forecast by Equipment, 2019 to 2034

Table 62: Middle East and Africa Market Volume (Units) Forecast by Equipment, 2019 to 2034

Table 63: Middle East and Africa Market Value (US$ Million) Forecast by End Use, 2019 to 2034

Table 64: Middle East and Africa Market Volume (Units) Forecast by End Use, 2019 to 2034

List of Figures

Figure 1: Global Market Value (US$ Million) by Engine Displacement, 2024 to 2034

Figure 2: Global Market Value (US$ Million) by Equipment, 2024 to 2034

Figure 3: Global Market Value (US$ Million) by End Use, 2024 to 2034

Figure 4: Global Market Value (US$ Million) by Region, 2024 to 2034

Figure 5: Global Market Value (US$ Million) Analysis by Region, 2019 to 2034

Figure 6: Global Market Volume (Units) Analysis by Region, 2019 to 2034

Figure 7: Global Market Value Share (%) and BPS Analysis by Region, 2024 to 2034

Figure 8: Global Market Y-o-Y Growth (%) Projections by Region, 2024 to 2034

Figure 9: Global Market Value (US$ Million) Analysis by Engine Displacement, 2019 to 2034

Figure 10: Global Market Volume (Units) Analysis by Engine Displacement, 2019 to 2034

Figure 11: Global Market Value Share (%) and BPS Analysis by Engine Displacement, 2024 to 2034

Figure 12: Global Market Y-o-Y Growth (%) Projections by Engine Displacement, 2024 to 2034

Figure 13: Global Market Value (US$ Million) Analysis by Equipment, 2019 to 2034

Figure 14: Global Market Volume (Units) Analysis by Equipment, 2019 to 2034

Figure 15: Global Market Value Share (%) and BPS Analysis by Equipment, 2024 to 2034

Figure 16: Global Market Y-o-Y Growth (%) Projections by Equipment, 2024 to 2034

Figure 17: Global Market Value (US$ Million) Analysis by End Use, 2019 to 2034

Figure 18: Global Market Volume (Units) Analysis by End Use, 2019 to 2034

Figure 19: Global Market Value Share (%) and BPS Analysis by End Use, 2024 to 2034

Figure 20: Global Market Y-o-Y Growth (%) Projections by End Use, 2024 to 2034

Figure 21: Global Market Attractiveness by Engine Displacement, 2024 to 2034

Figure 22: Global Market Attractiveness by Equipment, 2024 to 2034

Figure 23: Global Market Attractiveness by End Use, 2024 to 2034

Figure 24: Global Market Attractiveness by Region, 2024 to 2034

Figure 25: North America Market Value (US$ Million) by Engine Displacement, 2024 to 2034

Figure 26: North America Market Value (US$ Million) by Equipment, 2024 to 2034

Figure 27: North America Market Value (US$ Million) by End Use, 2024 to 2034

Figure 28: North America Market Value (US$ Million) by Country, 2024 to 2034

Figure 29: North America Market Value (US$ Million) Analysis by Country, 2019 to 2034

Figure 30: North America Market Volume (Units) Analysis by Country, 2019 to 2034

Figure 31: North America Market Value Share (%) and BPS Analysis by Country, 2024 to 2034

Figure 32: North America Market Y-o-Y Growth (%) Projections by Country, 2024 to 2034

Figure 33: North America Market Value (US$ Million) Analysis by Engine Displacement, 2019 to 2034

Figure 34: North America Market Volume (Units) Analysis by Engine Displacement, 2019 to 2034

Figure 35: North America Market Value Share (%) and BPS Analysis by Engine Displacement, 2024 to 2034

Figure 36: North America Market Y-o-Y Growth (%) Projections by Engine Displacement, 2024 to 2034

Figure 37: North America Market Value (US$ Million) Analysis by Equipment, 2019 to 2034

Figure 38: North America Market Volume (Units) Analysis by Equipment, 2019 to 2034

Figure 39: North America Market Value Share (%) and BPS Analysis by Equipment, 2024 to 2034

Figure 40: North America Market Y-o-Y Growth (%) Projections by Equipment, 2024 to 2034

Figure 41: North America Market Value (US$ Million) Analysis by End Use, 2019 to 2034

Figure 42: North America Market Volume (Units) Analysis by End Use, 2019 to 2034

Figure 43: North America Market Value Share (%) and BPS Analysis by End Use, 2024 to 2034

Figure 44: North America Market Y-o-Y Growth (%) Projections by End Use, 2024 to 2034

Figure 45: North America Market Attractiveness by Engine Displacement, 2024 to 2034

Figure 46: North America Market Attractiveness by Equipment, 2024 to 2034

Figure 47: North America Market Attractiveness by End Use, 2024 to 2034

Figure 48: North America Market Attractiveness by Country, 2024 to 2034

Figure 49: Latin America Market Value (US$ Million) by Engine Displacement, 2024 to 2034

Figure 50: Latin America Market Value (US$ Million) by Equipment, 2024 to 2034

Figure 51: Latin America Market Value (US$ Million) by End Use, 2024 to 2034

Figure 52: Latin America Market Value (US$ Million) by Country, 2024 to 2034

Figure 53: Latin America Market Value (US$ Million) Analysis by Country, 2019 to 2034

Figure 54: Latin America Market Volume (Units) Analysis by Country, 2019 to 2034

Figure 55: Latin America Market Value Share (%) and BPS Analysis by Country, 2024 to 2034

Figure 56: Latin America Market Y-o-Y Growth (%) Projections by Country, 2024 to 2034

Figure 57: Latin America Market Value (US$ Million) Analysis by Engine Displacement, 2019 to 2034

Figure 58: Latin America Market Volume (Units) Analysis by Engine Displacement, 2019 to 2034

Figure 59: Latin America Market Value Share (%) and BPS Analysis by Engine Displacement, 2024 to 2034

Figure 60: Latin America Market Y-o-Y Growth (%) Projections by Engine Displacement, 2024 to 2034

Figure 61: Latin America Market Value (US$ Million) Analysis by Equipment, 2019 to 2034

Figure 62: Latin America Market Volume (Units) Analysis by Equipment, 2019 to 2034

Figure 63: Latin America Market Value Share (%) and BPS Analysis by Equipment, 2024 to 2034

Figure 64: Latin America Market Y-o-Y Growth (%) Projections by Equipment, 2024 to 2034

Figure 65: Latin America Market Value (US$ Million) Analysis by End Use, 2019 to 2034

Figure 66: Latin America Market Volume (Units) Analysis by End Use, 2019 to 2034

Figure 67: Latin America Market Value Share (%) and BPS Analysis by End Use, 2024 to 2034

Figure 68: Latin America Market Y-o-Y Growth (%) Projections by End Use, 2024 to 2034

Figure 69: Latin America Market Attractiveness by Engine Displacement, 2024 to 2034

Figure 70: Latin America Market Attractiveness by Equipment, 2024 to 2034

Figure 71: Latin America Market Attractiveness by End Use, 2024 to 2034

Figure 72: Latin America Market Attractiveness by Country, 2024 to 2034

Figure 73: Western Europe Market Value (US$ Million) by Engine Displacement, 2024 to 2034

Figure 74: Western Europe Market Value (US$ Million) by Equipment, 2024 to 2034

Figure 75: Western Europe Market Value (US$ Million) by End Use, 2024 to 2034

Figure 76: Western Europe Market Value (US$ Million) by Country, 2024 to 2034

Figure 77: Western Europe Market Value (US$ Million) Analysis by Country, 2019 to 2034

Figure 78: Western Europe Market Volume (Units) Analysis by Country, 2019 to 2034

Figure 79: Western Europe Market Value Share (%) and BPS Analysis by Country, 2024 to 2034

Figure 80: Western Europe Market Y-o-Y Growth (%) Projections by Country, 2024 to 2034

Figure 81: Western Europe Market Value (US$ Million) Analysis by Engine Displacement, 2019 to 2034

Figure 82: Western Europe Market Volume (Units) Analysis by Engine Displacement, 2019 to 2034

Figure 83: Western Europe Market Value Share (%) and BPS Analysis by Engine Displacement, 2024 to 2034

Figure 84: Western Europe Market Y-o-Y Growth (%) Projections by Engine Displacement, 2024 to 2034

Figure 85: Western Europe Market Value (US$ Million) Analysis by Equipment, 2019 to 2034

Figure 86: Western Europe Market Volume (Units) Analysis by Equipment, 2019 to 2034

Figure 87: Western Europe Market Value Share (%) and BPS Analysis by Equipment, 2024 to 2034

Figure 88: Western Europe Market Y-o-Y Growth (%) Projections by Equipment, 2024 to 2034

Figure 89: Western Europe Market Value (US$ Million) Analysis by End Use, 2019 to 2034

Figure 90: Western Europe Market Volume (Units) Analysis by End Use, 2019 to 2034

Figure 91: Western Europe Market Value Share (%) and BPS Analysis by End Use, 2024 to 2034

Figure 92: Western Europe Market Y-o-Y Growth (%) Projections by End Use, 2024 to 2034

Figure 93: Western Europe Market Attractiveness by Engine Displacement, 2024 to 2034

Figure 94: Western Europe Market Attractiveness by Equipment, 2024 to 2034

Figure 95: Western Europe Market Attractiveness by End Use, 2024 to 2034

Figure 96: Western Europe Market Attractiveness by Country, 2024 to 2034

Figure 97: Eastern Europe Market Value (US$ Million) by Engine Displacement, 2024 to 2034

Figure 98: Eastern Europe Market Value (US$ Million) by Equipment, 2024 to 2034

Figure 99: Eastern Europe Market Value (US$ Million) by End Use, 2024 to 2034

Figure 100: Eastern Europe Market Value (US$ Million) by Country, 2024 to 2034

Figure 101: Eastern Europe Market Value (US$ Million) Analysis by Country, 2019 to 2034

Figure 102: Eastern Europe Market Volume (Units) Analysis by Country, 2019 to 2034

Figure 103: Eastern Europe Market Value Share (%) and BPS Analysis by Country, 2024 to 2034

Figure 104: Eastern Europe Market Y-o-Y Growth (%) Projections by Country, 2024 to 2034

Figure 105: Eastern Europe Market Value (US$ Million) Analysis by Engine Displacement, 2019 to 2034

Figure 106: Eastern Europe Market Volume (Units) Analysis by Engine Displacement, 2019 to 2034

Figure 107: Eastern Europe Market Value Share (%) and BPS Analysis by Engine Displacement, 2024 to 2034

Figure 108: Eastern Europe Market Y-o-Y Growth (%) Projections by Engine Displacement, 2024 to 2034

Figure 109: Eastern Europe Market Value (US$ Million) Analysis by Equipment, 2019 to 2034

Figure 110: Eastern Europe Market Volume (Units) Analysis by Equipment, 2019 to 2034

Figure 111: Eastern Europe Market Value Share (%) and BPS Analysis by Equipment, 2024 to 2034

Figure 112: Eastern Europe Market Y-o-Y Growth (%) Projections by Equipment, 2024 to 2034

Figure 113: Eastern Europe Market Value (US$ Million) Analysis by End Use, 2019 to 2034

Figure 114: Eastern Europe Market Volume (Units) Analysis by End Use, 2019 to 2034

Figure 115: Eastern Europe Market Value Share (%) and BPS Analysis by End Use, 2024 to 2034

Figure 116: Eastern Europe Market Y-o-Y Growth (%) Projections by End Use, 2024 to 2034

Figure 117: Eastern Europe Market Attractiveness by Engine Displacement, 2024 to 2034

Figure 118: Eastern Europe Market Attractiveness by Equipment, 2024 to 2034

Figure 119: Eastern Europe Market Attractiveness by End Use, 2024 to 2034

Figure 120: Eastern Europe Market Attractiveness by Country, 2024 to 2034

Figure 121: South Asia and Pacific Market Value (US$ Million) by Engine Displacement, 2024 to 2034

Figure 122: South Asia and Pacific Market Value (US$ Million) by Equipment, 2024 to 2034

Figure 123: South Asia and Pacific Market Value (US$ Million) by End Use, 2024 to 2034

Figure 124: South Asia and Pacific Market Value (US$ Million) by Country, 2024 to 2034

Figure 125: South Asia and Pacific Market Value (US$ Million) Analysis by Country, 2019 to 2034

Figure 126: South Asia and Pacific Market Volume (Units) Analysis by Country, 2019 to 2034

Figure 127: South Asia and Pacific Market Value Share (%) and BPS Analysis by Country, 2024 to 2034

Figure 128: South Asia and Pacific Market Y-o-Y Growth (%) Projections by Country, 2024 to 2034

Figure 129: South Asia and Pacific Market Value (US$ Million) Analysis by Engine Displacement, 2019 to 2034

Figure 130: South Asia and Pacific Market Volume (Units) Analysis by Engine Displacement, 2019 to 2034

Figure 131: South Asia and Pacific Market Value Share (%) and BPS Analysis by Engine Displacement, 2024 to 2034

Figure 132: South Asia and Pacific Market Y-o-Y Growth (%) Projections by Engine Displacement, 2024 to 2034

Figure 133: South Asia and Pacific Market Value (US$ Million) Analysis by Equipment, 2019 to 2034

Figure 134: South Asia and Pacific Market Volume (Units) Analysis by Equipment, 2019 to 2034

Figure 135: South Asia and Pacific Market Value Share (%) and BPS Analysis by Equipment, 2024 to 2034

Figure 136: South Asia and Pacific Market Y-o-Y Growth (%) Projections by Equipment, 2024 to 2034

Figure 137: South Asia and Pacific Market Value (US$ Million) Analysis by End Use, 2019 to 2034

Figure 138: South Asia and Pacific Market Volume (Units) Analysis by End Use, 2019 to 2034

Figure 139: South Asia and Pacific Market Value Share (%) and BPS Analysis by End Use, 2024 to 2034

Figure 140: South Asia and Pacific Market Y-o-Y Growth (%) Projections by End Use, 2024 to 2034

Figure 141: South Asia and Pacific Market Attractiveness by Engine Displacement, 2024 to 2034

Figure 142: South Asia and Pacific Market Attractiveness by Equipment, 2024 to 2034

Figure 143: South Asia and Pacific Market Attractiveness by End Use, 2024 to 2034

Figure 144: South Asia and Pacific Market Attractiveness by Country, 2024 to 2034

Figure 145: East Asia Market Value (US$ Million) by Engine Displacement, 2024 to 2034

Figure 146: East Asia Market Value (US$ Million) by Equipment, 2024 to 2034

Figure 147: East Asia Market Value (US$ Million) by End Use, 2024 to 2034

Figure 148: East Asia Market Value (US$ Million) by Country, 2024 to 2034

Figure 149: East Asia Market Value (US$ Million) Analysis by Country, 2019 to 2034

Figure 150: East Asia Market Volume (Units) Analysis by Country, 2019 to 2034

Figure 151: East Asia Market Value Share (%) and BPS Analysis by Country, 2024 to 2034

Figure 152: East Asia Market Y-o-Y Growth (%) Projections by Country, 2024 to 2034

Figure 153: East Asia Market Value (US$ Million) Analysis by Engine Displacement, 2019 to 2034

Figure 154: East Asia Market Volume (Units) Analysis by Engine Displacement, 2019 to 2034

Figure 155: East Asia Market Value Share (%) and BPS Analysis by Engine Displacement, 2024 to 2034

Figure 156: East Asia Market Y-o-Y Growth (%) Projections by Engine Displacement, 2024 to 2034

Figure 157: East Asia Market Value (US$ Million) Analysis by Equipment, 2019 to 2034

Figure 158: East Asia Market Volume (Units) Analysis by Equipment, 2019 to 2034

Figure 159: East Asia Market Value Share (%) and BPS Analysis by Equipment, 2024 to 2034

Figure 160: East Asia Market Y-o-Y Growth (%) Projections by Equipment, 2024 to 2034

Figure 161: East Asia Market Value (US$ Million) Analysis by End Use, 2019 to 2034

Figure 162: East Asia Market Volume (Units) Analysis by End Use, 2019 to 2034

Figure 163: East Asia Market Value Share (%) and BPS Analysis by End Use, 2024 to 2034

Figure 164: East Asia Market Y-o-Y Growth (%) Projections by End Use, 2024 to 2034

Figure 165: East Asia Market Attractiveness by Engine Displacement, 2024 to 2034

Figure 166: East Asia Market Attractiveness by Equipment, 2024 to 2034

Figure 167: East Asia Market Attractiveness by End Use, 2024 to 2034

Figure 168: East Asia Market Attractiveness by Country, 2024 to 2034

Figure 169: Middle East and Africa Market Value (US$ Million) by Engine Displacement, 2024 to 2034

Figure 170: Middle East and Africa Market Value (US$ Million) by Equipment, 2024 to 2034

Figure 171: Middle East and Africa Market Value (US$ Million) by End Use, 2024 to 2034

Figure 172: Middle East and Africa Market Value (US$ Million) by Country, 2024 to 2034

Figure 173: Middle East and Africa Market Value (US$ Million) Analysis by Country, 2019 to 2034

Figure 174: Middle East and Africa Market Volume (Units) Analysis by Country, 2019 to 2034

Figure 175: Middle East and Africa Market Value Share (%) and BPS Analysis by Country, 2024 to 2034

Figure 176: Middle East and Africa Market Y-o-Y Growth (%) Projections by Country, 2024 to 2034

Figure 177: Middle East and Africa Market Value (US$ Million) Analysis by Engine Displacement, 2019 to 2034

Figure 178: Middle East and Africa Market Volume (Units) Analysis by Engine Displacement, 2019 to 2034

Figure 179: Middle East and Africa Market Value Share (%) and BPS Analysis by Engine Displacement, 2024 to 2034

Figure 180: Middle East and Africa Market Y-o-Y Growth (%) Projections by Engine Displacement, 2024 to 2034

Figure 181: Middle East and Africa Market Value (US$ Million) Analysis by Equipment, 2019 to 2034

Figure 182: Middle East and Africa Market Volume (Units) Analysis by Equipment, 2019 to 2034

Figure 183: Middle East and Africa Market Value Share (%) and BPS Analysis by Equipment, 2024 to 2034

Figure 184: Middle East and Africa Market Y-o-Y Growth (%) Projections by Equipment, 2024 to 2034

Figure 185: Middle East and Africa Market Value (US$ Million) Analysis by End Use, 2019 to 2034

Figure 186: Middle East and Africa Market Volume (Units) Analysis by End Use, 2019 to 2034

Figure 187: Middle East and Africa Market Value Share (%) and BPS Analysis by End Use, 2024 to 2034

Figure 188: Middle East and Africa Market Y-o-Y Growth (%) Projections by End Use, 2024 to 2034

Figure 189: Middle East and Africa Market Attractiveness by Engine Displacement, 2024 to 2034

Figure 190: Middle East and Africa Market Attractiveness by Equipment, 2024 to 2034

Figure 191: Middle East and Africa Market Attractiveness by End Use, 2024 to 2034

Figure 192: Middle East and Africa Market Attractiveness by Country, 2024 to 2034

Frequently Asked Questions

What is the anticipated value of the Small Gas Engine market in 2024?

The small gas engine market is projected to reach a valuation of USD 3.0 Billion in 2024.

What is the expected CAGR for the Small Gas Engine market until 2034?

The small gas engine industry is set to expand by a CAGR of 5.2% through 2034.

How much valuation is projected for the Small Gas Engine market in 2034?

The small gas engine market is forecast to reach USD 5.0 Billion by 2034.

Which country is projected to lead the Small Gas Engine market?

Japan is expected to be the top performing market, exhibiting a CAGR of 6.9% through 2034.

Which is the dominant engine displacement in the Small Gas Engine domain?

20 cc to 100 cc segment is preferred, and is expected to account for a share of 5.0% in 2024.

Explore Similar Insights

Future Market Insights

Small Gas Engine Market