Reports

- Global Locations -

Headquarters

Future Market Insights, Inc.

Christiana Corporate, 200
Continental Drive, Suite 401,
Newark, Delaware - 19713,
United States

T: +1-845-579-5705

Americas

Future Market Insights, Inc.

616 Corporate Way, Suite 2-9018,
Valley Cottage, NY 10989, United States

T: +1-347-918-3531

MEA

Future Market Insights

1602-6 Jumeirah Bay X2 Tower, Plot No: JLT-PH2-X2A,
Jumeirah Lakes Towers, Dubai,
United Arab Emirates

Europe

Future Market Insights

3rd Floor, 207 Regent Street,
W1B 3HH London
United Kingdom

T: + 44 (0) 20 8123 9659
D: +44 (0) 20 3287 4268

Asia Pacific

Future Market Insights

IndiaLand Global Tech Park, Unit UG-1, Behind Grand HighStreet, Phase 1, Hinjawadi, MH, Pune – 411057, India

Gas Engines Market Outlook (2022 to 2032)

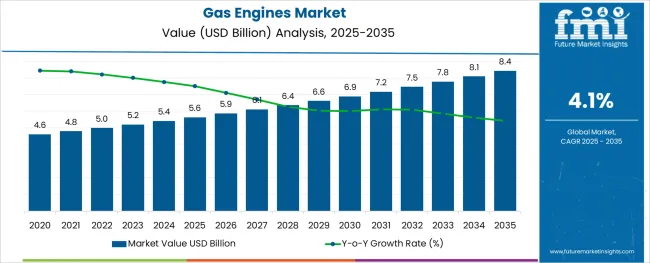
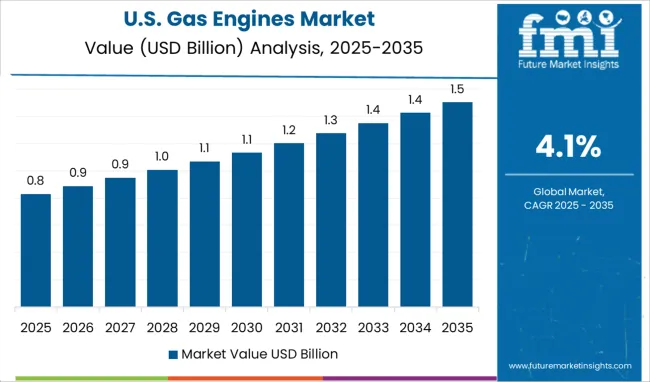
The global gas engines market size touched a valuation of US$ 4.8 Billion in 2022 and is projected to expand at a moderate CAGR of 4.1% during the forecast period between 2022 and 2032, totaling US$ 7.47 Billion by 2032, Supported by,

  • Increasing demand for clean and efficient power production technologies worldwide.
  • Technological advancements in gas engines
  • The growing applications in heat and power plants, the automotive industry, the marine industry, and the manufacturing sector boost the market growth
  • Growing demand for electric generator
  • The rising demand for renewable sources of energy in developed regions
Data Points Key Statistics
Estimated Value of Global Gas Engine Market by 2032 US$ 7.47 Billion
Documented Market Value of the Gas Engine Market in 2022 US$ 4.8 Billion
Estimated CAGR from 2022 to 2032 4.1%

During the period ranging from 2020 to 2022, gas engines demand prospects appeared limited, attributed to the onset of the COVID-19 pandemic, which shook investor confidence amid the cessation of all industrial activity. This blip was gradually overcome since mid-2021, leading to a resurgence in growth projections.

The rising utilization of gas engines in the marine and automotive sectors is set to propel the demand for gas engines in the future years. As per the USA Energy Information Administration, The USA used about 30.28 trillion cubic feet (Tcf) of natural gas in 2021, the equivalent of about 31.35 quadrillion British thermal units (quads) and 32% of USA total energy consumption. These numbers are projected to surge at a fast pace in the assessment period, thereby boosting the demand for gas engines globally.

Don't pay for what you don't need

Customize your report by selecting specific countries or regions and save 30%!

Growing need for reducing carbon emissions and the presence of strict government regulation driving market growth in North America.

With an increasing focus on reducing carbon emissions, the presence of strict government regulation, and rising usage of natural gas for power generation and mechanical drive applications in North America to drive the gas engine market during the forecast period.

The increasing consumption of natural gas in many applications is creating immense demand for sustainable technologies like gas engines. The gas engine market in North America accounts for a significant share of the global revenue generation, owing to various technological enhancements and ongoing investments by several companies, and an increase in the number of gas-powered power plants will create huge demand for gas engines in the future.

Opportunities abound in the Natural Gas based engines Segment

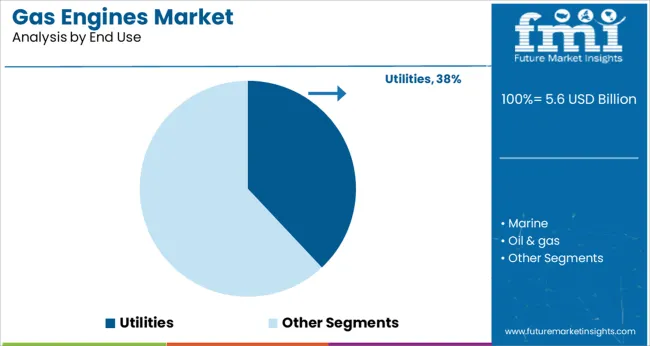
As natural gas is eco-friendly as it burns cleaner and emits less carbon than other fuels thus major end-use industries such as utilities, manufacturing, automotive, and oil & gas use natural gas fueling engines.

The increasing usage of natural gas in gas engines across electricity generation plants boosts the growth of the segment. Also, the increased consumer awareness about the benefits of using natural gas coupled with favorable government initiatives is expected to positively impact the gas engine market forecast.

The shifting regulatory policies toward energy transition and sustainable energy sources, driven by integrated energy considerations, will enhance natural gas uses.

Over the years, there has been a significant increase in the demand for gas engines due to growing environmental concerns and a gradual shift towards producing energy by using natural gas and special gas fuels. Today, the majority of power generation plants are replacing their traditional power generation infrastructure with gas engines to reduce emission levels.

Gas engines are internal combustion engines that run on gaseous fuel, such as natural gas, coal gas, biogas, and special gas. They are gradually gaining traction across end-use verticals like utilities, automotive, oil & gas, and manufacturing due to their higher efficiency, low operating costs, and eco-friendly nature.

Rising demand for electricity coupled with increasing usage of natural gas for producing energy due to its clean, economical, and readily available nature is expected to boost the growth of the gas engine market during the forecast period. According to the USA Energy Information Agency (EIA), 23.2% of the total global energy supply was produced by using natural gas in 2019.

Further, advancements in gas engine technologies and growing environmental concerns will fuel the adoption of gas engines across the world during the assessment period.

Nikhil Kaitwade
Nikhil Kaitwade

Principal Consultant

Talk to Analyst

Find your sweet spots for generating winning opportunities in this market.

2015 to 2021 Global Gas Engines Market Outlook Compared To 2022 to 2032 Forecast

The global demand for gas engines is projected to grow at a steady CAGR of 4.1% during the forecast period from 2022 to 2032, surpassing a valuation of US$ 7.47 Billion by the end of 2032.

Rising adoption of gas engines in power generation and mechanical drive applications, implementation of stringent carbon emission regulations, increasing government initiatives to expand the power generation infrastructure, the growing popularity of gas engine technologies across emerging economies, and technological advancements in gas engines are some of the major factors driving growth in the global gas engines market.

Since natural gas is clean and economical, various end use-industries are utilizing it for performing several functions including powering mechanical equipment, generating electricity, and propelling vehicles. This will continue to boost the sales of gas engines during the forecast period.

Similarly, rising environmental concerns along with growing demand for clean and efficient power production technologies and increased usage of distributed power generation systems will create opportunities for gas engine manufacturers, thereby expanding the global gas engine market size.

The expansion of the industrial gas turbine market along with rising awareness of environmental hazards and surging demand for clean and efficient power production resources is expected to improve the gas fuel engines market share during the forthcoming years.

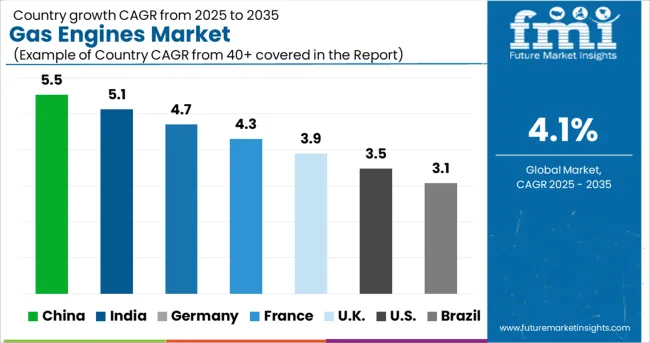
Countries like India, Germany, and the United Kingdom are spending large amounts on the construction of gas-powered power plants to reduce carbon emission levels as well as to cater to rising energy demands. Thus, an increase in the number of gas-powered power plants will create huge demand for gas engines in the future.

It has been observed that natural gas-fired power plants emit negligible amounts of greenhouse gases as compared to oil and coal fired-plants. Driven by this, countries are continuously striving to develop and expand their gas-powered power infrastructure, thereby creating space for gas engine market growth.

Which Factors Are Restraining The Growth Of Gas Engines Market?

Despite its optimistic stance, the global gas engine market is facing various challenges that are restraining its growth to some extent. Some of these factors are the shortage of natural gas due to wars and outbreaks of pandemics, fluctuations in natural gas prices, lack of sufficient infrastructure in some regions, and expansion of the gasoline engine market size.
Get the data you need at a Fraction of the cost

Personalize your report by choosing insights you need
and save 40%!

Country-Wise Segment

Why are Sales of Gas Engines Rising Across China?

Rising Usage of Natural Gas for Power Generation Application Creating Demand for Gas Engines in China

As per FMI, sales of gas engines across China are projected to grow at a significant pace during the forecast period, owing to the rising demand for clean and efficient power generation technologies, presence of stringent government regulations, rapid increase in the number of gas-fired power plants, availability of advanced products at lower prices, and increasing usage of natural gas in myriad applications.

Rapid usage of coal for power generation and cogeneration applications across China has caused many serious environmental consequences. As a result, there has been a dramatic shift towards large-scale production and consumption of eco-friendly and sustainable alternatives like natural gas.

According to the USA Energy Information Agency (EIA), China’s natural gas consumption rose by 9% in 2019 to 10.8 Tcf from 9.9 Tcf in 2018, making it the world’s third-largest natural gas consumer behind the United States and Russia. This rising usage of natural gas is expected to generate significant demand for gas engines throughout the forecast period.

Similarly, increasing government initiatives and investments to reduce carbon emission levels while at the same time, increasing electricity generation is positively impacting the gas engine market in the country. As per the Center for Strategic and International Studies (CSIS), China invested $266 billion in energy transition measures in 2021.

What is the Demand Outlook for the United Kingdom Gas Engines Market?

Rising Need for Reducing Carbon Emissions and the Presence of Strict Government Regulation Driving Market Growth in the United Kingdom

With an increasing focus on reducing carbon emissions, the presence of strict government regulation, and the rising usage of natural gas for power generation and mechanical drive applications, the United Kingdom's gas engine market is poised to exhibit steady growth during the forecast period.

Rising consumption of natural gas in a wide range of applications is creating immense demand for sustainable technologies like gas engines and this trend is likely to continue during the forecast period. According to the Worldometer, the United Kingdom consumes 2,795,569 million cubic feet (MMcf) of natural gas per year as of the year 2017.

Similarly, the growing popularity of turbofan engines and the rapid expansion of the marine gas engine market is expected to create opportunities for gas engine manufacturers across the United Kingdom during the forecast period.

Category-Wise Insights

Which Fuel Type Segment Contributes Most to Gas Engines Market Growth?

Demand for Natural Gas-Based Engines to Continue Rising Throughout the Forecast Period

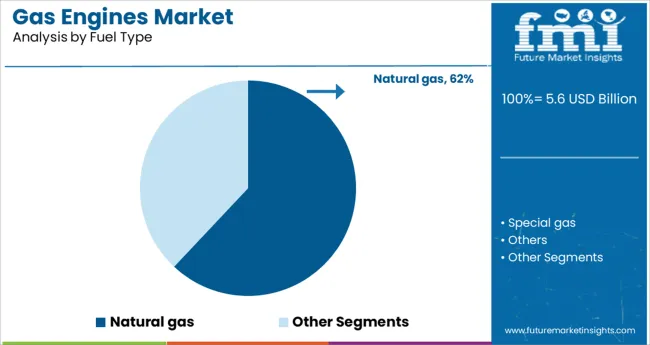
Based on fuel type, the gas engine market is segmented into natural gas, special gas, and others. Among these, the natural gas segment holds the largest portion of the global gas engine market and is likely to grow at a higher CAGR during the forecast period. The growth of the segment is attributed to the increasing usage of natural gas in gas engines across electricity generation plants.

Natural gas is more eco-friendly as it burns cleaner and emits less carbon than other fuels. This is prompting major end-use industries such as utilities, manufacturing, automotive, and oil & gas. to use natural gas fueling engines.

Growing consumer awareness about the benefits of using natural gas coupled with favorable government initiatives is expected to positively impact the natural gas engine market forecast.

Based on Power Output, Which Gas Engine Scores High in the Gas Engine Market?

Above 15 MW Gas Engines Remain Most Preferred for Power Generation and Cogeneration Applications

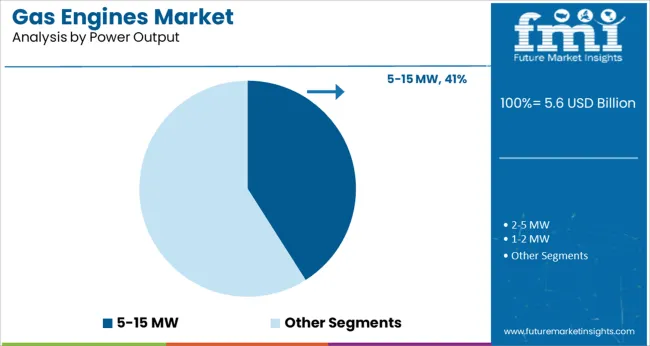
As per FMI, the above 15 MW gas engines segment accounted for the largest revenue share in 2021, owing to their increasing usage in power generation and cogeneration applications. These engines are mostly used in island-type configurations to supplement major power plants and help avoid blackouts.

The rapid expansion of power generation infrastructure worldwide coupled with growing demand for power generators for the military will further boost the growth of this segment during the forecast period.

Which is the most Lucrative Application for Gas Engines?

Mechanical Drive Segment to Create Maximum Opportunities for Gas Engine Manufacturers

In terms of application, the gas engine market has been segmented into power generation, mechanical drive, cogeneration, and others. Among these, the mechanical driver segment dominates the global gas engine market.

A wide range of mechanical equipment, such as pumps, blowers, compressors, etc. used across manufacturing and oil and gas industries are powered by gas engines. Thus, the rapid expansion of the industrial gas turbine market will boost segment growth during the forecast period.

Competitive Landscape

Leading gas engine manufacturers have adopted various organic and inorganic strategies such as new product launches, the establishment of new facilities across attractive regions, partnerships, acquisitions, collaborations, etc. to gain a competitive edge in the global gas engines market.

For instance:

  • In June 2020, Kawasaki Heavy Industries, Ltd. launched sales of their new model KG-18-T gas engine.
  • In 2021, Scania introduced a new 13-liter gas engine for travel operations that can run on natural gas and on biogas.

Scope Of The Report

Future Market Insights' latest report provides a professional and in-depth study of the current state of the global gas engines market. It provides details about the global gas engine market size, key revenue drivers, market restraints, growth opportunities, and recent developments.

The report examines the impact of the booming gas turbine industry on overall gas engine sales and illustrates how the rapid expansion of the power generation sector is creating space for the growth of the gas engine market.

Besides this, FMI also attempts to reveal the prevalent gas engine market trends guiding the gas engine market growth. Does it provide solutions to queries like how will a rise in fuel prices influence the demand for gas engines? Why is Europe becoming the hub for gas engines? And who are the top gas engine manufacturers?

A certain number of chapters have been dedicated to analyzing leading market segments and regional pockets. This makes the study more informative and interesting.

The Gas Engines Market Analysis Includes:

  • A 10-year realistic sales forecast for gas engines across diverse end-use verticals
  • Detailed gas engines market segmentation
  • Information about leading segments and their growth forecast till 2032
  • Top gas engine manufacturers along with their strategies to penetrate attractive markets
  • Information about the latest gas engines market trends
  • Key growth shaping factors like drivers, restraints, and emerging opportunities
  • Detailed analysis of regional pockets along with the degree of market penetration
  • Impact of the rising energy crisis on the gas engines market
  • Supply chain analysis
  • The winning imperatives in the gas engines market
  • Pricing analysis
Attributes Details
Projected Growth Rate (2022 to 2032) 4.1%
Estimated Market Valuation (2032) 7.47 Billion
Forecast Period 2022 to 2032
Historic Data Available for 2015 to 2021
Market Analysis USD Million for Value
Report Coverage Market forecast, company share analysis, competition intelligence, Drivers, Restraints, Opportunities and Threats analysis, market dynamics and challenges, and strategic growth initiatives
Key Segments Covered
  • Product
  • Application
  • Device Type
  • Grade Type
  • Distribution Channel
  • Region
Key regions covered North America
  • USA
  • Canada
  • Rest of North America
Latin America
  • Brazil
  • Argentina
  • Mexico
  • Rest of Latin America
Western Europe
  • Germany
  • United Kingdom
  • France
  • Rest of Western Europe
Eastern Europe
  • Russia
  • Spain
  • Rest of Eastern Europe
South Asia Pacific
  • China
  • India
  • Japan
  • Malaysia
  • Thailand
  • Indonesia
  • South Korea
  • Rest of South Asia & Pacific
Middle East & Africa
  • GCC Countries
  • Turkey
  • Israel
  • Rest of Middle East and Africa(MEA)
Rest of the World
  • Oceania
  • Africa
  • South America
Application
  • Power Generation
  • Mechanical Device
  • Cogenerations
  • Others
Key companies profiled Westport Fuel Systems Inc, Wärtsilä, IHI Power Systems Co., Ltd. (Subsidiary of IHI Corporation), YANMAR HOLDINGS CO., MAN SE, BERGEN engines AS, LIEBHERR, JFE Engineering Corporation, Siemens, INNIO, MITSUBISHI HEAVY INDUSTRIES, LTD, Kawasaki Heavy Industries, Ltd and Caterpillar, Cummins Inc.

Key Segments

By Fuel Type:

  • Natural gas
  • Special gas
  • Others

By End Use:

  • Utilities
  • Marine
  • Oil & gas
  • Manufacturing
  • Others

By Power Output:

  • 1-2 MW
  • 2-5 MW
  • 5-15 MW
  • Above 15 MW

By Application:

  • Power Generation
  • Mechanical Drive
  • Cogenerations
  • Others

By Region:

  • North America
  • Latin America
  • Europe
  • Middle East and Africa
  • Asia Pacific

Frequently Asked Questions

What is the current valuation of gas engines market?

As per FMI, the global gas engines market size reached around US$ 4.8 Billion in 2022.

What is the demand outlook for the global gas engines market?

The global gas engines market is anticipated to grow at a steady CAGR of 4.1% during the forecast period, reaching over US$ 7.47 Billion by 2032.

Which region holds maximum potential for the growth of gas engines market?

European nations are expected to grow at the highest CAGR during the forecast period.

Who are the leading gas engine manufacturers?

Westport Fuel Systems Inc, Wärtsilä, YANMAR HOLDINGS CO., IHI Power Systems Co., Ltd. (Subsidiary of IHI Corporation), MAN SE, BERGEN engines AS, LIEBHERR, Siemens, INNIO, MITSUBISHI HEAVY INDUSTRIES, LTD are some of the leading gas engine manufacturers.

Table of Content

1. Executive Summary | Gas Engines Market

    1.1. Global Market Outlook

    1.2. Summary of Statistics

    1.3. Key Market Characteristics & Attributes

    1.4. FMI Analysis and Recommendations

2. Market Overview

    2.1. Market Coverage

    2.2. Market Definition

3. Market Risks and Trends Assessment

    3.1. Risk Assessment

        3.1.1. COVID-19 Crisis and Impact on Demand

        3.1.2. COVID-19 Impact Benchmark with Previous Crisis

        3.1.3. Impact on Market Value (US$ Million)

        3.1.4. Assessment by Key Countries

        3.1.5. Assessment by Key Market Segments

        3.1.6. Action Points and Recommendation for Suppliers

    3.2. Key Trends Impacting the Market

    3.3. Formulation and Product Development Trends

4. Market Background

    4.1. Market, by Key Countries

    4.2. Market Opportunity Assessment (US$ Million)

        4.2.1. Total Available Market

        4.2.2. Serviceable Addressable Market

        4.2.3. Serviceable Obtainable Market

    4.3. Market Scenario Forecast

        4.3.1. Demand in Optimistic Scenario

        4.3.2. Demand in Likely Scenario

        4.3.3. Demand in Conservative Scenario

    4.4. Investment Feasibility Analysis

        4.4.1. Investment in Established Markets

            4.4.1.1. In Short Term

            4.4.1.2. In Long Term

        4.4.2. Investment in Emerging Markets

            4.4.2.1. In Short Term

            4.4.2.2. In Long Term

    4.5. Forecast Factors - Relevance & Impact

        4.5.1. Top Companies Historical Growth

        4.5.2. Growth in Automation, By Country

        4.5.3. Adoption Rate, By Country

    4.6. Market Dynamics

        4.6.1. Market Driving Factors and Impact Assessment

        4.6.2. Prominent Market Challenges and Impact Assessment

        4.6.3. Market Opportunities

        4.6.4. Prominent Trends in the Global Market & Their Impact Assessment

5. Key Success Factors

    5.1. Manufacturers’ Focus on Low Penetration High Growth Markets

    5.2. Banking on with Segments High Incremental Opportunity

    5.3. Peer Benchmarking

6. Global Market Demand Analysis 2015 to 2021 and Forecast, 2022 to 2032

    6.1. Historical Market Analysis, 2015 to 2021

    6.2. Current and Future Market Projections, 2022 to 2032

    6.3. Y-o-Y Growth Trend Analysis

7. Global Market Value Analysis 2015 to 2021 and Forecast, 2022 to 2032

    7.1. Historical Market Value (US$ Million) Analysis, 2015 to 2021

    7.2. Current and Future Market Value (US$ Million) Projections, 2022 to 2032

        7.2.1. Y-o-Y Growth Trend Analysis

        7.2.2. Absolute $ Opportunity Analysis

8. Global Market Analysis 2015 to 2021 and Forecast 2022 to 2032, By Fuel Type

    8.1. Introduction / Key Findings

    8.2. Historical Market Size (US$ Million) Analysis By Fuel Type, 2015 to 2021

    8.3. Current and Future Market Size (US$ Million) Analysis and Forecast By Fuel Type, 2022 to 2032

        8.3.1. Natural Gas

        8.3.2. Special Gas

        8.3.3. Others (Coal Gas, Producer Gas, and Propane Gas)

    8.4. Market Attractiveness Analysis By Fuel Type

9. Global Market Analysis 2015 to 2021 and Forecast 2022 to 2032, By End-use

    9.1. Introduction / Key Findings

    9.2. Historical Market Size (US$ Million) Analysis By End-use, 2015 to 2021

    9.3. Current and Future Market Size (US$ Million) Analysis and Forecast By End-use, 2022 to 2032

        9.3.1. Utilities

        9.3.2. Marine

        9.3.3. Oil & Gas

        9.3.4. Manufacturing

        9.3.5. Others (Commercial Complexes, Wastewater Treatment Plants, Hospitals, and Greenhouse Operators)

    9.4. Market Attractiveness Analysis By End-use

10. Global Market Analysis 2015 to 2021 and Forecast 2022 to 2032, By Power Output

    10.1. Introduction / Key Findings

    10.2. Historical Market Size (US$ Million) Analysis By Power Output, 2015 to 2021

    10.3. Current and Future Market Size (US$ Million) Analysis and Forecast By Power Output, 2022 to 2032

        10.3.1. Power Output

        10.3.2. 1-2 MW

        10.3.3. 2-5 MW

        10.3.4. 5-15 MW

        10.3.5. Above 15 MW

    10.4. Market Attractiveness Analysis By Power Output

11. Global Market Analysis 2015 to 2021 and Forecast 2022 to 2032, By Application

    11.1. Introduction / Key Findings

    11.2. Historical Market Size (US$ Million) Analysis By Application, 2015 to 2021

    11.3. Current and Future Market Size (US$ Million) Analysis and Forecast By Application, 2022 to 2032

        11.3.1. Power Generation

        11.3.2. Mechanical Drive

        11.3.3. Cogeneration

        11.3.4. Others (Trigeneration, Quadgeneration, Greenhouse Operations, and Renewable Energy)

    11.4. Market Attractiveness Analysis By Application

12. Global Market Analysis 2015 to 2021 and Forecast 2022 to 2032, By Region

    12.1. Introduction

    12.2. Historical Market Size (US$ Million) Analysis By Region, 2015 to 2021

    12.3. Current Market Size (US$ Million) & Analysis and Forecast By Region, 2022 to 2032

        12.3.1. North America

        12.3.2. Latin America

        12.3.3. Europe

        12.3.4. Asia Pacific

        12.3.5. Middle East and Africa (MEA)

    12.4. Market Attractiveness Analysis By Region

13. North America Market Analysis 2015 to 2021 and Forecast 2022 to 2032

    13.1. Introduction

    13.2. Pricing Analysis

    13.3. Historical Market Value (US$ Million) Trend Analysis By Market Taxonomy, 2015 to 2021

    13.4. Market Value (US$ Million) & Forecast By Market Taxonomy, 2022 to 2032

        13.4.1. By Country

            13.4.1.1. USA

            13.4.1.2. Canada

            13.4.1.3. Rest of North America

        13.4.2. By Fuel Type

        13.4.3. By End-use

        13.4.4. By Application

        13.4.5. By Power Output

    13.5. Market Attractiveness Analysis

        13.5.1. By Country

        13.5.2. By Fuel Type

        13.5.3. By End-use

        13.5.4. By Application

        13.5.5. By Power Output

14. Latin America Market Analysis 2015 to 2021 and Forecast 2022 to 2032

    14.1. Introduction

    14.2. Pricing Analysis

    14.3. Historical Market Value (US$ Million) Trend Analysis By Market Taxonomy, 2015 to 2021

    14.4. Market Value (US$ Million) & Forecast By Market Taxonomy, 2022 to 2032

        14.4.1. By Country

            14.4.1.1. Brazil

            14.4.1.2. Mexico

            14.4.1.3. Rest of Latin America

        14.4.2. By Fuel Type

        14.4.3. By End-use

        14.4.4. By Application

        14.4.5. By Power Output

    14.5. Market Attractiveness Analysis

        14.5.1. By Country

        14.5.2. By Fuel Type

        14.5.3. By End-use

        14.5.4. By Application

        14.5.5. By Power Output

15. Europe Market Analysis 2015 to 2021 and Forecast 2022 to 2032

    15.1. Introduction

    15.2. Pricing Analysis

    15.3. Historical Market Value (US$ Million) Trend Analysis By Market Taxonomy, 2015 to 2021

    15.4. Market Value (US$ Million) & Forecast By Market Taxonomy, 2022 to 2032

        15.4.1. By Country

            15.4.1.1. Germany

            15.4.1.2. France

            15.4.1.3. United Kingdom

            15.4.1.4. Italy

            15.4.1.5. Benelux

            15.4.1.6. Nordic Countries

            15.4.1.7. Rest of Europe

        15.4.2. By Fuel Type

        15.4.3. By End-use

        15.4.4. By Application

        15.4.5. By Power Output

    15.5. Market Attractiveness Analysis

        15.5.1. By Country

        15.5.2. By Fuel Type

        15.5.3. By End-use

        15.5.4. By Application

        15.5.5. By Power Output

16. Asia Pacific Market Analysis 2015 to 2021 and Forecast 2022 to 2032

    16.1. Introduction

    16.2. Pricing Analysis

    16.3. Historical Market Value (US$ Million) Trend Analysis By Market Taxonomy, 2015 to 2021

    16.4. Market Value (US$ Million) & Forecast By Market Taxonomy, 2022 to 2032

        16.4.1. By Country

            16.4.1.1. China

            16.4.1.2. Japan

            16.4.1.3. South Korea

            16.4.1.4. Rest of Asia Pacific

        16.4.2. By Fuel Type

        16.4.3. By End-use

        16.4.4. By Application

        16.4.5. By Power Output

    16.5. Market Attractiveness Analysis

        16.5.1. By Country

        16.5.2. By Fuel Type

        16.5.3. By End-use

        16.5.4. By Application

        16.5.5. By Power Output

17. Middle East and Africa Market Analysis 2015 to 2021 and Forecast 2022 to 2032

    17.1. Introduction

    17.2. Pricing Analysis

    17.3. Historical Market Value (US$ Million) Trend Analysis By Market Taxonomy, 2015 to 2021

    17.4. Market Value (US$ Million) & Forecast By Market Taxonomy, 2022 to 2032

        17.4.1. By Country

            17.4.1.1. GCC Countries

            17.4.1.2. South Africa

            17.4.1.3. Turkey

            17.4.1.4. Rest of Middle East and Africa

        17.4.2. By Fuel Type

        17.4.3. By End-use

        17.4.4. By Application

        17.4.5. By Power Output

    17.5. Market Attractiveness Analysis

        17.5.1. By Country

        17.5.2. By Fuel Type

        17.5.3. By End-use

        17.5.4. By Application

        17.5.5. By Power Output

18. Key Countries Market Analysis 2015 to 2021 and Forecast 2022 to 2032

    18.1. Introduction

        18.1.1. Market Value Proportion Analysis, By Key Countries

        18.1.2. Global Vs. Country Growth Comparison

    18.2. USA Market Analysis

        18.2.1. Value Proportion Analysis by Market Taxonomy

        18.2.2. Value Analysis and Forecast by Market Taxonomy, 2015 to 2032

            18.2.2.1. By Fuel Type

            18.2.2.2. By End-use

            18.2.2.3. By Application

            18.2.2.4. By Power Output

    18.3. Canada Market Analysis

        18.3.1. Value Proportion Analysis by Market Taxonomy

        18.3.2. Value Analysis and Forecast by Market Taxonomy, 2015 to 2032

            18.3.2.1. By Fuel Type

            18.3.2.2. By End-use

            18.3.2.3. By Application

            18.3.2.4. By Power Output

    18.4. Mexico Market Analysis

        18.4.1. Value Proportion Analysis by Market Taxonomy

        18.4.2. Value Analysis and Forecast by Market Taxonomy, 2015 to 2032

            18.4.2.1. By Fuel Type

            18.4.2.2. By End-use

            18.4.2.3. By Application

            18.4.2.4. By Power Output

    18.5. Brazil Market Analysis

        18.5.1. Value Proportion Analysis by Market Taxonomy

        18.5.2. Value Analysis and Forecast by Market Taxonomy, 2015 to 2032

            18.5.2.1. By Fuel Type

            18.5.2.2. By End-use

            18.5.2.3. By Application

            18.5.2.4. By Power Output

    18.6. Germany Market Analysis

        18.6.1. Value Proportion Analysis by Market Taxonomy

        18.6.2. Value Analysis and Forecast by Market Taxonomy, 2015 to 2032

            18.6.2.1. By Fuel Type

            18.6.2.2. By End-use

            18.6.2.3. By Application

            18.6.2.4. By Power Output

    18.7. France Market Analysis

        18.7.1. Value Proportion Analysis by Market Taxonomy

        18.7.2. Value Analysis and Forecast by Market Taxonomy, 2015 to 2032

            18.7.2.1. By Fuel Type

            18.7.2.2. By End-use

            18.7.2.3. By Application

            18.7.2.4. By Power Output

    18.8. Italy Market Analysis

        18.8.1. Value Proportion Analysis by Market Taxonomy

        18.8.2. Value Analysis and Forecast by Market Taxonomy, 2015 to 2032

            18.8.2.1. By Fuel Type

            18.8.2.2. By End-use

            18.8.2.3. By Application

            18.8.2.4. By Power Output

    18.9. BENELUX Market Analysis

        18.9.1. Value Proportion Analysis by Market Taxonomy

        18.9.2. Value Analysis and Forecast by Market Taxonomy, 2015 to 2032

            18.9.2.1. By Fuel Type

            18.9.2.2. By End-use

            18.9.2.3. By Application

            18.9.2.4. By Power Output

    18.10. United Kingdom Market Analysis

        18.10.1. Value Proportion Analysis by Market Taxonomy

        18.10.2. Value Analysis and Forecast by Market Taxonomy, 2015 to 2032

            18.10.2.1. By Fuel Type

            18.10.2.2. By End-use

            18.10.2.3. By Application

            18.10.2.4. By Power Output

    18.11. Nordic Countries Market Analysis

        18.11.1. Value Proportion Analysis by Market Taxonomy

        18.11.2. Value Analysis and Forecast by Market Taxonomy, 2015 to 2032

            18.11.2.1. By Fuel Type

            18.11.2.2. By End-use

            18.11.2.3. By Application

            18.11.2.4. By Power Output

    18.12. China Market Analysis

        18.12.1. Value Proportion Analysis by Market Taxonomy

        18.12.2. Value Analysis and Forecast by Market Taxonomy, 2015 to 2032

            18.12.2.1. By Fuel Type

            18.12.2.2. By End-use

            18.12.2.3. By Application

            18.12.2.4. By Power Output

    18.13. Japan Market Analysis

        18.13.1. Value Proportion Analysis by Market Taxonomy

        18.13.2. Value Analysis and Forecast by Market Taxonomy, 2015 to 2032

            18.13.2.1. By Fuel Type

            18.13.2.2. By End-use

            18.13.2.3. By Application

            18.13.2.4. By Power Output

    18.14. South Korea Market Analysis

        18.14.1. Value Proportion Analysis by Market Taxonomy

        18.14.2. Value Analysis and Forecast by Market Taxonomy, 2015 to 2032

            18.14.2.1. By Fuel Type

            18.14.2.2. By End-use

            18.14.2.3. By Application

            18.14.2.4. By Power Output

    18.15. GCC Countries Market Analysis

        18.15.1. Value Proportion Analysis by Market Taxonomy

        18.15.2. Value Analysis and Forecast by Market Taxonomy, 2015 to 2032

            18.15.2.1. By Fuel Type

            18.15.2.2. By End-use

            18.15.2.3. By Application

            18.15.2.4. By Power Output

    18.16. South Africa Market Analysis

        18.16.1. Value Proportion Analysis by Market Taxonomy

        18.16.2. Value Analysis and Forecast by Market Taxonomy, 2015 to 2032

            18.16.2.1. By Fuel Type

            18.16.2.2. By End-use

            18.16.2.3. By Application

            18.16.2.4. By Power Output

    18.17. Turkey Market Analysis

        18.17.1. Value Proportion Analysis by Market Taxonomy

        18.17.2. Value Analysis and Forecast by Market Taxonomy, 2015 to 2032

            18.17.2.1. By Fuel Type

            18.17.2.2. By End-use

            18.17.2.3. By Application

            18.17.2.4. By Power Output

        18.17.3. Competition Landscape and Player Concentration in the Country

19. Market Structure Analysis

    19.1. Market Analysis by Tier of Companies

    19.2. Market Concentration

    19.3. Market Share Analysis of Top Players

    19.4. Market Presence Analysis

        19.4.1. By Regional Footprint of Players

        19.4.2. Product Footprint by Players

20. Competition Analysis

    20.1. Competition Dashboard

    20.2. Competition Benchmarking

    20.3. Competition Deep Dive

        20.3.1. Caterpillar

            20.3.1.1. Overview

            20.3.1.2. Product Portfolio

            20.3.1.3. Sales Footprint

            20.3.1.4. Strategy Overview

        20.3.2. WÄRTSILÄ

            20.3.2.1. Overview

            20.3.2.2. Product Portfolio

            20.3.2.3. Sales Footprint

            20.3.2.4. Strategy Overview

        20.3.3. Rolls-Royce Holdings

            20.3.3.1. Overview

            20.3.3.2. Product Portfolio

            20.3.3.3. Sales Footprint

            20.3.3.4. Strategy Overview

        20.3.4. Cummins

            20.3.4.1. Overview

            20.3.4.2. Product Portfolio

            20.3.4.3. Sales Footprint

            20.3.4.4. Strategy Overview

        20.3.5. Volkswagen (MAN Energy Solutions)

            20.3.5.1. Overview

            20.3.5.2. Product Portfolio

            20.3.5.3. Sales Footprint

            20.3.5.4. Strategy Overview

        20.3.6. Siemens Energy

            20.3.6.1. Overview

            20.3.6.2. Product Portfolio

            20.3.6.3. Sales Footprint

            20.3.6.4. Strategy Overview

        20.3.7. Mitsubishi Heavy Industries Ltd.

            20.3.7.1. Overview

            20.3.7.2. Product Portfolio

            20.3.7.3. Sales Footprint

            20.3.7.4. Strategy Overview

        20.3.8. INNIO

            20.3.8.1. Overview

            20.3.8.2. Product Portfolio

            20.3.8.3. Sales Footprint

            20.3.8.4. Strategy Overview

        20.3.9. Kawasaki Heavy Industries LTD.

            20.3.9.1. Overview

            20.3.9.2. Product Portfolio

            20.3.9.3. Sales Footprint

            20.3.9.4. Strategy Overview

        20.3.10. Ningbo C.S.I Power & Machinery Group Co. Ltd.

            20.3.10.1. Overview

            20.3.10.2. Product Portfolio

            20.3.10.3. Sales Footprint

            20.3.10.4. Strategy Overview

21. Assumptions and Acronyms Used

22. Research Methodology

Don't pay for what you don't need

Customize your report by selecting specific countries or regions and save 30%!

List of Tables

Table 1: Global Market Value (US$ Million), By Fuel Type, 2015 to 2021

Table 2: Global Market Value (US$ Million), By Fuel Type, 2022 to 2032

Table 3: Global Market Value (US$ Million), By End-use, 2015 to 2021

Table 4: Global Market Value (US$ Million), By End-use, 2022 to 2032

Table 5: Global Market Value (US$ Million), By Power Output, 2015 to 2021

Table 6: Global Market Value (US$ Million), By Power Output, 2022 to 2032

Table 7: Global Market Value (US$ Million), By Application, 2015 to 2021

Table 8: Global Market Value (US$ Million), By Application, 2022 to 2032

Table 9: Global Market, By Region, 2015 to 2021

Table 10: Global Market, By Region, 2022 to 2032

Table 11: North America Market Value (US$ Million), By Fuel Type, 2015 to 2021

Table 12: North America Market Value (US$ Million), By Fuel Type, 2022 to 2032

Table 13: North America Market Value (US$ Million), By End-use, 2015 to 2021

Table 14: North America Market Value (US$ Million), By End-use, 2022 to 2032

Table 15: North America Market Value (US$ Million), By Power Output, 2015 to 2021

Table 16: North America Market Value (US$ Million), By Power Output, 2022 to 2032

Table 17: North America Market Value (US$ Million), By Application, 2015 to 2021

Table 18: North America Market Value (US$ Million), By Application, 2022 to 2032

Table 19: North America Market, By Country, 2015 to 2021

Table 20: North America Market, By Country, 2022 to 2032

Table 21: Latin America Market Value (US$ Million), By Fuel Type, 2015 to 2021

Table 22: Latin America Market Value (US$ Million), By Fuel Type, 2022 to 2032

Table 23: Latin America Market Value (US$ Million), By End-use, 2015 to 2021

Table 24: Latin America Market Value (US$ Million), By End-use, 2022 to 2032

Table 25: Latin America Market Value (US$ Million), By Power Output, 2015 to 2021

Table 26: Latin America Market Value (US$ Million), By Power Output, 2022 to 2032

Table 27: Latin America Market Value (US$ Million), By Application, 2015 to 2021

Table 28: Latin America Market Value (US$ Million), By Application, 2022 to 2032

Table 29: Latin America Market, By Country, 2015 to 2021

Table 30: Latin America Market, By Country, 2022 to 2032

Table 31: Europe Market Value (US$ Million), By Fuel Type, 2015 to 2021

Table 32: Europe Market Value (US$ Million), By Fuel Type, 2022 to 2032

Table 33: Europe Market Value (US$ Million), By End-use, 2015 to 2021

Table 34: Europe Market Value (US$ Million), By End-use, 2022 to 2032

Table 35: Europe Market Value (US$ Million), By Power Output, 2015 to 2021

Table 36: Europe Market Value (US$ Million), By Power Output, 2022 to 2032

Table 37: Europe Market Value (US$ Million), By Application, 2015 to 2021

Table 38: Europe Market Value (US$ Million), By Application, 2022 to 2032

Table 39: Europe Market, By Country, 2015 to 2021

Table 40: Europe Market, By Country, 2022 to 2032

Table 41: Asia Pacific Market Value (US$ Million), By Fuel Type, 2015 to 2021

Table 42: Asia Pacific Market Value (US$ Million), By Fuel Type, 2022 to 2032

Table 43: Asia Pacific Market Value (US$ Million), By End-use, 2015 to 2021

Table 44: Asia Pacific Market Value (US$ Million), By End-use, 2022 to 2032

Table 45: Asia Pacific Market Value (US$ Million), By Power Output, 2015 to 2021

Table 46: Asia Pacific Market Value (US$ Million), By Power Output, 2022 to 2032

Table 47: Asia Pacific Market Value (US$ Million), By Application, 2015 to 2021

Table 48: Asia Pacific Market Value (US$ Million), By Application, 2022 to 2032

Table 49: Asia Pacific Market, By Country, 2015 to 2021

Table 50: Asia Pacific Market, By Country, 2022 to 2032

Table 51: MEA Market Value (US$ Million), By Fuel Type, 2015 to 2021

Table 52: MEA Market Value (US$ Million), By Fuel Type, 2022 to 2032

Table 53: MEA Market Value (US$ Million), By End-use, 2015 to 2021

Table 54: MEA Market Value (US$ Million), By End-use, 2022 to 2032

Table 55: MEA Market Value (US$ Million), By Power Output, 2015 to 2021

Table 56: MEA Market Value (US$ Million), By Power Output, 2022 to 2032

Table 57: MEA Market Value (US$ Million), By Application, 2015 to 2021

Table 58: MEA Market Value (US$ Million), By Application, 2022 to 2032

Table 59: MEA Market, By Country, 2015 to 2021

Table 60: MEA Market, By Country, 2022 to 2032
Nikhil Kaitwade
Nikhil Kaitwade

Principal Consultant

Talk to Analyst

Find your sweet spots for generating winning opportunities in this market.

List of Charts

Figure 1: Global Market Value (US$ Million) and Year-on-Year Growth, 2015 to 2032

Figure 2: Global Market Absolute $ Historical Gain (2015 to 2021) and Opportunity (2022 to 2032), US$ Million

Figure 3: Global Market Share, By Fuel Type, 2022 & 2032

Figure 4: Global Market Y-o-Y Growth Projections, By Fuel Type – 2022 to 2032

Figure 5: Global Market Attractiveness Index, By Fuel Type – 2022 to 2032

Figure 6: Global Market Share, By End-use, 2022 & 2032

Figure 7: Global Market Y-o-Y Growth Projections, By End-use – 2022 to 2032

Figure 8: Global Market Attractiveness Index, By End-use – 2022 to 2032

Figure 9: Global Market Share, By Application, 2022 & 2032

Figure 10: Global Market Y-o-Y Growth Projections, By Application – 2022 to 2032

Figure 11: Global Market Attractiveness Index, By Application – 2022 to 2032

Figure 12: Global Market Share, By Power Output, 2022 & 2032

Figure 13: Global Market Y-o-Y Growth Projections, By Power Output – 2022 to 2032

Figure 14: Global Market Attractiveness Index, By Power Output – 2022 to 2032

Figure 15: Global Market Share, By Region, 2022 & 2032

Figure 16: Global Market Y-o-Y Growth Projections, By Region – 2022 to 2032

Figure 17: Global Market Attractiveness Index, By Region – 2022 to 2032

Figure 18: North America Market Value (US$ Million) and Year-on-Year Growth, 2015 to 2032

Figure 19: North America Market Absolute $ Opportunity Historical (2015 to 2021) and Forecast Period (2022 to 2032), US$ Million

Figure 20: North America Market Share, By Fuel Type, 2022 & 2032

Figure 21: North America Market Y-o-Y Growth Projections, By Fuel Type – 2022 to 2032

Figure 22: North America Market Attractiveness Index, By Fuel Type – 2022 to 2032

Figure 23: North America Market Share, By End-use, 2022 & 2032

Figure 24: North America Market Y-o-Y Growth Projections, By End-use – 2022 to 2032

Figure 25: North America Market Attractiveness Index, By End-use – 2022 to 2032

Figure 26: North America Market Share, By Application, 2022 & 2032

Figure 27: North America Market Y-o-Y Growth Projections, By Application – 2022 to 2032

Figure 28: North America Market Attractiveness Index, By Application – 2022 to 2032

Figure 29: North America Market Share, By Power Output, 2022 & 2032

Figure 30: North America Market Y-o-Y Growth Projections, By Power Output – 2022 to 2032

Figure 31: North America Market Attractiveness Index, By Power Output – 2022 to 2032

Figure 32: North America Market Share, By Country, 2022 & 2032

Figure 33: North America Market Y-o-Y Growth Projections, By Country – 2022 to 2032

Figure 34: North America Market Attractiveness Index, By Country – 2022 to 2032

Figure 35: Latin America Market Value (US$ Million) and Year-on-Year Growth, 2015 to 2032

Figure 36: Latin America Market Absolute $ Opportunity Historical (2015 to 2021) and Forecast Period (2022 to 2032), US$ Million

Figure 37: Latin America Market Share, By Fuel Type, 2022 & 2032

Figure 38: Latin America Market Y-o-Y Growth Projections, By Fuel Type – 2022 to 2032

Figure 39: Latin America Market Attractiveness Index, By Fuel Type – 2022 to 2032

Figure 40: Latin America Market Share, By End-use, 2022 & 2032

Figure 41: Latin America Market Y-o-Y Growth Projections, By End-use – 2022 to 2032

Figure 42: Latin America Market Attractiveness Index, By End-use – 2022 to 2032

Figure 43: Latin America Market Share, By Application, 2022 & 2032

Figure 44: Latin America Market Y-o-Y Growth Projections, By Application – 2022 to 2032

Figure 45: Latin America Market Attractiveness Index, By Application – 2022 to 2032

Figure 46: Latin America Market Share, By Power Output, 2022 & 2032

Figure 47: Latin America Market Y-o-Y Growth Projections, By Power Output – 2022 to 2032

Figure 48: Latin America Market Attractiveness Index, By Power Output – 2022 to 2032

Figure 49: Latin America Market Share, By Country, 2022 & 2032

Figure 50: Latin America Market Y-o-Y Growth Projections, By Country – 2022 to 2032

Figure 51: Latin America Market Attractiveness Index, By Country – 2022 to 2032

Figure 52: Europe Market Value (US$ Million) and Year-on-Year Growth, 2015 to 2032

Figure 53: Europe Market Absolute $ Opportunity Historical (2015 to 2021) and Forecast Period (2022 to 2032), US$ Million

Figure 54: Europe Market Share, By Fuel Type, 2022 & 2032

Figure 55: Europe Market Y-o-Y Growth Projections, By Fuel Type – 2022 to 2032

Figure 56: Europe Market Attractiveness Index, By Fuel Type – 2022 to 2032

Figure 57: Europe Market Share, By End-use, 2022 & 2032

Figure 58: Europe Market Y-o-Y Growth Projections, By End-use – 2022 to 2032

Figure 59: Europe Market Attractiveness Index, By End-use – 2022 to 2032

Figure 60: Europe Market Share, By Application, 2022 & 2032

Figure 61: Europe Market Y-o-Y Growth Projections, By Application – 2022 to 2032

Figure 62: Europe Market Attractiveness Index, By Application – 2022 to 2032

Figure 63: Europe Market Share, By Power Output, 2022 & 2032

Figure 64: Europe Market Y-o-Y Growth Projections, By Power Output – 2022 to 2032

Figure 65: Europe Market Attractiveness Index, By Power Output – 2022 to 2032

Figure 66: Europe Market Share, By Country, 2022 & 2032

Figure 67: Europe Market Y-o-Y Growth Projections, By Country – 2022 to 2032

Figure 68: Europe Market Attractiveness Index, By Country – 2022 to 2032

Figure 69: MEA Market Value (US$ Million) and Year-on-Year Growth, 2015 to 2032

Figure 70: MEA Market Absolute $ Opportunity Historical (2015 to 2021) and Forecast Period (2022 to 2032), US$ Million

Figure 71: MEA Market Share, By Fuel Type, 2022 & 2032

Figure 72: MEA Market Y-o-Y Growth Projections, By Fuel Type – 2022 to 2032

Figure 73: MEA Market Attractiveness Index, By Fuel Type – 2022 to 2032

Figure 74: MEA Market Share, By End-use, 2022 & 2032

Figure 75: MEA Market Y-o-Y Growth Projections, By End-use – 2022 to 2032

Figure 76: MEA Market Attractiveness Index, By End-use – 2022 to 2032

Figure 77: MEA Market Share, By Application, 2022 & 2032

Figure 78: MEA Market Y-o-Y Growth Projections, By Application – 2022 to 2032

Figure 79: MEA Market Attractiveness Index, By Application – 2022 to 2032

Figure 80: MEA Market Share, By Power Output, 2022 & 2032

Figure 81: MEA Market Y-o-Y Growth Projections, By Power Output – 2022 to 2032

Figure 82: MEA Market Attractiveness Index, By Power Output – 2022 to 2032

Figure 83: MEA Market Share, By Country, 2022 & 2032

Figure 84: MEA Market Y-o-Y Growth Projections, By Country – 2022 to 2032

Figure 85: MEA Market Attractiveness Index, By Country – 2022 to 2032

Figure 86: Asia Pacific Market Value (US$ Million) and Year-on-Year Growth, 2015 to 2032

Figure 87: Asia Pacific Market Absolute $ Opportunity Historical (2015 to 2021) and Forecast Period (2022 to 2032), US$ Million

Figure 88: Asia Pacific Market Share, By Fuel Type, 2022 & 2032

Figure 89: Asia Pacific Market Y-o-Y Growth Projections, By Fuel Type – 2022 to 2032

Figure 90: Asia Pacific Market Attractiveness Index, By Fuel Type – 2022 to 2032

Figure 91: Asia Pacific Market Share, By End-use, 2022 & 2032

Figure 92: Asia Pacific Market Y-o-Y Growth Projections, By End-use – 2022 to 2032

Figure 93: Asia Pacific Market Attractiveness Index, By End-use – 2022 to 2032

Figure 94: Asia Pacific Market Share, By Application, 2022 & 2032

Figure 95: Asia Pacific Market Y-o-Y Growth Projections, By Application – 2022 to 2032

Figure 96: Asia Pacific Market Attractiveness Index, By Application – 2022 to 2032

Figure 97: Asia Pacific Market Share, By Power Output, 2022 & 2032

Figure 98: Asia Pacific Market Y-o-Y Growth Projections, By Power Output – 2022 to 2032

Figure 99: Asia Pacific Market Attractiveness Index, By Power Output – 2022 to 2032

Figure 100: Asia Pacific Market Share, By Country, 2022 & 2032

Figure 101: Asia Pacific Market Y-o-Y Growth Projections, By Country – 2022 to 2032

Figure 102: Asia Pacific Market Attractiveness Index, By Country – 2022 to 2032

Recommendations

Oil and Gas

Gas Generator Sets Market

Published : May 2023

Oil and Gas

Flare Gas Recovery System Market

Published : October 2021

Explore Oil and Gas Insights

View Reports