Gas Insulated Substation Market
Market Insights on Gas Insulated Substation covering sales outlook, demand forecast & up-to-date key trends
Gas Insulated Substation Market By Basis of Installation (Indoor, Outdoor), Voltage Rating (Medium voltage (Up to 72.5 kV), High Voltage (72.5 kV - 220 kV)), End-user (Power Transmission and Distribution, Manufacturing and Processing) & Region - Forecast 2021 - 2031
Gas Insulated Substation Market Analysis
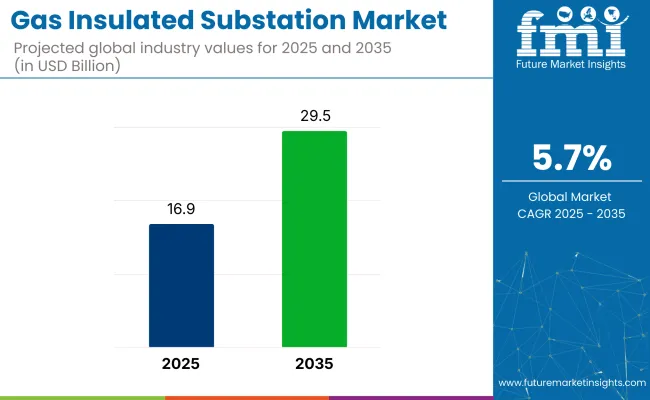
[250+ Pages Report] According to the latest Future Market Insights (FMI) analysis, sales in the gas insulated substation market are expected to top US$ 12.5 Bn by 2021. Growth outlook remains positive as the market is assessed to register 5.7% CAGR between 2021 and 2031.
FMI has identified General Electric, Hitachi Ltd., ABB, Infosys, SIEMENS AG, and Mitsubishi Electric Corporation as leading players in the gas insulated substation market. The top ten market players are expected to account for nearly half of demand registered through the forecast period.
Base Year Value (2020A) |
US$ 11.9 Bn |
Estimated Year Value (2021E) |
US$ 12.5 Bn |
Projected Year Value (2031F) |
US$ 21.7 Mn |
Value CAGR (2021-2031) |
5.70% |
Collective Value Share: Top 3 Countries (2021E) |
60% |
Let us know your requirement to get
100% FREE customization
2016-2020 Gas Insulated Substation Market Outlook Compared to 2021-2031 Forecast
Driven by increase focus on research and development and investment in power generation sector, the gas insulated substation market will rise at 5.7% CAGR between 2021 and 2031 in comparison above 3.8% CAGR registered during 2016-2020.
Over the forecast period, the growing demand for small, low-maintenance power systems is expected to drive the market. In comparison to air-insulated substations, gas insulated ones have higher efficiency and dependability.
Because gas-insulated substations require less area than their equivalents, rising per hectare land values are predicted to stimulate prospects for expansion. Due to their lower space use, these substations require 90% less area than other power plants which is key factor enabling growth in the market.
Market growth is predicted to be driven by rising energy consumption in emerging nations as a result of changing lifestyle and increasing per capita income. It is predicted to gain traction in the market since it can be planted in a small space also it protects the environment using sulphur hexafluoride gas whereas Air-insulated substations are more likely to pollute the environment, whereas gas-insulated substations are more environmental friendly.
Leading manufacturing companies are focusing on expanding their product offering and are employing omni channel sales channels across various regional markets. To improve their revenue generation, companies are directly making contracts and proposal bidding with end users and governments, which is helping them in revenue generation.
Rising safety concerns, reliability, and substation security are projected to fuel demand in the market in the coming years. Longer life span and one-time investment requirement for gas insulated substations are expected to continue to driving the market.
Since the sulphur hexafluoride is a greenhouse gas, its use in substations can impact the market growth. However its market is expected to grow at a higher rate owing to its advantages over other options.
What Is the Impact of Industrialization on Gas Insulated Substation Market?
Rapid industrialization witnessed worldwide has positively affected the gas insulated substation market. The ongoing development of various manufacturing firms across the globe has increased the demand for electricity. Several industries and government organizations across various regions have increased their expenditures on the power generation sector owing to the raising demand of electricity from Industrial sector. This has increased the demand of gas insulate substations across the globe.
What Is the Impact Of COVID-19 Crisis On Gas Insulated Substation Market?
The COVID-19 had a negative impact on the market since lockdown was imposed across various countries by local governments. Limited production and transportation-related delays owing to travel restriction created obstacles amid the pandemic.
Economies are steadily recovering from the effect. Company activities have begun to grow at a slow and steady pace as supply and distribution networks recovered. Against this backdrop, production activities have begun and restrictions related to transportations are now removed by governments.
Considering this, the pandemic is unlikely to have a long-term effect on the Gas Insulated Substation market.
Find your sweet spots for generating winning opportunities in this market.
Talk to AnalystCountry-wise Insights
How big is the Opportunity for Gas Insulated Substation Market in the China?
East Asia is predicted to remain one of the most attractive markets during the forecast period, according to Future Market Insights. China is expected to be the largest market in East Asia and surpass US$ 2.9 Bn by 2031.
Industrialization in China has resulted in higher demand for the electricity. This coupled with the growing investment in the power generation & utility sector is the key factor fuelling the demand for gas insulated substation in China.
Electricity consumption in China is increasing in response to the rapid industrialization. As a result, the country will emerge as a leading market for gas insulated substation in East Asia.
Why is Demand for Gas Insulated Substation Increasing in the India?
Demand in the India market is expected to rise at nearly 6.4% CAGR over the forecast period. The India’s industrial sector is one the fastest growing in South Asia. It also has resulted in the higher demand for the energy. This, coupled with the growing population in the nation has also exceeded the electricity consumption. Consequently, the demand for gas insulated substation is likely to accelerate in India over the coming years.
The report has identified India as a primary market, and it is expected to continue exhibiting high demand for gas insulated substation through the forecast period. With power generation and distribution by government picking up pace, in response to industrialization and urbanization in India, sales of gas insulated substation are likely to pick up pace.
Category-wise Insights
Why the Demand for Indoor Gas Insulated Substation Continuously Rising?
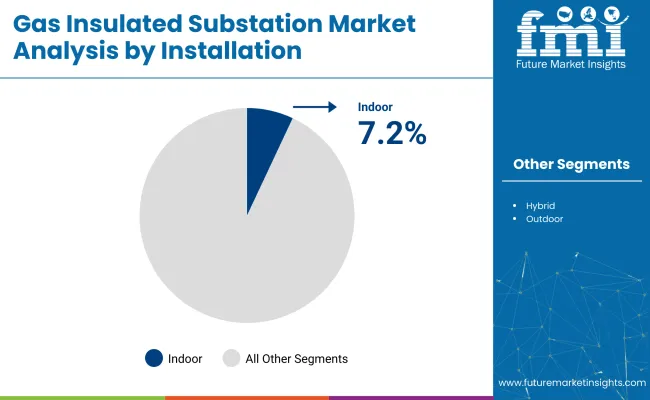
Based on installation base, indoor gas insulated substation is the leading category, accounting for nearly 75% of the market in 2021. Reasons behind such excessive demand are that indoor substations can be planted where area of is small. They also can be installed in residential areas and industrial complexes where uninterrupted power is vital. Besides this, indoor gas substation can be installed in mountainous regions and valleys, and in underground locations. Indoor substations are considers as most reliable power source which makes it highly sought-after in various applications.
Who is the Leading End User of Gas Insulated Substation?
Power transmission and distribution sector is expected to hold the highest market share in gas insulated substation market and is expected to reach at the market value of US$ 12.7 Bn by 2031.
The primary reason behind the demand from the power transmission and distribution sector is the rapidly growing demand for electricity across the globe due to growing population and development in industrial & residential sector.
Why the Demand for High Voltage (72.5 kV – 220 kV) Rising?
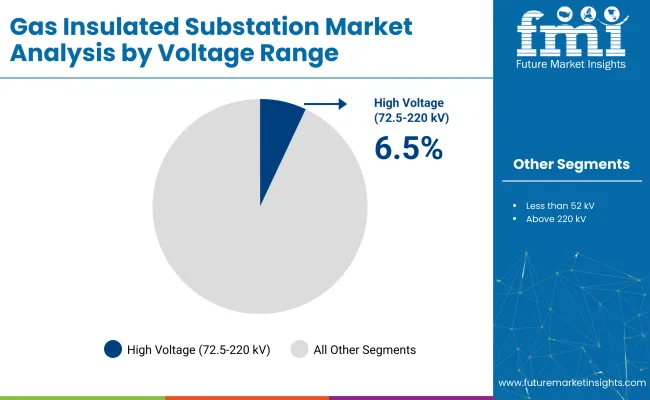
Based on voltage rating, high voltage (72.5 kV – 220 kV) makes the leading category, accounting for nearly 45% of the market in 2021, reason behind high demand is that this voltage range is attribute to maximum number of applications in various end use Industries.
High Voltage (72.5 kV – 220 kV) gas insulated substations are expected to remain top choice for many end users since they significantly reduce storage space and are considered cost-effective & reliable solution for electricity generation.

An unified Market Research Subscription Platform, built for today’s disparate research needs.
Competitive Landscape
Companies operating in gas insulated substation market are aiming at strategic collaborations and partnerships with other manufacturers to expand their production capacity. They also are continuously investing in R&D activities to introduce innovative solutions to the market.
Besides this, they are focusing on the expansion of manufacturing facilities globally to maintain their global presence. Manufacturers are targeting East Asia & South Asia Pacific region as these are the emerging markets.
Scope of Report
Attribute |
Details |
Forecast Period |
2021-2031 |
Historical Data Available for |
2016-2020 |
Market Analysis |
USD Million for Value |
Key Regions Covered |
North America, Latin America, Europe, East Asia, South Asia, Oceania, and the Middle East & Africa |
Key Countries Covered |
US, Canada, Germany, U.K., France, Italy, Spain, BENELUX, Russia, China, Japan, South Korea, India, ASEAN, Australia, New Zealand, GCC Countries, Turkey, and South Africa |
Key Segments Covered |
By Voltage Rating, By Base of installation, End User and Region |
Key Companies Profiled |
|
Report Coverage |
Market Forecast, Company Share Analysis, Competition Intelligence, DROT Analysis, Market Dynamics and Challenges, and Strategic Growth Initiatives |
Customization & Pricing |
Available upon Request |
Gas Insulated Substation Market by Category
By Basis of Installation:
- Indoor
- Outdoor
By Voltage Rating:
- Medium voltage (Up to 72.5 kV)
- High Voltage (72.5 kV – 220 kV)
- Ultra High Voltage (220 kV – 765 kV)
By End-user:
- Power Transmission and Distribution
- Manufacturing and Processing
By Region:
- North America
- Latin America
- Europe
- East Asia
- South Asia & Pacific
- Middle East and Africa (MEA)
Frequently Asked Questions
The gas insulated substation market is expected to total US$ 12.5 Bn in 2021.
The demand for gas insulated substation market is expected to grow by 5.1% between 2020 and 2021.
The market is expected to exhibit growth at 5.7% CAGR between 2021 and 2031.
General Electric, ABB, SIEMENS AG, Mitsubishi Electric Corporation and Toshiba Corporation are the leading market players.
The U.S., Japan and Germany are the leading producers in the market.
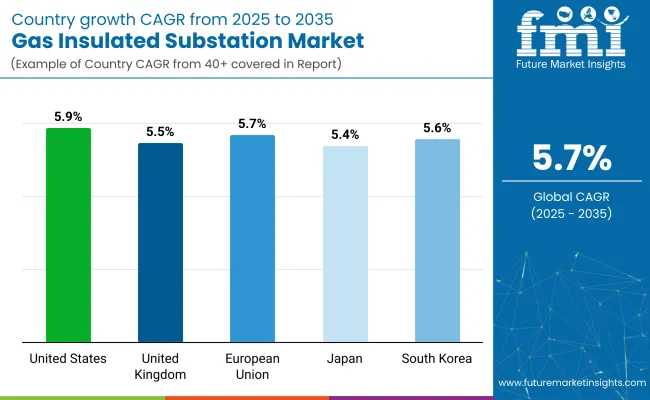
The gas insulated substation market in North America is expected to grow at 5.6% CAGR.
The Europe market is expected to register growth at 5.2% CAGR between 2021 and 2031.
Japan and South Korea are expected to account for 12% of the global gas insulated substation market in 2021.
Table of Content
1. Executive Summary
1.1. Global Market Outlook
1.2. Demand Side Trends
1.3. Supply Side Trends
1.4. Technology Roadmap
1.5. Analysis and Recommendations
2. Market Overview
2.1. Market Coverage / Taxonomy
2.2. Market Definition / Scope / Limitations
3. Key Market Trends
3.1. Key Trends Impacting the Market
3.2. Product Innovation / Development Trends
4. Key Success Factors
5. Global Gas Insulated Substation Market - Pricing Analysis
6. Global Gas Insulated Substation Market Demand (in Value or Size in US$ Mn) Analysis 2016-2020 and Forecast, 2021-2031
6.1. Historical Market Value (US$ Mn) Analysis, 2016-2020
6.2. Current and Future Market Value (US$ Mn) Projections, 2021-2031
6.2.1. Y-o-Y Growth Trend Analysis
6.2.2. Absolute $ Opportunity Analysis
7. Market Background
7.1. Macro-Economic Factors
7.1.1. Power Transmission and Distribution Systems Market Growth outlook
7.1.2. Substations Market Overview
7.2. Global Powergrid Market growth Outlook
7.3. Global Electricity Consumption Annual Rate by respective End Use Sectors
7.4. Forecast Factors - Relevance & Impact
7.4.1. Demand from Civic Power utilities
7.4.2. Demand from General manufacturing
7.4.3. Demand from heavy Industries
7.4.4. Expansion of networks
7.4.5. Frequency of maintenance programs
7.4.6. Penetration Degree of Automation
7.5. Value Chain Analysis
7.6. Market Dynamics
7.6.1. Drivers
7.6.2. Restraints
7.6.3. Opportunity Analysis
7.7. COVID - 19 Crisis: Impact Assessment
7.7.1. Current Statistics
7.7.2. Short-Mid-Long Term Outlook
7.7.3. Likely Rebound
8. Global Gas Insulated Substation Market Analysis 2016-2020 and Forecast 2021-2031, By Base of Installation
8.1. Introduction / Key Findings
8.2. Historical Market Size (US$ Mn) Analysis By Base of Installation, 2016 - 2020
8.3. Current and Future Market Size (US$ Mn) Analysis and Forecast By Base of Installation, 2021 - 2031
8.3.1. Indoor
8.3.2. Outdoor
8.4. Market Attractiveness Analysis By Base of Installation
9. Global Gas Insulated Substation Market Analysis 2016-2020 and Forecast 2021-2031, By Voltage Rating
9.1. Introduction / Key Findings
9.2. Historical Market Size (US$ Mn) Analysis By Voltage Rating,2016 - 2020
9.3. Current and Future Market Size (US$ Mn) Analysis and Forecast By Voltage Rating, 2021 - 2031
9.3.1. Medium voltage (Up to 72.5 kV)
9.3.2. High Voltage (72.5 kV – 220 kV)
9.3.3. Ultra High Voltage (220 kV – 765 kV)
9.4. Market Attractiveness Analysis By Voltage Rating
10. Global Gas Insulated Substation Market Analysis 2016-2020 and Forecast 2021-2031, By End Use
10.1. Introduction / Key Findings
10.2. Historical Market Size (US$ Mn) Analysis By End Use , 2016 - 2020
10.3. Current and Future Market Size (US$ Mn) Analysis and Forecast By End Use , 2021 - 2031
10.3.1. Power Transmission and Distribution
10.3.2. Manufacturing and Processing
10.4. Market Attractiveness Analysis By End Use
11. Global Gas Insulated Substation Market Analysis 2016-2020 and Forecast 2021-2031, By Region
11.1. Introduction / Key Findings
11.2. Historical Market Size (US$ Mn) Analysis By Region, 2016 - 2020
11.3. Current and Future Market Size (US$ Mn) Analysis and Forecast By Region, 2021 - 2031
11.3.1. North America
11.3.2. Latin America
11.3.3. Europe
11.3.4. East Asia
11.3.5. South Asia Pacific
11.3.6. Middle East and Africa
11.4. Market Attractiveness Analysis By Base of Installation
12. North America Gas Insulated Substation Market Analysis 2016-2020 and Forecast 2021-2031
12.1. Introduction
12.2. Pricing Analysis
12.3. Historical Market Size (US$ Mn) Trend Analysis By Market Taxonomy, 2016 - 2020
12.4. Market Size (US$ Mn) Forecast By Market Taxonomy, 2021 - 2031
12.4.1. By Country
12.4.1.1. U.S.
12.4.1.2. Canada
12.4.2. By Base of Installation
12.4.3. By Voltage Rating
12.4.4. By End Use
12.5. Market Attractiveness Analysis
12.5.1. By Country
12.5.2. By Base of Installation
12.5.3. By Voltage Rating
12.5.4. By End Use
13. Latin America Gas Insulated Substation Market Analysis 2016-2020 and Forecast 2021-2031
13.1. Introduction
13.2. Pricing Analysis
13.3. Historical Market Size (US$ Mn) Trend Analysis By Market Taxonomy, 2016 - 2020
13.4. Market Size (US$ Mn) Forecast By Market Taxonomy, 2021 - 2031
13.4.1. By Country
13.4.1.1. Brazil
13.4.1.2. Mexico
13.4.1.3. Rest of LATAM
13.4.2. By Base of Installation
13.4.3. By Voltage Rating
13.4.4. By End Use
13.5. Market Attractiveness Analysis
13.5.1. By Country
13.5.2. By Base of Installation
13.5.3. By Voltage Rating
13.5.4. By End Use
14. Europe Gas Insulated Substation Market Analysis 2016-2020 and Forecast 2021-2031
14.1. Introduction
14.2. Pricing Analysis
14.3. Historical Market Size (US$ Mn) Trend Analysis By Market Taxonomy, 2016 - 2020
14.4. Market Size (US$ Mn) Forecast By Market Taxonomy, 2021 - 2031
14.4.1. By Country
14.4.1.1. Germany
14.4.1.2. Italy
14.4.1.3. France
14.4.1.4. UK
14.4.1.5. Spain
14.4.1.6. BENELUX
14.4.1.7. NORDICS
14.4.1.8. Russia
14.4.1.9. Rest of Europe
14.4.2. By Base of Installation
14.4.3. By Voltage Rating
14.4.4. By End Use
14.5. Market Attractiveness Analysis
14.5.1. By Country
14.5.2. By Base of Installation
14.5.3. By Voltage Rating
14.5.4. By End Use
15. East Asia Gas Insulated Substation Market Analysis 2016-2020 and Forecast 2021-2031
15.1. Introduction
15.2. Pricing Analysis
15.3. Historical Market Size (US$ Mn) Trend Analysis By Market Taxonomy, 2016 - 2020
15.4. Market Size (US$ Mn) Forecast By Market Taxonomy, 2021 - 2031
15.4.1. By Country
15.4.1.1. China
15.4.1.2. Japan
15.4.1.3. South Korea
15.4.2. By Base of Installation
15.4.3. By Voltage Rating
15.4.4. By End Use
15.5. Market Attractiveness Analysis
15.5.1. By Country
15.5.2. By Base of Installation
15.5.3. By Voltage Rating
15.5.4. By End Use
16. South Asia Pacific Gas Insulated Substation Market Analysis 2016-2020 and Forecast 2021-2031
16.1. Introduction
16.2. Pricing Analysis
16.3. Historical Market Size (US$ Mn) Trend Analysis By Market Taxonomy, 2016 - 2020
16.4. Market Size (US$ Mn) Forecast By Market Taxonomy, 2021 - 2031
16.4.1. By Country
16.4.1.1. India
16.4.1.2. ASEAN
16.4.1.3. ANZ
16.4.1.4. Rest of SAP
16.4.2. By Base of Installation
16.4.3. By Voltage Rating
16.4.4. By End Use
16.5. Market Attractiveness Analysis
16.5.1. By Country
16.5.2. By Base of Installation
16.5.3. By Voltage Rating
16.5.4. By End Use
17. Middle East and Africa Gas Insulated Substation Market Analysis 2016-2020 and Forecast 1921-1931
17.1. Introduction
17.2. Pricing Analysis
17.3. Historical Market Size (US$ Mn) Trend Analysis By Market Taxonomy, 2016-2020
17.4. Market Size (US$ Mn) Forecast By Market Taxonomy, 2021 - 2031
17.4.1. By Country
17.4.1.1. GCC Countries
17.4.1.2. Turkey
17.4.1.3. South Africa
17.4.1.4. Rest of MEA
17.4.2. By Base of Installation
17.4.3. By Voltage Rating
17.4.4. By End Use
17.5. Market Attractiveness Analysis
17.5.1. By Country
17.5.2. By Base of Installation
17.5.3. By Voltage Rating
17.5.4. By End Use
18. Key and Emerging Countries for Gas Insulated Substation Market Analysis
18.1. Introduction
18.1.1. Market Value Proportion Analysis, By Key Countries
18.1.2. Global V.S. Country Growth Comparison
18.2. U.S. Gas Insulated Substation Market Analysis
18.2.1. By Base of Installation
18.2.2. By Voltage Rating
18.2.3. By End Use
18.3. Canada Gas Insulated Substation Market Analysis
18.3.1. By Base of Installation
18.3.2. By Voltage Rating
18.3.3. By End Use
18.4. Brazil Gas Insulated Substation Market Analysis
18.4.1. By Base of Installation
18.4.2. By Voltage Rating
18.4.3. By End Use
18.5. Mexico Gas Insulated Substation Market Analysis
18.5.1. By Base of Installation
18.5.2. By Voltage Rating
18.5.3. By End Use
18.6. Germany Gas Insulated Substation Market Analysis
18.6.1. By Base of Installation
18.6.2. By Voltage Rating
18.6.3. By End Use
18.7. Italy Gas Insulated Substation Market Analysis
18.7.1. By Base of Installation
18.7.2. By Voltage Rating
18.7.3. By End Use
18.8. France Gas Insulated Substation Market Analysis
18.8.1. By Base of Installation
18.8.2. By Voltage Rating
18.8.3. By End Use
18.9. UK Gas Insulated Substation Market Analysis
18.9.1. By Base of Installation
18.9.2. By Voltage Rating
18.9.3. By End Use
18.10. Spain Gas Insulated Substation Market Analysis
18.10.1. By Base of Installation
18.10.2. By Voltage Rating
18.10.3. By End Use
18.11. BENELUX Gas Insulated Substation Market Analysis
18.11.1. By Base of Installation
18.11.2. By Voltage Rating
18.11.3. By End Use
18.12. Russia Gas Insulated Substation Market Analysis
18.12.1. By Base of Installation
18.12.2. By Voltage Rating
18.12.3. By End Use
18.13. China Gas Insulated Substation Market Analysis
18.13.1. By Base of Installation
18.13.2. By Voltage Rating
18.13.3. By End Use
18.14. Japan Gas Insulated Substation Market Analysis
18.14.1. By Base of Installation
18.14.2. By Voltage Rating
18.14.3. By End Use
18.15. South Korea Gas Insulated Substation Market Analysis
18.15.1. By Base of Installation
18.15.2. By Voltage Rating
18.15.3. By End Use
18.16. India Gas Insulated Substation Market Analysis
18.16.1. By Base of Installation
18.16.2. By Voltage Rating
18.16.3. By End Use
18.17. ASEAN Gas Insulated Substation Market Analysis
18.17.1. By Base of Installation
18.17.2. By Voltage Rating
18.17.3. By End Use
18.18. ANZ Gas Insulated Substation Market Analysis
18.18.1. By Base of Installation
18.18.2. By Voltage Rating
18.18.3. By End Use
18.19. GCC Countries Gas Insulated Substation Market Analysis
18.19.1. By Base of Installation
18.19.2. By Voltage Rating
18.19.3. By End Use
18.20. Turkey Gas Insulated Substation Market Analysis
18.20.1. By Base of Installation
18.20.2. By Voltage Rating
18.20.3. By End Use
18.21. South Africa Gas Insulated Substation Market Analysis
18.21.1. By Base of Installation
18.21.2. By Voltage Rating
18.21.3. By End Use
19. Market Structure Analysis
19.1. Market Analysis by Tier of Companies (Global Gas Insulated Substation Market)
19.2. Market Concentration
19.3. Market Share Analysis of Top Players
19.4. Market Presence Analysis
20. Competition Analysis
20.1. Competition Dashboard
20.2. Competition Benchmarking
20.3. Company Profile
20.3.1. General Electric
20.3.1.1. Overview
20.3.1.2. Product Portfolio
20.3.1.3. Profitability by Market Segments (Product/ Region)
20.3.1.4. Sales Footprint
20.3.1.5. Strategy Overview
20.3.2. Hitachi, Ltd.
20.3.2.1. Overview
20.3.2.2. Product Portfolio
20.3.2.3. Profitability by Market Segments (Product/ Region)
20.3.2.4. Sales Footprint
20.3.2.5. Strategy Overview
20.3.3. ABB Ltd
20.3.3.1. Overview
20.3.3.2. Product Portfolio
20.3.3.3. Profitability by Market Segments (Product/ Region)
20.3.3.4. Sales Footprint
20.3.3.5. Strategy Overview
20.3.4. Larsen & Toubro Limited
20.3.4.1. Overview
20.3.4.2. Product Portfolio
20.3.4.3. Profitability by Market Segments (Product/ Region)
20.3.4.4. Sales Footprint
20.3.4.5. Strategy Overview
20.3.5. Siemens AG
20.3.5.1. Overview
20.3.5.2. Product Portfolio
20.3.5.3. Profitability by Market Segments (Product/ Region)
20.3.5.4. Sales Footprint
20.3.5.5. Strategy Overview
20.3.6. Mitsubishi Electric Corporation
20.3.6.1. Overview
20.3.6.2. Product Portfolio
20.3.6.3. Profitability by Market Segments (Product/ Region)
20.3.6.4. Sales Footprint
20.3.6.5. Strategy Overview
20.3.7. Eaton Corporation PLC
20.3.7.1. Overview
20.3.7.2. Product Portfolio
20.3.7.3. Profitability by Market Segments (Product/ Region)
20.3.7.4. Sales Footprint
20.3.7.5. Strategy Overview
20.3.8. Toshiba Corp
20.3.8.1. Overview
20.3.8.2. Product Portfolio
20.3.8.3. Profitability by Market Segments (Product/ Region)
20.3.8.4. Sales Footprint
20.3.8.5. Strategy Overview
20.3.9. CG Power and Industrial Solutions Ltd
20.3.9.1. Overview
20.3.9.2. Product Portfolio
20.3.9.3. Profitability by Market Segments (Product/ Region)
20.3.9.4. Sales Footprint
20.3.9.5. Strategy Overview
20.3.10. Schneider Electric SE
20.3.10.1. Overview
20.3.10.2. Product Portfolio
20.3.10.3. Profitability by Market Segments (Product/ Region)
20.3.10.4. Sales Footprint
20.3.10.5. Strategy Overview
20.3.11. Bharat Heavy Electricals Limited
20.3.11.1. Overview
20.3.11.2. Product Portfolio
20.3.11.3. Profitability by Market Segments (Product/ Region)
20.3.11.4. Sales Footprint
20.3.11.5. Strategy Overview
20.3.12. Elsewedy Electric Co S.A.E.
20.3.12.1. Overview
20.3.12.2. Product Portfolio
20.3.12.3. Profitability by Market Segments (Product/ Region)
20.3.12.4. Sales Footprint
20.3.12.5. Strategy Overview
20.3.13. Powell Industries, Inc.
20.3.13.1. Overview
20.3.13.2. Product Portfolio
20.3.13.3. Profitability by Market Segments (Product/ Region)
20.3.13.4. Sales Footprint
20.3.13.5. Strategy Overview
20.3.14. Hyosung Corp
20.3.14.1. Overview
20.3.14.2. Product Portfolio
20.3.14.3. Profitability by Market Segments (Product/ Region)
20.3.14.4. Sales Footprint
20.3.14.5. Strategy Overview
21. Assumptions and Acronyms Used
22. Research Methodology
Let us know your requirement to get
100% FREE customization
List of Tables
Table 01: Global Gas Insulated Substation Market Volume (Units) and Value (US$ Mn) Historical Data 2016-2020 and Forecast 2021-2031 By Base of Installation
Table 02: Global Gas Insulated Substation Market Value (US$ Mn) (Units) Historical Data 2016-2020 and Forecast 2021-2031 By Voltage Rating
Table 03: Global Gas Insulated Substation Market Volume (Units) Historical Data 2016-2020 and Forecast 2021-2031 by End Use
Table 04: Global Gas Insulated Substation Market Value (US$ Mn) & Volume (Units) Historical Data 2016-2020 and Forecast 2021-2031 by Region
Table 05: North America Gas Insulated Substation Market Value (US$ Mn) Historical Data 2016 – 2020 and Forecast 2021 – 2031 by Country
Table 06: North America Gas Insulated Substation Market Value (US$ Mn) Historical Data 2016-2020 and Forecast 2021-2031 By Base of Installation
Table 07: North America Gas Insulated Substation Market Value (US$ Mn) Units Historical Data 2016-2020 and Forecast 2021-2031 By Voltage Rating
Table 08: North America Gas Insulated Substation Market Volume Units Historical Data 2016-2020 and Forecast 2021-2031 by End Use
Table 09: Latin America Gas Insulated Substation Market Value (US$ Mn) Historical Data 2016 – 2020 and Forecast 2021 – 2031 by Country
Table 10: Latin America Gas Insulated Substation Market Value (US$ Mn) Historical Data 2016-2020 and Forecast 2021-2031 By Base of Installation
Table 11: Latin America Gas Insulated Substation Market Value (US$ Mn) Units Historical Data 2016-2020 and Forecast 2021-2031 By Voltage Rating
Table 12: Latin America Gas Insulated Substation Market Volume Units Historical Data 2016-2020 and Forecast 2021-2031 by End Use
Table 13: Europe Gas Insulated Substation Market Value (US$ Mn) Historical Data 2016 – 2020 and Forecast 2021 – 2031 by Country
Table 14: Europe Gas Insulated Substation Market Value (US$ Mn) Historical Data 2016-2020 and Forecast 2021-2031 By Base of Installation
Table 15: Europe Gas Insulated Substation Market Value (US$ Mn) Units Historical Data 2016-2020 and Forecast 2021-2031 By Voltage Rating
Table 16: Europe Gas Insulated Substation Market Volume Units Historical Data 2016-2020 and Forecast 2021-2031 by End Use
Table 17: East Asia Gas Insulated Substation Market Value (US$ Mn) Forecast by Country, 2016-2031
Table 18: East Asia Gas Insulated Substation Market Value (US$ Mn) Historical Data 2016-2020 and Forecast 2021-2031 By Base of Installation
Table 19: East Asia Gas Insulated Substation Market Value (US$ Mn) Units Historical Data 2016-2020 and Forecast 2021-2031 By Voltage Rating
Table 20: East Asia Gas Insulated Substation Market Volume Units Historical Data 2016-2020 and Forecast 2021-2031 by End Use
Table 21: South Asia & Pacific Gas Insulated Substation Market Value (US$ Mn) Forecast by Country, 2016-2031
Table 22: South Asia & Pacific Gas Insulated Substation Market Value (US$ Mn) Historical Data 2016-2020 and Forecast 2021-2031 By Base of Installation
Table 23: South Asia & Pacific Gas Insulated Substation Market Value (US$ Mn) Units Historical Data 2016-2020 and Forecast 2021-2031 By Voltage Rating
Table 24: South Asia & Pacific Gas Insulated Substation Market Volume Units Historical Data 2016-2020 and Forecast 2021-2031 by End Use
Table 25: Middle East & Africa Market Value (US$ Mn) Historical Data 2016 – 2020 and Forecast 2021 – 2031 by Country
Table 26: Middle East & Africa Gas Insulated Substation Market Value (US$ Mn) Historical Data 2016-2020 and Forecast 2021-2031 By Base of Installation
Table 27: Middle East & Africa Gas Insulated Substation Market Value (US$ Mn) Units Historical Data 2016-2020 and Forecast 2021-2031 By Voltage Rating
Table 28: Middle East & Africa Gas Insulated Substation Market Value (US$ Mn) Historical Data 2016-2020 and Forecast 2021-2031 by End Us
Find your sweet spots for generating winning opportunities in this market.
Talk to AnalystList of Charts
Figure 01: Global Gas Insulated Substation Historical Market Volume, 2016–2020
Figure 02: Global Gas Insulated Substation Market Volume Forecast, 2021–2031
Figure 03: Global Gas Insulated Substation Market Pricing Analysis, (US$ per Unit, 2020)
Figure 04: Global Gas Insulated Substation Market Historical Value (US$ Mn), 2016 – 2020
Figure 05: Global Gas Insulated Substation Market Absolute $ Opportunity, 2021 – 2031
Figure 06: Global Gas Insulated Substation Market Value (US$ Mn) Forecast, 2021 – 2031
Figure 07: Global Market Value Share Analysis By Base of Installation, 2021 & 2031
Figure 08: Global Market Y-o-Y Growth Analysis By Base of Installation, 2020-2031
Figure 09: Global Gas Insulated Substation Market Attractiveness Analysis By Base of Installation, 2021-2031
Figure 10: Global Market Incremental $ Opportunity By Base of Installation, 2021-2031
Figure 11: Global Gas Insulated Substation Market Share & BPS Analysis By Voltage Rating, 2021 & 2031
Figure 12: Global Gas Insulated Substation Market Y-o-Y Growth Projection By Voltage Rating, 2020-2031
Figure 13: Global Gas Insulated Substation Market Attractiveness Analysis By Voltage Rating, 2021-2031
Figure 14: Global Market Incremental $ Opportunity By Voltage Rating, 2021-2031
Figure 15: Global Gas Insulated Substation Market Share & BPS Analysis by End Use, 2021 & 2031
Figure 16: Global Gas Insulated Substation Market Y-o-Y Growth Projection by End Use, 2020-2031
Figure 17: Global Gas Insulated Substation Market Attractiveness Analysis by End Use, 2021-2031
Figure 18: Global Market Incremental $ Opportunity by End Use, 2021-2031
Figure 19: Global Gas Insulated Substation Market Share & BPS Analysis by Region, 2021 & 2031
Figure 20: Global Gas Insulated Substation Market Y-o-Y Growth Projection by Region, 2020-2031
Figure 21: Global Gas Insulated Substation Market Attractiveness Analysis by Region, 2021-2031
Figure 22: Global Market Incremental $ Opportunity by Region, 2021-2031
Figure 23: North America Gas Insulated Substation Market Share and BPS Analysis by Country - 2021 & 2031
Figure 24: North America Gas Insulated Substation Market Y-o-Y Growth by Country, 2020-2031
Figure 25: North America Gas Insulated Substation Market Attractiveness Analysis by Country, 2021-2031
Figure 26: North America Market Incremental $ Opportunity by Country, 2021-2031
Figure 27: North America Market Value Share Analysis By Base of Installation, 2021 & 2031
Figure 28: North America Market Y-o-Y Growth Analysis By Base of Installation, 2020-2031
Figure 29: North America Gas Insulated Substation Market Attractiveness Analysis By Base of Installation, 2021-2031
Figure 30: North America Market Incremental $ Opportunity By Base of Installation, 2021-2031
Figure 31: North America Gas Insulated Substation Market Share & BPS Analysis By Voltage Rating, 2021 & 2031
Figure 32: North America Gas Insulated Substation Market Y-o-Y Growth Projection By Voltage Rating, 2021-2031
Figure 33: North America Gas Insulated Substation Market Attractiveness Analysis By Voltage Rating, 2021-2031
Figure 34: North America Market Incremental $ Opportunity By Voltage Rating, 2021-2031
Figure 35: North America Gas Insulated Substation Market Share & BPS Analysis by End Use, 2021 & 2031
Figure 35: North America Gas Insulated Substation Market Y-o-Y Growth Projection by End Use, 2020-2031
Figure 36: North America Gas Insulated Substation Market Attractiveness Analysis by End Use, 2021-2031
Figure 37: North America Market Incremental $ Opportunity by End Use, 2021-2031
Figure 38: Latin America Gas Insulated Substation Market Share and BPS Analysis by Country - 2021 & 2031
Figure 39: Latin America Gas Insulated Substation Market Y-o-Y Growth by Country, 2020-2031
Figure 40: Latin America Gas Insulated Substation Market Attractiveness Analysis by Country, 2021-2031
Figure 41: Latin America Market Incremental $ Opportunity by Country, 2021-2031
Figure 42: Latin America Market Value Share Analysis By Base of Installation, 2021 & 2031
Figure 43: Latin America Market Y-o-Y Growth Analysis By Base of Installation, 2020-2031
Figure 44: Latin America Gas Insulated Substation Market Attractiveness Analysis By Base of Installation, 2021-2031
Figure 45: Latin America Market Incremental $ Opportunity By Base of Installation, 2021-2031
Figure 46: Latin America Gas Insulated Substation Market Share & BPS Analysis By Voltage Rating, 2021 & 2031
Figure 47: Latin America Gas Insulated Substation Market Y-o-Y Growth Projection By Voltage Rating, 2020-2031
Figure 48: Latin America Gas Insulated Substation Market Attractiveness Analysis By Voltage Rating, 2021-2031
Figure 49: Latin America Market Incremental $ Opportunity By Voltage Rating, 2021-2031
Figure 50: Latin America Gas Insulated Substation Market Share & BPS Analysis by End Use, 2021 & 2031
Figure 51: Latin America Gas Insulated Substation Market Y-o-Y Growth Projection by End Use, 2020-2031
Figure 52: Latin America Gas Insulated Substation Market Attractiveness Analysis by End Use, 2021-2031
Figure 53: Latin America Market Incremental $ Opportunity by End Use, 2021-2031
Figure 54: Europe Gas Insulated Substation Market Share and BPS Analysis by Country - 2021 & 2031
Figure 55: Europe Gas Insulated Substation Market Y-o-Y Growth by Country, 2020-2031
Figure 56: Europe Gas Insulated Substation Market Attractiveness Analysis by Country, 2021-2031
Figure 57: Europe Market Incremental $ Opportunity by Country, 2021-2031
Figure 58: Europe Gas Insulated Substation Market Value Share Analysis By Base of Installation, 2021 & 2031
Figure 59: Europe Gas Insulated Substation Market Y-o-Y Growth Analysis By Base of Installation, 2020-2031
Figure 60: Testing Market Attractiveness Analysis By Base of Installation, 2021-2031
Figure 61: Europe Market Incremental $ Opportunity By Base of Installation, 2021-2031
Figure 62: Europe Gas Insulated Substation Market Share & BPS Analysis By Voltage Rating, 2021 & 2031
Figure 63: Europe Gas Insulated Substation Market Y-o-Y Growth Projection By Voltage Rating, 2020-2031
Figure 64: Europe Gas Insulated Substation Market Attractiveness Analysis By Voltage Rating, 2021-2031
Figure 65: Europe Market Incremental $ Opportunity By Voltage Rating, 2021-2031
Figure 66: Europe Gas Insulated Substation Market Share & BPS Analysis by End Use, 2021 & 2031
Figure 67: Europe Gas Insulated Substation Market Y-o-Y Growth Projection by End Use, 2020-2031
Figure 68: Europe Gas Insulated Substation Market Attractiveness Analysis by End Use, 2021-2031
Figure 69: Europe Market Incremental $ Opportunity by End Use, 2021-2031
Figure 70: East Asia Gas Insulated Substation Market Share and BPS Analysis by Country - 2021-2031
Figure 71: East Asia Gas Insulated Substation Market Y-o-Y Growth Projections by Country, 2020-2031
Figure 72: East Asia Gas Insulated Substation Market Attractiveness by Country, 2021-2031
Figure 73: East Asia Market Incremental $ Opportunity by Country, 2021-2031
Figure 74: East Asia Gas Insulated Substation Market Value Share Analysis By Base of Installation, 2021 & 2031
Figure 75: East Asia Gas Insulated Substation Market Y-o-Y Growth Analysis By Base of Installation, 2020-2031
Figure 76: East Asia Gas Insulated Substation Market Attractiveness Analysis By Base of Installation, 2021-2031
Figure 77: East Asia Market Incremental $ Opportunity By Base of Installation, 2021-2031
Figure 78: East Asia Gas Insulated Substation Market Share & BPS Analysis By Voltage Rating, 2021 & 2031
Figure 79: East Asia Gas Insulated Substation Market Y-o-Y Growth Projection By Voltage Rating, 2020-2031
Figure 80: East Asia Gas Insulated Substation Market Attractiveness Analysis By Voltage Rating, 2021-2031
Figure 81: East Asia Market Incremental $ Opportunity By Voltage Rating, 2021-2031
Figure 82: East Asia Gas Insulated Substation Market Share & BPS Analysis by End Use, 2021 & 2031
Figure 83: East Asia Gas Insulated Substation Market Y-o-Y Growth Projection by End Use, 2020-2031
Figure 84: East Asia Gas Insulated Substation Market Attractiveness Analysis by End Use, 2021-2031
Figure 85: East Asia Market Incremental $ Opportunity by End Use, 2021-2031
Figure 86: South Asia & Pacific Gas Insulated Substation Market Share and BPS Analysis by Country - 2021-2031
Figure 87: South Asia & Pacific Gas Insulated Substation Market Y-o-Y Growth Projections by Country, 2020-2031
Figure 88: South Asia & Pacific Gas Insulated Substation Market Attractiveness by Country, 2021-2031
Figure 89: South Asia & Pacific Market Incremental $ Opportunity by Country, 2021-2031
Figure 90: South Asia & Pacific Gas Insulated Substation Market Value Share Analysis By Base of Installation, 2021 & 2031
Figure 91: South Asia & Pacific Gas Insulated Substation Market Y-o-Y Growth Analysis By Base of Installation, 2020-2031
Figure 92: South Asia & Pacific Gas Insulated Substation Market Attractiveness Analysis By Base of Installation, 2021-2031
Figure 93: South Asia & Pacific Market Incremental $ Opportunity By Base of Installation, 2021-2031
Figure 94: South Asia & Pacific Gas Insulated Substation Market Share & BPS Analysis By Voltage Rating, 2021 & 2031
Figure 95: South Asia & Pacific Gas Insulated Substation Market Y-o-Y Growth Projection By Voltage Rating, 2020-2031
Figure 96: South Asia & Pacific Gas Insulated Substation Market Attractiveness Analysis By Voltage Rating, 2021-2031
Figure 97: South Asia & Pacific Market Incremental $ Opportunity By Voltage Rating, 2021-2031
Figure 98: South Asia & Pacific Gas Insulated Substation Market Share & BPS Analysis by End Use, 2021 & 2031
Figure 99: South Asia & Pacific Gas Insulated Substation Market Y-o-Y Growth Projection by End Use, 2020-2031
Figure 100: South Asia & Pacific Gas Insulated Substation Market Attractiveness Analysis by End Use, 2021-2031
Figure 101: South Asia & Pacific Market Incremental $ Opportunity by End Use, 2021-2031
Figure 102: Middle East & Africa Market Share and BPS Analysis by Country - 2021 & 2031
Figure 103: Middle East & Africa Market Y-o-Y Growth by Country, 2020-2031
Figure 104: Middle East & Africa Market Attractiveness Analysis by Country, 2021-2031
Figure 105: Middle East & Africa Market Incremental $ Opportunity by Country, 2021-2031
Figure 106: Middle East & Africa Market Value Share Analysis By Base of Installation, 2021 & 2031
Figure 107: Middle East & Africa Market Y-o-Y Growth Analysis By Base of Installation, 2020-2031
Figure 108: Middle East & Africa Gas Insulated Substation Market Attractiveness Analysis By Base of Installation, 2021-2031
Figure 109: Middle East & Africa Market Incremental $ Opportunity By Base of Installation, 2021-2031
Figure 110: Middle East & Africa Gas Insulated Substation Market Share & BPS Analysis By Voltage Rating, 2021 & 2031
Figure 111: Middle East & Africa Gas Insulated Substation Market Y-o-Y Growth Projection By Voltage Rating, 2020-2031
Figure 112: Middle East & Africa Gas Insulated Substation Market Attractiveness Analysis By Voltage Rating, 2021-2031
Figure 113: Middle East & Africa Market Incremental $ Opportunity By Voltage Rating, 2021-2031
Figure 114: Middle East & Africa Gas Insulated Substation Market Share & BPS Analysis by End Use, 2021 & 2031
Figure 115: Middle East & Africa Gas Insulated Substation Market Y-o-Y Growth Projection by End Use, 2020-2031
Figure 116: Middle East & Africa Gas Insulated Substation Market Attractiveness Analysis by End Use, 2021-2031
Figure 117: Middle East & Africa Market Incremental $ Opportunity by End Use, 2021-2031
Need specific information?
Request CustomizationExplore Industrial Automation Insights
View Reports