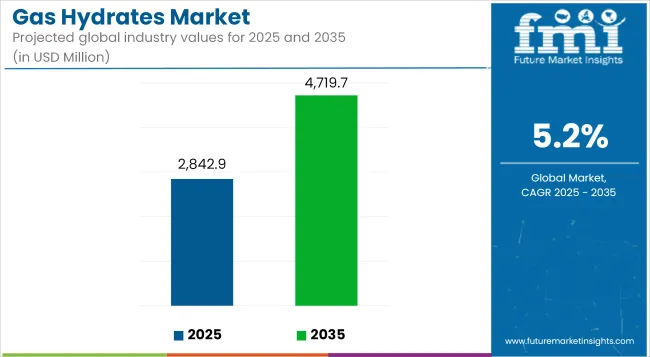
The global gas hydrates market is estimated to reach USD 2,842.9 million in 2025 and expand to USD 4,719.7 million by 2035, registering a CAGR of 5.2% during the forecast period.

Growth is being driven by increasing energy security concerns and advancements in extraction technologies for methane hydrates embedded in oceanic and permafrost formations.
Gas hydrates are being explored as a strategic energy resource due to their high methane content and widespread availability in offshore and Arctic regions. Their crystalline structure enables significant gas storage capacity, making them attractive in the context of long-term energy diversification strategies.
Research and development initiatives supported by governments and energy firms are focused on achieving technically feasible and environmentally safe extraction of these unconventional resources.
Asia Pacific continues to lead global exploration efforts. Japan’s Ministry of Economy, Trade and Industry (METI), in partnership with JOGMEC, has reported successful pilot production in the Nankai Trough. China has accelerated efforts in the South China Sea with sustained field testing, and India’s National Gas Hydrate Program (NGHP) is actively conducting exploration in the Krishna-Godavari Basin and Andaman offshore regions.
These programs are aligned with national strategies to reduce dependence on imported hydrocarbons and secure long-term domestic energy supply.
Russia and Canada have initiated gas hydrate evaluation in permafrost zones, while the United States is assessing resource potential in the Gulf of Mexico and Alaskan terrains. Publicly funded initiatives and collaborative efforts with service providers such as Schlumberger and Halliburton are supporting geophysical surveys and tool development tailored for hydrate reservoirs.
Technologies like depressurization, thermal stimulation, and chemical injection are being advanced to address recovery efficiency and reservoir stability.
Environmental concerns regarding methane leakage and ocean floor disruption are being addressed through real-time monitoring, CO₂ sequestration integration, and drilling control mechanisms.
Industry stakeholders are incorporating environmental risk assessments and lifecycle evaluations to ensure compliance with global climate goals.
The positioning of gas hydrates as a transitional energy source is gaining momentum. Their ability to supplement declining conventional reserves, particularly in energy-importing nations, reinforces their strategic relevance. Ongoing pilot projects, supported by public-private financing models, are expected to lay the groundwork for commercial-scale extraction by the end of the forecast horizon.
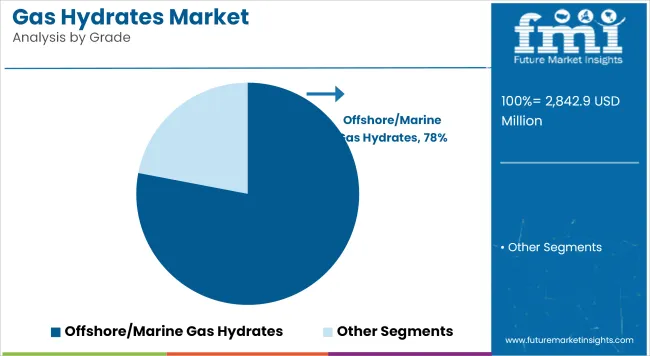
Offshore/Marine gas hydrates are projected to lead the market, holding a dominant 78% share in 2025, and are expected to expand at a CAGR of 4.9% through 2035. The majority of global hydrate reserves are located in marine sediments under high-pressure, low-temperature environments on continental margins. Japan, China, and India have made significant progress in offshore pilot production programs.
Advancements in subsea extraction technologies, real-time hydrate monitoring, and international collaborations are supporting commercial feasibility. Increasing focus on long-term energy security, coupled with government-backed investments in marine R&D, makes offshore exploration a strategic priority.
The scale and potential yield of marine hydrate deposits surpass onshore fields, making them the primary focus for global energy developers.

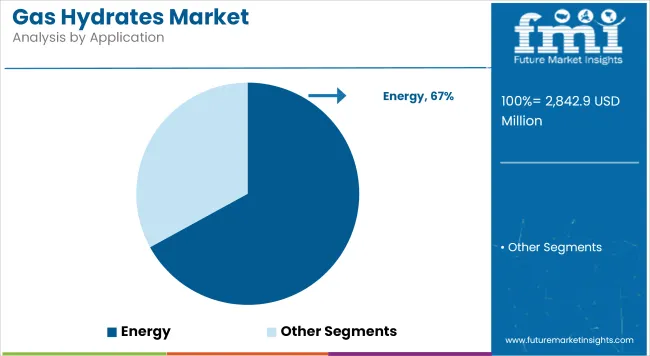
The energy sector holds the largest share in the gas hydrates market, accounting for 67% in 2025, and is projected to remain dominant through 2035 with CAGR 5.0%. Methane hydrates are being explored as a future energy resource due to their immense energy density and global abundance.
Their ability to serve as an alternative to traditional natural gas has positioned them as a strategic reserve for nations with high energy demand and import dependency. Leading countries like Japan, China, and India are conducting deep-sea trials and pilot projects to harness hydrate-based energy. As global energy needs rise and pressure mounts to find cleaner-burning fossil alternatives, the energy application will continue to drive the commercial viability and growth of the gas hydrates market.

Technical Complexity and High Extraction Costs
The primary dilemma the gas hydrates market facing is the technical and economic feasibility of the commercial extraction. Dissociative conditions are upper pressure and temperature situations like in deep-sea sediments and permafrost fair, hence direct and safe extraction is pretty difficult.
Current technologies are still developing, and throughout the field tests for extraction, the problematic situations have come such as vulnerability to hydrate dissociation, sediment collapse, and instability of gas yield. This specific equipment for extraction, together with the necessary real-time monitoring systems and the need for advanced well completion techniques, play a vital role in significantly increasing operational costs limiting short-term commercialization prospects.
Environmental Risks and Methane Leakage Concerns
Gas hydrates are primarily made up of methane, which is a very potent greenhouse gas. Whether precipitation happens accidentally or not, methane will lead to the atmosphere and thus tense clean energy generation issues. The potential ecological disturbances in the deep-sea habitats, landslide threats from the subsea areas, and permafrost destabilization are also serious concerns.
To tackle the risks associated with methane, the best solution would be through EIAs, pressure-based extraction, and legislation, making it hard to capture gas hydrate operations in public and regulatory sectors. Until the risks have been thoroughly dealt with, public and regulatory resistance may impede the scaling up of gas hydrate operations.
Gas Hydrates as the Next-Generation Energy Source for Energy-Dependent Economies
Gas hydrates, which are ice-like substances, could serve as a potential source of energy, especially for countries that are heavily reliant on energy imports. Trillions of tons of hydrate resources are available globally, which can facilitate the world in the transition from fossil fuels to renewable sources of energy through the use of hydrides.
Gas hydrates can potentially help countries like Japan and India, the nations with the highest percentage of energy imports, boost energy security and cut trade deficits. The incentives from governments, bilateral energy cooperation, and public-private research and development partnerships can be the driving force in making the fishing of methane hydrate a viable option for such economies.
Hydrates as a Medium for Natural Gas Storage and Transportation
Another one of the emerging ideas is to put the gas hydrates inside the vessels and use them for long-distance natural gas pipelines particularly in LNG transportation. Storage of gas with the help of hydrates is efficient in terms of volume and the technique can also potentially prevent the use of costly high-pressure cryogenic systems.
The latest methods of creating artificial hydrates, gas entrapment, and hybrid hydrate-slurry systems promote the research of the use of hydrates in portable low-pressure natural gas logistics, particularly in the context of remote sites or offshore installations.
The introduction of this innovation which could be a giant move forward for the stranded gas reserves, small-scale LNG players, and offshore gas operators who would be getting a safe as well as possibly cheaper transport in such niche applications.
The United States gas hydrates industry is undergoing a moderate yet consistent development, which is mainly attributed to the growing investments in unconventional energy sources, offshore energy exploration, and methane hydrate research programs. The cooperation between government and academic institutions leads to pilot projects which assess the commercial feasibility of extracting gas hydrate deposits, predominantly in Alaska and the Gulf of Mexico.
Whereas the large-scale commercial production is still in its infancy, the USA is claiming its place as a frontrunner in hydrate reservoir characterization, environmental safety protocols, and drilling technologies, all of which are the cornerstones of future market growth.
| Country | CAGR (2025 to 2035) |
|---|---|
| United States | 5.4% |
The United Kingdom gas hydrates market is growing but at a slow and steady pace. The emphasis is put on research, environmental impact assessment, and carbon management. While the UK does not yet engage in hydrate extraction, the academic interest in seabed hydrate deposits within the North Sea and the wider Atlantic margin has been increasing.
The potential for hydrates to serve as carbon capture and storage (CCS) agents and geological hazards is being explored, thus assigning them a significant place in climate and energy risk modeling.
| Country | CAGR (2025 to 2035) |
|---|---|
| United Kingdom | 4.9% |
The European Union gas hydrates market is slowly growing, thanks to multinational research efforts, energy diversification initiatives, and EU-wide funding for unconventional gas resource studies. Countries such as Germany and Norway (although not EU) have undertaken significant work on seafloor hydrate mapping and simulation studies.
Hydrate extraction is still at a pre-commercial stage, but Europe is making investments in safe exploitation technologies, modeling of methane extraction, and technology for environmental monitoring, particularly in situations with deepwater basins and in Arctic-related projects.
| Region | CAGR (2025 to 2035) |
|---|---|
| European Union | 5.2% |
The Japan gas hydrates market is leading the development worldwide, as the government is driving the commercialization of methane hydrate extraction. The Japan Oil, Gas and Metals National Corporation (JOGMEC) has performed offshore drilling and production tests in the Nankai Trough that were successful, thus establishing Japan into the pioneers in this field.
Japan’s heavy dependence on imported energy gives it the strategic motive to look for domestic offshore hydrate reserves. Through novel technologies like seafloor monitoring and hydrate dissociation, the research is now focusing on the path towards field-scale commercial production.
| Country | CAGR (2025 to 2035) |
|---|---|
| Japan | 5.8% |
The South Korea gas hydrates market is on the rise because of the increased investments in energy diversification, marine resource exploration, and offshore gas hydrate mapping. South Korea is putting effort into a joint study with Japan and China, targeting the East Sea, especially the Ulleung Basin, as a potential field for hydrate resource exploration.
Although the country is not currently extracting gas hydrate on a commercial scale, Korea is progressing with subsea extraction technology, hydrate-bearing core analysis, and deep-sea drilling programs as a result of government funding and involvement of energy firms.
| Country | CAGR (2025 to 2035) |
|---|---|
| South Korea | 5.5% |
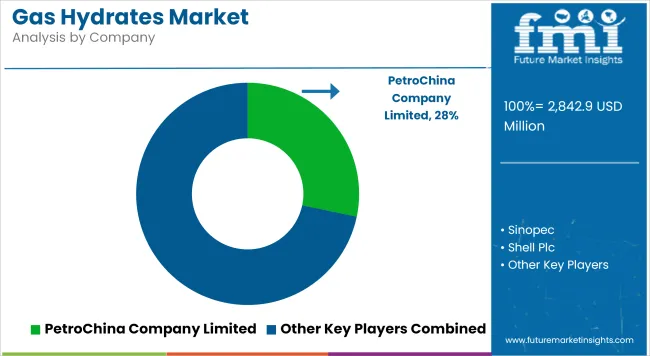
The global gas hydrates market is moderately consolidated, with state-backed entities, multinational oil majors, and oilfield service companies playing pivotal roles. Key players like Shell, Chevron, CNPC, and JOGMEC are involved in long-term hydrate pilot projects and public-private partnerships. Research institutions and universities are contributing to geotechnical modeling and risk analysis Strategic alliances, offshore licensing rounds, and government-funded exploration campaigns are defining market competition.
Companies with advanced offshore drilling capabilities, environmental risk mitigation strategies, and hydrate recovery R&D pipelines are best positioned to capitalize on future opportunities. As commercial viability improves, new entrants and joint ventures are expected to increase, especially in Asia and the Arctic.

The market is segmented into Onshore Gas Hydrates and Offshore/Marine Gas Hydrates.
The industry is divided into Residential, Commercial, Industrial, Vehicle Fuel, and Energy.
The market includes Depressurization, Thermal Stimulation, Inhibitor Injection, and CO₂ Sequestration.
The industry covers Oil & Gas, Power Generation, Transportation, and Chemicals.
The report covers key regions, including North America, Latin America, Western Europe, Eastern Europe, East Asia, South Asia, and the Middle East & Africa (MEA).
The global gas hydrates market is projected to reach USD 2,842.9 million by the end of 2025.
The market is anticipated to grow at a CAGR of 5.2% from 2025 to 2035.
By 2035, the gas hydrates market is expected to reach USD 4,719.7 million.
The energy segment is expected to dominate due to the growing focus on gas hydrates as a potential alternative energy source, driven by increasing global energy demand and interest in unconventional gas reserves, particularly in countries with hydrate-rich offshore basins.
Key players in the market include Japan Oil, Gas and Metals National Corporation (JOGMEC), USA Department of Energy (DOE), Schlumberger Limited, Halliburton Company, and PetroChina Company Limited.
Table 01: Global Market Size (USD million) and Volume (million Cubic Meters) Analysis and Forecast By Type, 2020 to 2035
Table 02: Global Market Size (USD million) and Volume (million Cubic Meters) Analysis and Forecast By Application, 2020 to 2035
Table 03: Global Market Size (USD million) and Volume (million Cubic Meters) Analysis and Forecast By Region, 2020 to 2035
Table 04: North America Market Size (USD million) and Volume (million Cubic Meters) Analysis and Forecast By Country, 2020 to 2035
Table 05: North America Market Size (USD million) and Volume (million Cubic Meters) Analysis and Forecast By Type, 2020 to 2035
Table 06: North America Market Size (USD million) and Volume (million Cubic Meters) Analysis and Forecast By Application, 2020 to 2035
Table 07: Latin America Market Size (USD million) and Volume (million Cubic Meters) Analysis and Forecast By Country, 2020 to 2035
Table 08: Latin America Market Size (USD million) and Volume (million Cubic Meters) Analysis and Forecast By Type, 2020 to 2035
Table 09: Latin America Market Size (USD million) and Volume (million Cubic Meters) Analysis and Forecast By Application, 2020 to 2035
Table 10: Europe Market Size (USD million) and Volume (million Cubic Meters) Analysis and Forecast By Country, 2020 to 2035
Table 11: Europe Market Size (USD million) and Volume (million Cubic Meters) Analysis and Forecast By Type, 2020 to 2035
Table 12: Europe Market Size (USD million) and Volume (million Cubic Meters) Analysis and Forecast By Application, 2020 to 2035
Table 13: East Asia Market Size (USD million) and Volume (million Cubic Meters) Analysis and Forecast By Country, 2020 to 2035
Table 14: East Asia Market Size (USD million) and Volume (million Cubic Meters) Analysis and Forecast By Type, 2020 to 2035
Table 15: East Asia Market Size (USD million) and Volume (million Cubic Meters) Analysis and Forecast By Application, 2020 to 2035
Table 16: South Asia Pacific Market Size (USD million) and Volume (million Cubic Meters) Analysis and Forecast By Country, 2020 to 2035
Table 17: South Asia Pacific Market Size (USD million) and Volume (million Cubic Meters) Analysis and Forecast By Type, 2020 to 2035
Table 18: South Asia Pacific Market Size (USD million) and Volume (million Cubic Meters) Analysis and Forecast By Application, 2020 to 2035
Table 19: Middle East and Africa Market Size (USD million) and Volume (million Cubic Meters) Analysis and Forecast By Country, 2020 to 2035
Table 20: Middle East and Africa Market Size (USD million) and Volume (million Cubic Meters) Analysis and Forecast By Type, 2020 to 2035
Table 21: Middle East and Africa Market Size (USD million) and Volume (million Cubic Meters) Analysis and Forecast By Application, 2020 to 2035


Full Research Suite comprises of:
Market outlook & trends analysis
Interviews & case studies
Strategic recommendations
Vendor profiles & capabilities analysis
5-year forecasts
8 regions and 60+ country-level data splits
Market segment data splits
12 months of continuous data updates
DELIVERED AS:
PDF EXCEL ONLINE
Gas & Dual-Fuel Injection Systems Market Size and Share Forecast Outlook 2025 to 2035
Gas Desiccant Dehydration Unit Market Size and Share Forecast Outlook 2025 to 2035
Gas Cylinder Market Size and Share Forecast Outlook 2025 to 2035
Gasket and Seal Market Size and Share Forecast Outlook 2025 to 2035
Gas Separation Membrane Market Size and Share Forecast Outlook 2025 to 2035
Gas Jet Compressor Market Size and Share Forecast Outlook 2025 to 2035
Gas Fired Water-Tube Food Processing Boiler Market Size and Share Forecast Outlook 2025 to 2035
Gas Fired Real Estate Generator Market Size and Share Forecast Outlook 2025 to 2035
Gastric-soluble Hollow Capsules Market Size and Share Forecast Outlook 2025 to 2035
Gas Cooling System Market Analysis - Size, Share, and Forecast Outlook 2025 to 2035
Gasoline Gensets Market Size and Share Forecast Outlook 2025 to 2035
Gas Insulated Smart Ring Main Unit Market Size and Share Forecast Outlook 2025 to 2035
Gas Turbine Oil Market Size and Share Forecast Outlook 2025 to 2035
Gas Telecom Generator Market Size and Share Forecast Outlook 2025 to 2035
Gas Insulated Ring Main Unit Market Size and Share Forecast Outlook 2025 to 2035
Gas Fired Condensing Low Temperature Commercial Boiler Market Size and Share Forecast Outlook 2025 to 2035
Gas Insulated Medium Voltage Switchgear Market Size and Share Forecast Outlook 2025 to 2035
Gas Commercial Deep Fryers Market Size and Share Forecast Outlook 2025 to 2035
Gastroesophageal Reflux Disease (GERD) Device Market Analysis - Size, Share, and Forecast Outlook 2025 to 2035
Gas Station Equipment Market Size and Share Forecast Outlook 2025 to 2035

Thank you!
You will receive an email from our Business Development Manager. Please be sure to check your SPAM/JUNK folder too.
Chat With
MaRIA