Gas Pressure Regulators Market Size, Share, and Forecast Outlook 2025 to 2035

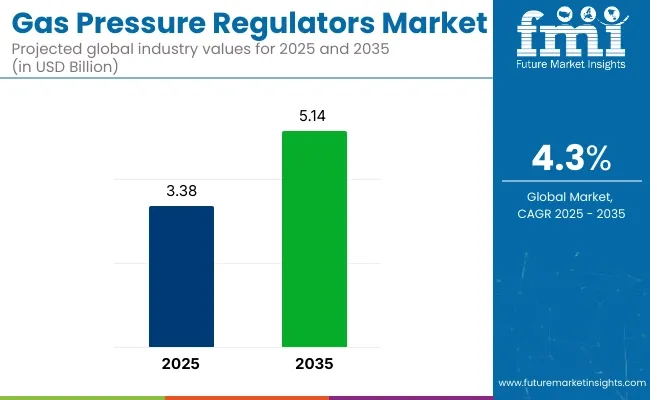
The global gas pressure regulator market is projected to be valued at USD 3.38 billion in 2025, with the market size expected to grow to USD 5.14 billion by 2035, reflecting a CAGR of 4.3%.

This growth is supported by rising urbanization, ongoing investment in gas distribution networks, and increasing regulation of process safety in various industries. The continuous innovation in gas regulators, including features like smart sensing technology, corrosion-resistant components, and greater compatibility for use with a wider range of gases, is enabling the expanded usage of these devices across diverse industries, from oil & gas to HVAC and food processing.

The global gas pressure regulators market is expected to experience consistent growth in the coming decade due to increasing energy requirements across domestic, commercial, and industrial sectors, along with the growing use of natural gas and the development of gas-based infrastructure.
Gas Pressure Regulators Market

Metric Value
Market Size in 2025 USD 3.38 billion
Market Size in 2035 USD 5.14 billion
CAGR (2025 to 2035) 4.3%

Gas pressure regulators are essential in safely and efficiently controlling the flow of gases such as industrial gases, propane, and natural gas, ensuring they are regulated to appropriate levels for downstream applications. As the world’s energy system shifts towards cleaner, more efficient energy sources, the application of advanced regulation systems is becoming increasingly important.

Key players in the gas pressure regulators market are also driving innovation with new product offerings and strategic initiatives. Emerson Electric introduced the TESCOM ER5000 series in 2024, which features remote setpoint control and wireless diagnostics.

In 2025, the company deployed hydrogen-ready dome-loaded regulators in demo stations across the EU, contributing to the development of hydrogen infrastructure. The Linde Group expanded its SPECTRA product line in 2024, adding UHP compatibility for semiconductor fabs.

In 2025, Linde partnered with OEMs for the production of dual-stage regulators in green hydrogen projects. Air Liquide launched smart regulators in 2024 with real-time leak detection for medical and industrial use. In 2025, the company retrofitted existing hospital gas networks in Southeast Asia to improve efficiency and safety.

Analyzing Gas Pressure Regulators Market by Top Investment Segments

The gas pressure regulators market is projected to experience significant growth, driven by key segments such as single-stage regulators and fuel gases. Single-stage regulators are anticipated to lead the market in terms of product type, while fuel gases will continue to dominate as the primary gas used across sectors. These two segments are expected to play a critical role in shaping the market’s growth.

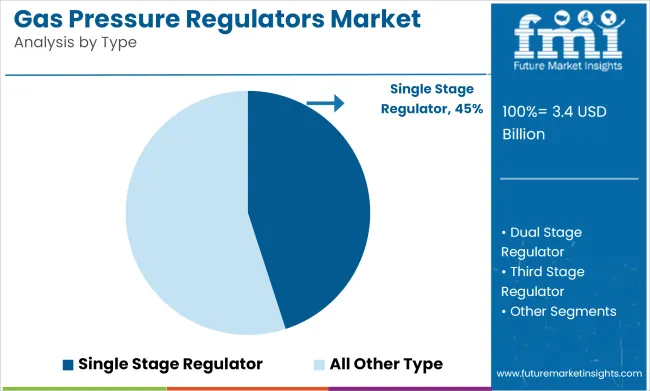
Single-Stage Regulators to Capture 45% of the Gas Pressure Regulators Market Share

Single-stage regulators are expected to capture 45% of the market share in 2025. Their simple design, which reduces pressure in a single step, makes them ideal for residential and light commercial applications. Single-stage regulators are commonly used in low-pressure systems where simplicity, affordability, and ease of operation are crucial.
Gas Pressure Regulators Market Analysis By Type

For instance, in suburban areas where propane tanks are used for outdoor heating and cooking, single-stage regulators are preferred due to their ease of installation and low maintenance requirements. They are also frequently chosen for applications like barbecue grills, home heating, and cooking. The demand for these regulators has been increasing, particularly in rural areas where there has been a shift from central gas supply systems to mobile ones.

Companies like Emerson, Honeywell, and Pentair have been leading the production of single-stage gas regulators, offering products that cater to both residential and light commercial needs. As demand for mobile and portable gas supply systems increases, single-stage regulators are expected to remain the preferred choice due to their cost-effectiveness and reliability.

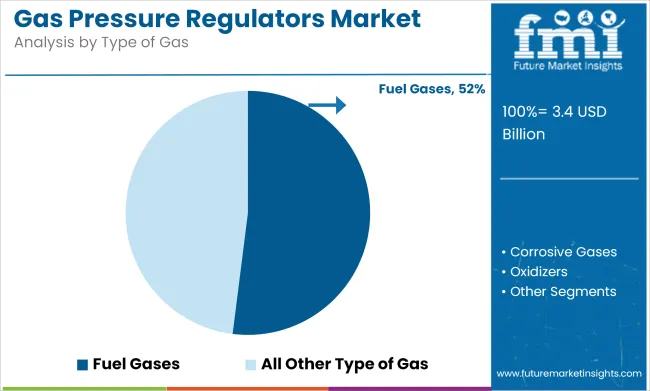
Fuel Gases to Capture 52% of the Gas Pressure Regulators Market Share

Fuel gases, including compressed natural gas (CNG) and liquid propane, are projected to capture 52% of the market share in 2025. These gases remain the most widely used in various applications such as domestic heating, mobile food carts, and industrial combustion. For instance, food truck vendors often rely on CNG-powered cooking systems, where a stable and constant gas pressure is essential for performance and safety.
Gas Pressure Regulators Market Analysis By Type Of Gas

Similarly, rural households using propane for furnaces and water heaters require precise pressure regulation to prevent flame instability or fuel loss. The wide-ranging applications of fuel gases in both household and industrial settings continue to drive demand for gas pressure regulators.

Companies like Honeywell, Emerson, and Cavagna Group have been providing specialized regulators designed for fuel gases, ensuring consistent pressure control in diverse applications. The growing use of CNG and propane in residential, commercial, and industrial installations is expected to continue propelling the dominance of fuel gases in the market. Their wide application, coupled with the increasing demand for safe and efficient energy solutions, ensures fuel gases remain a critical segment in the gas pressure regulator market.

Challenges and Opportunities

Challenges

Material Degradation, Infrastructure Retrofitting, and International Safety Standards

The threats facing the gas pressure regulator market are retrofitting aged infrastructure in mature cities with lengthy pipe systems. Additionally, corrosion and deterioration due to the dynamic nature of gases also cause maintenance and safety issues. Finally, worldwide consistency of safety standards and certification also pose a difficulty in producing and exporting gas regulators globally.

Opportunities

Intelligent Regulators, Hydrogen Readiness, and Module Systems

Challenging, yet great opportunities are on the horizon. Development of the intelligent regulators with remote diagnosis, real-time monitoring, and prognostics will transform the management of gas pressure. Emergence of hydrogen as a viable alternative fuel brings the promise of highly specialized high-precision regulators. Modular, field-reconfigurable regulator systems are now at last gaining widespread acceptance, particularly among industrial end-users who crave flexibility and use variety.
Country-Wise Outlook

Gas Pressure Regulators Market Cagr Analysis By Country

United States

The USA gas pressure regulator market has transitioned from a utility-oriented industry to one that's heavily interwoven with the green revolution. With residential structures moving towards hybrid heating systems and hydrogen blending pilots spreading over municipal utilities, the demand for dual-capable, self-regulating valves is increasing.

Also, the increasing trend of home automation has compelled manufacturers to integrate smart monitoring systems that notify users of pressure drops or micro-leaks through mobile apps-creating a more integrated gas delivery environment.

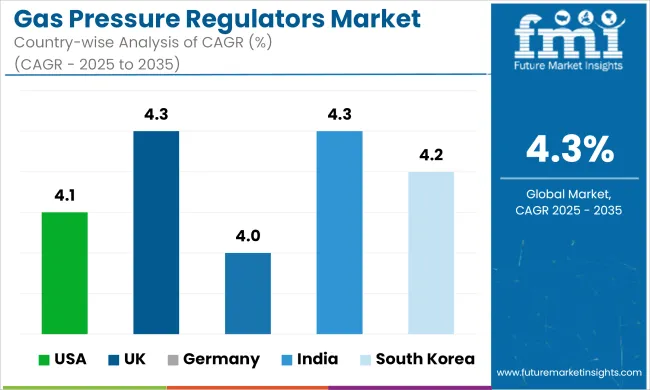
Country CAGR (2025 to 2035)
USA 4.1%

United Kingdom

Within the UK, natural gas boiler phasing out by 2035 and the increased hydrogen blending into grid networks are instigating a significant transformation. Gas pressure regulators are currently being designed for varying gas mixtures and coupling with renewable gas supplies.

Regulator designs to accommodate future retrofitting as "hydrogen-ready" are being invested in by companies. Regulator support by government programs, such as the Green Gas Support Scheme, adds to market growth.

Country CAGR (2025 to 2035)
UK 4.3%

Germany

Germany’s regulators market is underpinned by the Energiewende transition. The push toward decentralized energy systems and biogas plants has spurred demand for highly customizable gas regulators compatible with various fuel mixtures.

German manufacturers are developing plug-and-play regulator kits for industrial SMEs that are shifting to local CHP (Combined Heat and Power) systems. Sustainability goals are also pushing for non-toxic coatings and easy-disassembly for recycling.

Country CAGR (2025 to 2035)
Germany 4.0%

India

India’s rapid urbanization and continued LPG subsidy programs have fueled massive adoption of gas regulators in both domestic and commercial kitchens. However, the next growth phase is being shaped by industrial clusters upgrading to compressed natural gas (CNG) and bio-CNG systems. Startups are entering the space with low-maintenance, tamper-proof designs ideal for rural gas distribution and smart metering integrations, especially in smart city development zones.

Country CAGR (2025 to 2035)
India 4.3%

South Korea

South Korea is advancing toward gas digitization under its national clean energy roadmap. Gas pressure regulators are seeing increased demand in residential and commercial settings equipped with smart sensors and AI-based fault diagnostics. Additionally, the growing use of hydrogen as a transport and heating fuel is pushing R&D toward micro-regulators with ultra-sensitive adjustment capabilities suited for hydrogen’s light molecular profile.

Country CAGR (2025 to 2035)
South Korea 4.2%

Competitive Outlook

Exponential industrialization, hydrogen shift, and tighter safety protocols for gas flow are boosting the need for sophisticated gas pressure regulators. Industry players now specialize in regulators with extreme pressure-handling capabilities, zero leakage tolerance, and the incorporation of real-time diagnostics.

Applications span across semiconductor fabs with ultra-high-purity (UHP) lines to hydrogen refuelling stations where precise delivery in varying demand situations is required. To address them, companies are designing dome-loaded, spring-loaded, and electronic pressure regulators that include embedded sensors for predictive maintenance.
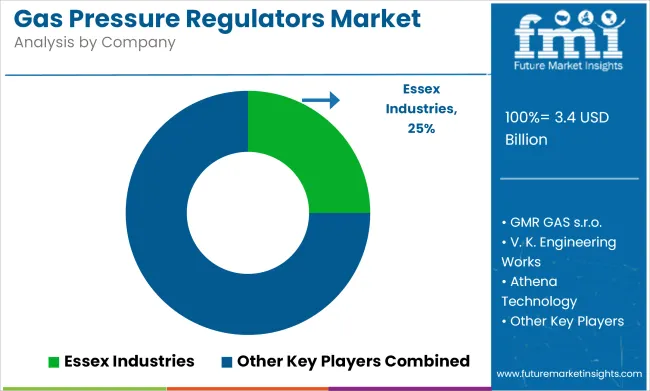
Key Company Insights

Gas Pressure Regulators Market Analysis By Company

Emerson Electric (24-28%)

Emerson is in the lead with comprehensive regulatory solutions in energy, chemical, and hydrogen segments. Its ER5000 series balances high-performance ruggedness with intelligent controls, which enables utilities and energy centers to minimize manual intervention in high-risk locations.

The Linde Group (18-22%)

Linde uses its domination of gas supply to provide in-house-designed regulators engineered for semiconductor and hydrogen applications. Its dual-stage configurations provide consistent pressure control throughout transient gas requirements in clean tech installations.

Air Liquide (14-18%)

Air Liquide spans industrial and healthcare markets with an emphasis on safety and digitalization. Its intelligent medical regulators with in-built leak detection systems address increasing hospital safety standards, particularly in developing economies.

Cavagna Group (9-12%)

Cavagna combines Italian technology with IoT preparedness, being the leading LPG and specialty gas company. Its 2025 launch of digital brewery regulators is a reflection of increasing niche markets requiring precision as well as smart notifications.

Itron Inc. (6-9%)

Itron's capability is in utility-scale deployment. Its smart grid-ready regulators, which automatically adjust according to real-time demand, enable next-generation energy infrastructure in cities going into distributed gas systems.

Other Key Players (13-17% Combined)

  • Parker Hannifin Corp.
  • Honeywell Process Solutions
  • Rotarex S.A.
  • SMC Corporation
  • Genstar Technologies
  • Air Water Inc.
  • Harris Products Group (Lincoln Electric)
  • AP Tech (Advanced Pressure Technology)
  • Festo AG & Co. KG
  • Tescom (Subsidiary of Emerson)

Comprehensive Report Scope and Coverage Overview

Report Attributes Details
Market Size in 2025 USD 3.38 billion
Projected Market Size in 2035 USD 5.14 billion
CAGR (2025 to 2035) 4.3%
Base Year for Estimation 2024
Historical Period 2020 to 2024
Projections Period 2025 to 2035
Quantitative Units USD billion for value
Regions Covered North America, Latin America, Western Europe, Eastern Europe, East Asia, South Asia & Pacific, Middle East & Africa
Countries Covered United States, Canada, Mexico, Brazil, Argentina, Germany, France, United Kingdom, Italy, Spain, Netherlands, China, India, Japan, South Korea, GCC Countries, South Africa
Key Players influencing the Market Essex Industries, Greggersen Gasetechnik, GMR GAS s.r.o., V. K. Engineering Works, Athena Technology, SAP INDUSTRIES, DEM Machinery Co., Ltd., NISSAN TANAKA CORPORATION, Tewelding Engineers, ESKA
Additional Attributes Dollar sales by region (North America, Europe, etc.), Growth trends in gas pressure regulators demand across industries like oil & gas, healthcare, and food & beverages, Regional adoption and regulatory compliance in gas pressure regulation systems

Key Segmentation of Gas Pressure Regulators Industry

By Type:

  • Single Stage Regulator
  • Dual Stage Regulator
  • Third Stage Regulator
  • Dual Inlet Regulator
  • Auto Changeover Regulator

By Type of Gas:

  • Fuel Gases
    • Liquid Propane
    • Compressed Natural Gas
  • Corrosive Gases
  • Oxidizers
  • Inert Gases
  • Toxic Gases

By End-User:

  • Commercial
  • Industrial
  • Household

By Region:

  • North America
  • Latin America
  • Western Europe
  • Eastern Europe
  • East Asia
  • South Asia Pacific
  • Middle East and Africa

Table of Content

  1. Executive Summary
  2. Industry Introduction, including Taxonomy and Market Definition
  3. Market Trends and Success Factors, including Macro-economic Factors, Market Dynamics, and Recent Industry Developments
  4. Global Market Demand Analysis 2020 to 2024 and Forecast 2025 to 2035, including Historical Analysis and Future Projections
  5. Global Market Analysis 2020 to 2024 and Forecast 2025 to 2035
    • Type
    • Type of Gas
    • End-User
  6. Global Market Analysis 2020 to 2024 and Forecast 2025 to 2035, By Type
    • Single Stage Regulator
    • Dual Stage Regulator
    • Third Stage Regulator
    • Dual Inlet Regulator
    • Auto Changeover Regulator
  7. Global Market Analysis 2020 to 2024 and Forecast 2025 to 2035, By Type of Gas
    • Fuel Gases
    • Corrosive Gases
    • Oxidizers
    • Inert Gases
    • Toxic Gases
  8. Global Market Analysis 2020 to 2024 and Forecast 2025 to 2035, By End-User
    • Commercial
    • Industrial
    • Household
  9. Global Market Analysis 2020 to 2024 and Forecast 2025 to 2035, By Region
    • North America
    • Latin America
    • Western Europe
    • Eastern Europe
    • East Asia
    • South Asia Pacific
    • Middle East and Africa
  10. North America Sales Analysis 2020 to 2024 and Forecast 2025 to 2035, by Key Segments and Countries
  11. Latin America Sales Analysis 2020 to 2024 and Forecast 2025 to 2035, by Key Segments and Countries
  12. Western Europe Sales Analysis 2020 to 2024 and Forecast 2025 to 2035, by Key Segments and Countries
  13. Eastern Europe Sales Analysis 2020 to 2024 and Forecast 2025 to 2035, by Key Segments and Countries
  14. East Asia Sales Analysis 2020 to 2024 and Forecast 2025 to 2035, by Key Segments and Countries
  15. South Asia Pacific Sales Analysis 2020 to 2024 and Forecast 2025 to 2035, by Key Segments and Countries
  16. Middle East and Africa Sales Analysis 2020 to 2024 and Forecast 2025 to 2035, by Key Segments and Countries
  17. Sales Forecast 2025 to 2035 by Type, Type of Gas, and End-User for 30 Countries
  18. Competition Outlook, including Market Structure Analysis, Company Share Analysis by Key Players, and Competition Dashboard
  19. Company Profile
    • Essex Industries
    • Greggersen Gasetechnik
    • GMR GAS s.r.o.
    • V. K. Engineering Works
    • Athena Technology
    • SAP INDUSTRIES
    • DEM Machinery Co., Ltd.
    • NISSAN TANAKA CORPORATION
    • Tewelding Engineers
    • ESKA

List of Tables

  • Table 1: Global Market Value (US$ Million) Forecast by Region, 2020 to 2035
  • Table 2: Global Market Volume (Units) Forecast by Region, 2020 to 2035
  • Table 3: Global Market Value (US$ Million) Forecast by Type, 2020 to 2035
  • Table 4: Global Market Volume (Units) Forecast by Type, 2020 to 2035
  • Table 5: Global Market Value (US$ Million) Forecast by Type of Gas, 2020 to 2035
  • Table 6: Global Market Volume (Units) Forecast by Type of Gas, 2020 to 2035
  • Table 7: Global Market Value (US$ Million) Forecast by End User, 2020 to 2035
  • Table 8: Global Market Volume (Units) Forecast by End User, 2020 to 2035
  • Table 9: North America Market Value (US$ Million) Forecast by Country, 2020 to 2035
  • Table 10: North America Market Volume (Units) Forecast by Country, 2020 to 2035
  • Table 11: North America Market Value (US$ Million) Forecast by Type, 2020 to 2035
  • Table 12: North America Market Volume (Units) Forecast by Type, 2020 to 2035
  • Table 13: North America Market Value (US$ Million) Forecast by Type of Gas, 2020 to 2035
  • Table 14: North America Market Volume (Units) Forecast by Type of Gas, 2020 to 2035
  • Table 15: North America Market Value (US$ Million) Forecast by End User, 2020 to 2035
  • Table 16: North America Market Volume (Units) Forecast by End User, 2020 to 2035
  • Table 17: Latin America Market Value (US$ Million) Forecast by Country, 2020 to 2035
  • Table 18: Latin America Market Volume (Units) Forecast by Country, 2020 to 2035
  • Table 19: Latin America Market Value (US$ Million) Forecast by Type, 2020 to 2035
  • Table 20: Latin America Market Volume (Units) Forecast by Type, 2020 to 2035
  • Table 21: Latin America Market Value (US$ Million) Forecast by Type of Gas, 2020 to 2035
  • Table 22: Latin America Market Volume (Units) Forecast by Type of Gas, 2020 to 2035
  • Table 23: Latin America Market Value (US$ Million) Forecast by End User, 2020 to 2035
  • Table 24: Latin America Market Volume (Units) Forecast by End User, 2020 to 2035
  • Table 25: Europe Market Value (US$ Million) Forecast by Country, 2020 to 2035
  • Table 26: Europe Market Volume (Units) Forecast by Country, 2020 to 2035
  • Table 27: Europe Market Value (US$ Million) Forecast by Type, 2020 to 2035
  • Table 28: Europe Market Volume (Units) Forecast by Type, 2020 to 2035
  • Table 29: Europe Market Value (US$ Million) Forecast by Type of Gas, 2020 to 2035
  • Table 30: Europe Market Volume (Units) Forecast by Type of Gas, 2020 to 2035
  • Table 31: Europe Market Value (US$ Million) Forecast by End User, 2020 to 2035
  • Table 32: Europe Market Volume (Units) Forecast by End User, 2020 to 2035
  • Table 33: South Asia Market Value (US$ Million) Forecast by Country, 2020 to 2035
  • Table 34: South Asia Market Volume (Units) Forecast by Country, 2020 to 2035
  • Table 35: South Asia Market Value (US$ Million) Forecast by Type, 2020 to 2035
  • Table 36: South Asia Market Volume (Units) Forecast by Type, 2020 to 2035
  • Table 37: South Asia Market Value (US$ Million) Forecast by Type of Gas, 2020 to 2035
  • Table 38: South Asia Market Volume (Units) Forecast by Type of Gas, 2020 to 2035
  • Table 39: South Asia Market Value (US$ Million) Forecast by End User, 2020 to 2035
  • Table 40: South Asia Market Volume (Units) Forecast by End User, 2020 to 2035
  • Table 41: East Asia Market Value (US$ Million) Forecast by Country, 2020 to 2035
  • Table 42: East Asia Market Volume (Units) Forecast by Country, 2020 to 2035
  • Table 43: East Asia Market Value (US$ Million) Forecast by Type, 2020 to 2035
  • Table 44: East Asia Market Volume (Units) Forecast by Type, 2020 to 2035
  • Table 45: East Asia Market Value (US$ Million) Forecast by Type of Gas, 2020 to 2035
  • Table 46: East Asia Market Volume (Units) Forecast by Type of Gas, 2020 to 2035
  • Table 47: East Asia Market Value (US$ Million) Forecast by End User, 2020 to 2035
  • Table 48: East Asia Market Volume (Units) Forecast by End User, 2020 to 2035
  • Table 49: Oceania Market Value (US$ Million) Forecast by Country, 2020 to 2035
  • Table 50: Oceania Market Volume (Units) Forecast by Country, 2020 to 2035
  • Table 51: Oceania Market Value (US$ Million) Forecast by Type, 2020 to 2035
  • Table 52: Oceania Market Volume (Units) Forecast by Type, 2020 to 2035
  • Table 53: Oceania Market Value (US$ Million) Forecast by Type of Gas, 2020 to 2035
  • Table 54: Oceania Market Volume (Units) Forecast by Type of Gas, 2020 to 2035
  • Table 55: Oceania Market Value (US$ Million) Forecast by End User, 2020 to 2035
  • Table 56: Oceania Market Volume (Units) Forecast by End User, 2020 to 2035
  • Table 57: MEA Market Value (US$ Million) Forecast by Country, 2020 to 2035
  • Table 58: MEA Market Volume (Units) Forecast by Country, 2020 to 2035
  • Table 59: MEA Market Value (US$ Million) Forecast by Type, 2020 to 2035
  • Table 60: MEA Market Volume (Units) Forecast by Type, 2020 to 2035
  • Table 61: MEA Market Value (US$ Million) Forecast by Type of Gas, 2020 to 2035
  • Table 62: MEA Market Volume (Units) Forecast by Type of Gas, 2020 to 2035
  • Table 63: MEA Market Value (US$ Million) Forecast by End User, 2020 to 2035
  • Table 64: MEA Market Volume (Units) Forecast by End User, 2020 to 2035

List of Figures

  • Figure 1: Global Market Value (US$ Million) by Type, 2025 to 2035
  • Figure 2: Global Market Value (US$ Million) by Type of Gas, 2025 to 2035
  • Figure 3: Global Market Value (US$ Million) by End User, 2025 to 2035
  • Figure 4: Global Market Value (US$ Million) by Region, 2025 to 2035
  • Figure 5: Global Market Value (US$ Million) Analysis by Region, 2020 to 2035
  • Figure 6: Global Market Volume (Units) Analysis by Region, 2020 to 2035
  • Figure 7: Global Market Value Share (%) and BPS Analysis by Region, 2025 to 2035
  • Figure 8: Global Market Y-o-Y Growth (%) Projections by Region, 2025 to 2035
  • Figure 9: Global Market Value (US$ Million) Analysis by Type, 2020 to 2035
  • Figure 10: Global Market Volume (Units) Analysis by Type, 2020 to 2035
  • Figure 11: Global Market Value Share (%) and BPS Analysis by Type, 2025 to 2035
  • Figure 12: Global Market Y-o-Y Growth (%) Projections by Type, 2025 to 2035
  • Figure 13: Global Market Value (US$ Million) Analysis by Type of Gas, 2020 to 2035
  • Figure 14: Global Market Volume (Units) Analysis by Type of Gas, 2020 to 2035
  • Figure 15: Global Market Value Share (%) and BPS Analysis by Type of Gas, 2025 to 2035
  • Figure 16: Global Market Y-o-Y Growth (%) Projections by Type of Gas, 2025 to 2035
  • Figure 17: Global Market Value (US$ Million) Analysis by End User, 2020 to 2035
  • Figure 18: Global Market Volume (Units) Analysis by End User, 2020 to 2035
  • Figure 19: Global Market Value Share (%) and BPS Analysis by End User, 2025 to 2035
  • Figure 20: Global Market Y-o-Y Growth (%) Projections by End User, 2025 to 2035
  • Figure 21: Global Market Attractiveness by Type, 2025 to 2035
  • Figure 22: Global Market Attractiveness by Type of Gas, 2025 to 2035
  • Figure 23: Global Market Attractiveness by End User, 2025 to 2035
  • Figure 24: Global Market Attractiveness by Region, 2025 to 2035
  • Figure 25: North America Market Value (US$ Million) by Type, 2025 to 2035
  • Figure 26: North America Market Value (US$ Million) by Type of Gas, 2025 to 2035
  • Figure 27: North America Market Value (US$ Million) by End User, 2025 to 2035
  • Figure 28: North America Market Value (US$ Million) by Country, 2025 to 2035
  • Figure 29: North America Market Value (US$ Million) Analysis by Country, 2020 to 2035
  • Figure 30: North America Market Volume (Units) Analysis by Country, 2020 to 2035
  • Figure 31: North America Market Value Share (%) and BPS Analysis by Country, 2025 to 2035
  • Figure 32: North America Market Y-o-Y Growth (%) Projections by Country, 2025 to 2035
  • Figure 33: North America Market Value (US$ Million) Analysis by Type, 2020 to 2035
  • Figure 34: North America Market Volume (Units) Analysis by Type, 2020 to 2035
  • Figure 35: North America Market Value Share (%) and BPS Analysis by Type, 2025 to 2035
  • Figure 36: North America Market Y-o-Y Growth (%) Projections by Type, 2025 to 2035
  • Figure 37: North America Market Value (US$ Million) Analysis by Type of Gas, 2020 to 2035
  • Figure 38: North America Market Volume (Units) Analysis by Type of Gas, 2020 to 2035
  • Figure 39: North America Market Value Share (%) and BPS Analysis by Type of Gas, 2025 to 2035
  • Figure 40: North America Market Y-o-Y Growth (%) Projections by Type of Gas, 2025 to 2035
  • Figure 41: North America Market Value (US$ Million) Analysis by End User, 2020 to 2035
  • Figure 42: North America Market Volume (Units) Analysis by End User, 2020 to 2035
  • Figure 43: North America Market Value Share (%) and BPS Analysis by End User, 2025 to 2035
  • Figure 44: North America Market Y-o-Y Growth (%) Projections by End User, 2025 to 2035
  • Figure 45: North America Market Attractiveness by Type, 2025 to 2035
  • Figure 46: North America Market Attractiveness by Type of Gas, 2025 to 2035
  • Figure 47: North America Market Attractiveness by End User, 2025 to 2035
  • Figure 48: North America Market Attractiveness by Country, 2025 to 2035
  • Figure 49: Latin America Market Value (US$ Million) by Type, 2025 to 2035
  • Figure 50: Latin America Market Value (US$ Million) by Type of Gas, 2025 to 2035
  • Figure 51: Latin America Market Value (US$ Million) by End User, 2025 to 2035
  • Figure 52: Latin America Market Value (US$ Million) by Country, 2025 to 2035
  • Figure 53: Latin America Market Value (US$ Million) Analysis by Country, 2020 to 2035
  • Figure 54: Latin America Market Volume (Units) Analysis by Country, 2020 to 2035
  • Figure 55: Latin America Market Value Share (%) and BPS Analysis by Country, 2025 to 2035
  • Figure 56: Latin America Market Y-o-Y Growth (%) Projections by Country, 2025 to 2035
  • Figure 57: Latin America Market Value (US$ Million) Analysis by Type, 2020 to 2035
  • Figure 58: Latin America Market Volume (Units) Analysis by Type, 2020 to 2035
  • Figure 59: Latin America Market Value Share (%) and BPS Analysis by Type, 2025 to 2035
  • Figure 60: Latin America Market Y-o-Y Growth (%) Projections by Type, 2025 to 2035
  • Figure 61: Latin America Market Value (US$ Million) Analysis by Type of Gas, 2020 to 2035
  • Figure 62: Latin America Market Volume (Units) Analysis by Type of Gas, 2020 to 2035
  • Figure 63: Latin America Market Value Share (%) and BPS Analysis by Type of Gas, 2025 to 2035
  • Figure 64: Latin America Market Y-o-Y Growth (%) Projections by Type of Gas, 2025 to 2035
  • Figure 65: Latin America Market Value (US$ Million) Analysis by End User, 2020 to 2035
  • Figure 66: Latin America Market Volume (Units) Analysis by End User, 2020 to 2035
  • Figure 67: Latin America Market Value Share (%) and BPS Analysis by End User, 2025 to 2035
  • Figure 68: Latin America Market Y-o-Y Growth (%) Projections by End User, 2025 to 2035
  • Figure 69: Latin America Market Attractiveness by Type, 2025 to 2035
  • Figure 70: Latin America Market Attractiveness by Type of Gas, 2025 to 2035
  • Figure 71: Latin America Market Attractiveness by End User, 2025 to 2035
  • Figure 72: Latin America Market Attractiveness by Country, 2025 to 2035
  • Figure 73: Europe Market Value (US$ Million) by Type, 2025 to 2035
  • Figure 74: Europe Market Value (US$ Million) by Type of Gas, 2025 to 2035
  • Figure 75: Europe Market Value (US$ Million) by End User, 2025 to 2035
  • Figure 76: Europe Market Value (US$ Million) by Country, 2025 to 2035
  • Figure 77: Europe Market Value (US$ Million) Analysis by Country, 2020 to 2035
  • Figure 78: Europe Market Volume (Units) Analysis by Country, 2020 to 2035
  • Figure 79: Europe Market Value Share (%) and BPS Analysis by Country, 2025 to 2035
  • Figure 80: Europe Market Y-o-Y Growth (%) Projections by Country, 2025 to 2035
  • Figure 81: Europe Market Value (US$ Million) Analysis by Type, 2020 to 2035
  • Figure 82: Europe Market Volume (Units) Analysis by Type, 2020 to 2035
  • Figure 83: Europe Market Value Share (%) and BPS Analysis by Type, 2025 to 2035
  • Figure 84: Europe Market Y-o-Y Growth (%) Projections by Type, 2025 to 2035
  • Figure 85: Europe Market Value (US$ Million) Analysis by Type of Gas, 2020 to 2035
  • Figure 86: Europe Market Volume (Units) Analysis by Type of Gas, 2020 to 2035
  • Figure 87: Europe Market Value Share (%) and BPS Analysis by Type of Gas, 2025 to 2035
  • Figure 88: Europe Market Y-o-Y Growth (%) Projections by Type of Gas, 2025 to 2035
  • Figure 89: Europe Market Value (US$ Million) Analysis by End User, 2020 to 2035
  • Figure 90: Europe Market Volume (Units) Analysis by End User, 2020 to 2035
  • Figure 91: Europe Market Value Share (%) and BPS Analysis by End User, 2025 to 2035
  • Figure 92: Europe Market Y-o-Y Growth (%) Projections by End User, 2025 to 2035
  • Figure 93: Europe Market Attractiveness by Type, 2025 to 2035
  • Figure 94: Europe Market Attractiveness by Type of Gas, 2025 to 2035
  • Figure 95: Europe Market Attractiveness by End User, 2025 to 2035
  • Figure 96: Europe Market Attractiveness by Country, 2025 to 2035
  • Figure 97: South Asia Market Value (US$ Million) by Type, 2025 to 2035
  • Figure 98: South Asia Market Value (US$ Million) by Type of Gas, 2025 to 2035
  • Figure 99: South Asia Market Value (US$ Million) by End User, 2025 to 2035
  • Figure 100: South Asia Market Value (US$ Million) by Country, 2025 to 2035
  • Figure 101: South Asia Market Value (US$ Million) Analysis by Country, 2020 to 2035
  • Figure 102: South Asia Market Volume (Units) Analysis by Country, 2020 to 2035
  • Figure 103: South Asia Market Value Share (%) and BPS Analysis by Country, 2025 to 2035
  • Figure 104: South Asia Market Y-o-Y Growth (%) Projections by Country, 2025 to 2035
  • Figure 105: South Asia Market Value (US$ Million) Analysis by Type, 2020 to 2035
  • Figure 106: South Asia Market Volume (Units) Analysis by Type, 2020 to 2035
  • Figure 107: South Asia Market Value Share (%) and BPS Analysis by Type, 2025 to 2035
  • Figure 108: South Asia Market Y-o-Y Growth (%) Projections by Type, 2025 to 2035
  • Figure 109: South Asia Market Value (US$ Million) Analysis by Type of Gas, 2020 to 2035
  • Figure 110: South Asia Market Volume (Units) Analysis by Type of Gas, 2020 to 2035
  • Figure 111: South Asia Market Value Share (%) and BPS Analysis by Type of Gas, 2025 to 2035
  • Figure 112: South Asia Market Y-o-Y Growth (%) Projections by Type of Gas, 2025 to 2035
  • Figure 113: South Asia Market Value (US$ Million) Analysis by End User, 2020 to 2035
  • Figure 114: South Asia Market Volume (Units) Analysis by End User, 2020 to 2035
  • Figure 115: South Asia Market Value Share (%) and BPS Analysis by End User, 2025 to 2035
  • Figure 116: South Asia Market Y-o-Y Growth (%) Projections by End User, 2025 to 2035
  • Figure 117: South Asia Market Attractiveness by Type, 2025 to 2035
  • Figure 118: South Asia Market Attractiveness by Type of Gas, 2025 to 2035
  • Figure 119: South Asia Market Attractiveness by End User, 2025 to 2035
  • Figure 120: South Asia Market Attractiveness by Country, 2025 to 2035
  • Figure 121: East Asia Market Value (US$ Million) by Type, 2025 to 2035
  • Figure 122: East Asia Market Value (US$ Million) by Type of Gas, 2025 to 2035
  • Figure 123: East Asia Market Value (US$ Million) by End User, 2025 to 2035
  • Figure 124: East Asia Market Value (US$ Million) by Country, 2025 to 2035
  • Figure 125: East Asia Market Value (US$ Million) Analysis by Country, 2020 to 2035
  • Figure 126: East Asia Market Volume (Units) Analysis by Country, 2020 to 2035
  • Figure 127: East Asia Market Value Share (%) and BPS Analysis by Country, 2025 to 2035
  • Figure 128: East Asia Market Y-o-Y Growth (%) Projections by Country, 2025 to 2035
  • Figure 129: East Asia Market Value (US$ Million) Analysis by Type, 2020 to 2035
  • Figure 130: East Asia Market Volume (Units) Analysis by Type, 2020 to 2035
  • Figure 131: East Asia Market Value Share (%) and BPS Analysis by Type, 2025 to 2035
  • Figure 132: East Asia Market Y-o-Y Growth (%) Projections by Type, 2025 to 2035
  • Figure 133: East Asia Market Value (US$ Million) Analysis by Type of Gas, 2020 to 2035
  • Figure 134: East Asia Market Volume (Units) Analysis by Type of Gas, 2020 to 2035
  • Figure 135: East Asia Market Value Share (%) and BPS Analysis by Type of Gas, 2025 to 2035
  • Figure 136: East Asia Market Y-o-Y Growth (%) Projections by Type of Gas, 2025 to 2035
  • Figure 137: East Asia Market Value (US$ Million) Analysis by End User, 2020 to 2035
  • Figure 138: East Asia Market Volume (Units) Analysis by End User, 2020 to 2035
  • Figure 139: East Asia Market Value Share (%) and BPS Analysis by End User, 2025 to 2035
  • Figure 140: East Asia Market Y-o-Y Growth (%) Projections by End User, 2025 to 2035
  • Figure 141: East Asia Market Attractiveness by Type, 2025 to 2035
  • Figure 142: East Asia Market Attractiveness by Type of Gas, 2025 to 2035
  • Figure 143: East Asia Market Attractiveness by End User, 2025 to 2035
  • Figure 144: East Asia Market Attractiveness by Country, 2025 to 2035
  • Figure 145: Oceania Market Value (US$ Million) by Type, 2025 to 2035
  • Figure 146: Oceania Market Value (US$ Million) by Type of Gas, 2025 to 2035
  • Figure 147: Oceania Market Value (US$ Million) by End User, 2025 to 2035
  • Figure 148: Oceania Market Value (US$ Million) by Country, 2025 to 2035
  • Figure 149: Oceania Market Value (US$ Million) Analysis by Country, 2020 to 2035
  • Figure 150: Oceania Market Volume (Units) Analysis by Country, 2020 to 2035
  • Figure 151: Oceania Market Value Share (%) and BPS Analysis by Country, 2025 to 2035
  • Figure 152: Oceania Market Y-o-Y Growth (%) Projections by Country, 2025 to 2035
  • Figure 153: Oceania Market Value (US$ Million) Analysis by Type, 2020 to 2035
  • Figure 154: Oceania Market Volume (Units) Analysis by Type, 2020 to 2035
  • Figure 155: Oceania Market Value Share (%) and BPS Analysis by Type, 2025 to 2035
  • Figure 156: Oceania Market Y-o-Y Growth (%) Projections by Type, 2025 to 2035
  • Figure 157: Oceania Market Value (US$ Million) Analysis by Type of Gas, 2020 to 2035
  • Figure 158: Oceania Market Volume (Units) Analysis by Type of Gas, 2020 to 2035
  • Figure 159: Oceania Market Value Share (%) and BPS Analysis by Type of Gas, 2025 to 2035
  • Figure 160: Oceania Market Y-o-Y Growth (%) Projections by Type of Gas, 2025 to 2035
  • Figure 161: Oceania Market Value (US$ Million) Analysis by End User, 2020 to 2035
  • Figure 162: Oceania Market Volume (Units) Analysis by End User, 2020 to 2035
  • Figure 163: Oceania Market Value Share (%) and BPS Analysis by End User, 2025 to 2035
  • Figure 164: Oceania Market Y-o-Y Growth (%) Projections by End User, 2025 to 2035
  • Figure 165: Oceania Market Attractiveness by Type, 2025 to 2035
  • Figure 166: Oceania Market Attractiveness by Type of Gas, 2025 to 2035
  • Figure 167: Oceania Market Attractiveness by End User, 2025 to 2035
  • Figure 168: Oceania Market Attractiveness by Country, 2025 to 2035
  • Figure 169: MEA Market Value (US$ Million) by Type, 2025 to 2035
  • Figure 170: MEA Market Value (US$ Million) by Type of Gas, 2025 to 2035
  • Figure 171: MEA Market Value (US$ Million) by End User, 2025 to 2035
  • Figure 172: MEA Market Value (US$ Million) by Country, 2025 to 2035
  • Figure 173: MEA Market Value (US$ Million) Analysis by Country, 2020 to 2035
  • Figure 174: MEA Market Volume (Units) Analysis by Country, 2020 to 2035
  • Figure 175: MEA Market Value Share (%) and BPS Analysis by Country, 2025 to 2035
  • Figure 176: MEA Market Y-o-Y Growth (%) Projections by Country, 2025 to 2035
  • Figure 177: MEA Market Value (US$ Million) Analysis by Type, 2020 to 2035
  • Figure 178: MEA Market Volume (Units) Analysis by Type, 2020 to 2035
  • Figure 179: MEA Market Value Share (%) and BPS Analysis by Type, 2025 to 2035
  • Figure 180: MEA Market Y-o-Y Growth (%) Projections by Type, 2025 to 2035
  • Figure 181: MEA Market Value (US$ Million) Analysis by Type of Gas, 2020 to 2035
  • Figure 182: MEA Market Volume (Units) Analysis by Type of Gas, 2020 to 2035
  • Figure 183: MEA Market Value Share (%) and BPS Analysis by Type of Gas, 2025 to 2035
  • Figure 184: MEA Market Y-o-Y Growth (%) Projections by Type of Gas, 2025 to 2035
  • Figure 185: MEA Market Value (US$ Million) Analysis by End User, 2020 to 2035
  • Figure 186: MEA Market Volume (Units) Analysis by End User, 2020 to 2035
  • Figure 187: MEA Market Value Share (%) and BPS Analysis by End User, 2025 to 2035
  • Figure 188: MEA Market Y-o-Y Growth (%) Projections by End User, 2025 to 2035
  • Figure 189: MEA Market Attractiveness by Type, 2025 to 2035
  • Figure 190: MEA Market Attractiveness by Type of Gas, 2025 to 2035
  • Figure 191: MEA Market Attractiveness by End User, 2025 to 2035
  • Figure 192: MEA Market Attractiveness by Country, 2025 to 2035

Frequently Asked Questions

What was the overall size of the gas pressure regulators market in 2025?

The overall market size for gas pressure regulators market was USD 3.38 billion in 2025.

How big is the gas pressure regulators market expected to be in 2035?

The gas pressure regulators market is expected to reach USD 5.14 billion in 2035.

What will drive the demand for gas pressure regulators market during the forecast period?

The expanding demand for natural gas in residential and industrial sectors, along with stricter safety regulations, fuels the gas pressure regulators market during the forecast period.

List the top 5 countries contributing in gas pressure regulators market?

The top 5 countries which drive the development of gas pressure regulators market are USA, China, India, Germany, and Japan.

Which is the leading segment in the gas pressure regulators market?

On the basis of type, single-stage regulators to command significant share over the forecast period.

Explore Similar Insights

Future Market Insights

Gas Pressure Regulators Market