The Gas Insulated Power Equipment Market is estimated to be valued at USD 29.1 billion in 2025 and is projected to reach USD 62.9 billion by 2035, registering a compound annual growth rate (CAGR) of 8.0% over the forecast period. Based on the analysis, the market portrays an initial acceleration phase, where values climb from USD 31.5 billion in 2026 to USD 53.9 billion in 2033, reflecting nearly 70% value addition in seven years. However, post-2033 growth tapers, as annual increments shrink from USD 4.3 billion to about USD 3 billion, signaling saturation after 2034.
With a CAGR of 8.0%, this category outpaces most electrical infrastructure segments, driven by renewable integration and substation upgrades. The market achieves USD 62.9 billion in 2035, doubling its 2025 value. While initial expansion benefits from electrification projects, late-phase slowdown suggests possible competitive pricing and technology commoditization. Strategic focus will shift toward predictive maintenance and lifecycle cost reduction to maintain margins in this nearing-maturity stage.
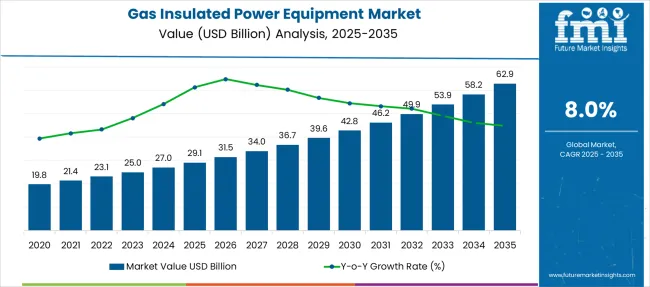
The market’s growth curve shows a strong upward incline, signaling accelerating adoption driven by space-saving requirements, high voltage reliability, and stringent environmental regulations. Unlike traditional air-insulated solutions, gas insulated equipment offers superior insulation performance, making it critical for dense urban infrastructure and renewable energy integration.
Gas Insulated Switchgear (GIS) dominates with 34.7% share in 2025, driven by its compact design and suitability for high-voltage applications in constrained spaces. Asia-Pacific leads market expansion, propelled by rapid grid modernization in China and India, while North America and Europe show steady uptake linked to aging grid replacements and advanced transmission projects.
The growth trajectory is likely to steepen after 2028 as smart grid deployments and renewable power integration demand compact, high-efficiency equipment. Opportunities include eco-friendly alternatives to SF₆ gas, advanced monitoring systems, and hybrid switchgear solutions to reduce lifecycle emissions.
| Metric | Value |
|---|---|
| Gas Insulated Power Equipment Market Estimated Value in (2025 E) | USD 29.1 billion |
| Gas Insulated Power Equipment Market Forecast Value in (2035 F) | USD 62.9 billion |
| Forecast CAGR (2025 to 2035) | 8.0% |
The gas insulated power equipment market is undergoing sustained growth as grid modernization, urban density, and renewable energy integration continue to shape infrastructure needs. The demand for compact, high-efficiency electrical systems has led to widespread deployment of gas insulated equipment, especially in urban centers and high voltage applications where space and safety are paramount.
Governments and utilities are investing heavily in substation upgrades, grid resilience, and energy security which is pushing the adoption of SF6 and alternative gas insulated systems across primary and secondary distribution networks. Technological advancements in dielectric insulation, vacuum switching, and digital monitoring have improved equipment longevity and diagnostic accuracy, thereby reducing lifecycle costs.
Rising electrification across transport, industry, and housing in developing economies is contributing to consistent demand. As regulatory frameworks tighten around environmental compliance and operational safety, manufacturers are accelerating innovation in eco-efficient gas alternatives and predictive maintenance solutions which are expected to drive long-term market expansion.
The gas insulated power equipment market is segmented by product type, end use, and region. By product type, it includes gas-insulated switchgear (GIS), gas-insulated transmission lines (GIL), gas-insulated substations (GIS substations), circuit breakers, disconnectors, and others such as current transformers and voltage transformers. In terms of end use, the segmentation comprises power utilities, industrial sectors including oil and gas and mining, commercial and institutional facilities, transportation infrastructure such as railways and airports, and renewable energy plants. Regionally, the market spans North America, Latin America, Western and Eastern Europe, Balkan and Baltic countries, Russia and Belarus, Central Asia, East Asia, South Asia and Pacific, and the Middle East and Africa.
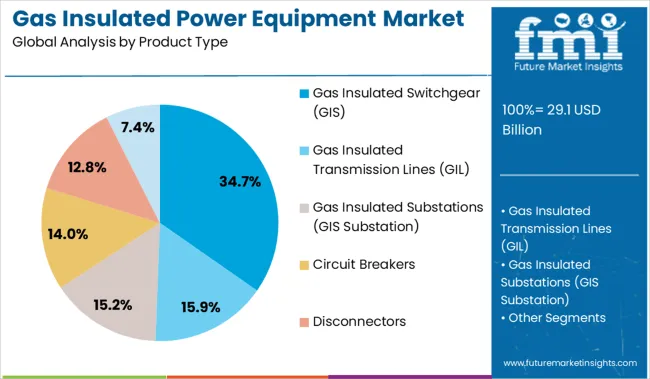
Gas insulated switchgear is projected to hold 34.7% of the total revenue in the gas insulated power equipment market by 2025, positioning it as the leading product category. This dominance is being driven by GIS systems' ability to deliver high reliability and compact design in voltage transmission and distribution. Unlike air insulated systems, GIS configurations enable higher power density and reduced installation space which is critical in underground and urban substation environments.
Enhanced resistance to environmental conditions including humidity, dust, and pollution further supports the segment’s adoption in harsh operating zones. GIS technology offers superior safety and operational control through sealed enclosures and arc fault containment which align with global electrical safety standards.
Utilities and industrial users continue to prioritize GIS for critical load centers and renewable energy integration due to its modularity and low maintenance profile. Ongoing innovation in digital switchgear and gas alternatives to SF6 are strengthening the segment’s sustainability outlook and reinforcing its leadership across infrastructure investment pipelines.
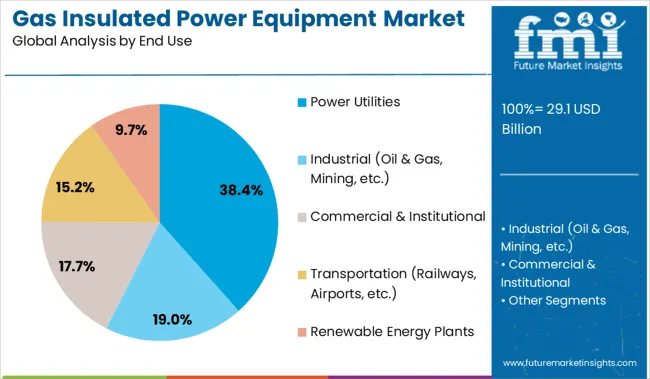
The power utilities segment is anticipated to command 38.4% of the revenue share in the gas insulated power equipment market by 2025, making it the top end use sector. This leading position is supported by escalating investment in grid modernization, substation reliability, and capacity upgrades required to support growing power demand and renewable integration. Utilities are increasingly deploying gas insulated equipment to manage high-voltage operations with minimal spatial footprint and enhanced environmental protection.
The demand is further amplified by the transition toward decentralized energy networks which require more flexible and modular grid nodes. Power utilities are adopting digital substation models incorporating condition monitoring and automated diagnostics that are fully compatible with gas insulated platforms.
Government-backed electrification programs and policy-driven targets for grid stability are pushing utilities to replace aging infrastructure with gas insulated systems that ensure operational continuity and safety. With growing attention on reducing transmission losses and blackout risks, utilities are projected to remain the primary drivers of demand across the forecast period.
Demand for gas insulated power equipment continues to expand in response to space-limited environments, safety constraints, and reliability planning needs. Utilities and industrial sites are investing in compact switchgear, substations, and circuit breakers that reduce exposure risk and service time. Shift in procurement favors factory-assembled modules, enabling shorter deployment cycles and improved fault isolation.
By mid-2025, over 40% of newly tendered high-voltage installations in Europe and East Asia selected gas-insulated variants. Regulatory pressure around emissions has also prompted re-engineering of enclosure systems and alternative gas blends. These shifts are guiding both upstream component suppliers and service integrators to retool offerings and close performance gaps with legacy air-based systems.
Power providers and industrial operators are selecting gas-insulated designs to meet layout limits, reliability targets, and exposure control requirements. A 2025 survey of 56 utility firms across Asia and Europe showed that 63% of new substation orders now include gas-insulated switchgear (GIS) rather than air-insulated alternatives. In dense or high-risk zones, GIS systems reduce spatial demand by up to 70% and maintain enclosed operations, limiting moisture and particulate interference.
Recent upgrades in South Korea and Singapore deployed vertical GIS stacks in underground chambers, cutting fault-induced downtime by 38%. Equipment vendors are now offering modular kits with remote monitoring built-in, reducing inspection intervals and cutting field service needs by nearly one-third.
Despite compactness and reduced maintenance appeal, gas insulated equipment remains cost-sensitive, particularly in mid-voltage applications where alternatives are still viable. Initial capital outlay is often 35-45% higher than air-insulated equivalents, limiting adoption across smaller grids and municipal networks.
Field reports from substation builds in Latin America and Eastern Europe note that installation timelines extend by 18-22% when civil works must accommodate sealed compartments and gas handling protocols. Technicians require dedicated training for pressure testing, leak detection, and gas recovery procedures, adding to commissioning time and overhead.
In emerging markets, sourcing compatible accessories and service kits for hybrid systems is inconsistent, with average lead times exceeding 12 weeks in non-primary distribution hubs. These constraints are delaying wider deployment in budget-constrained or decentralized networks.
| Countries | CAGR |
|---|---|
| China | 10.8% |
| India | 10.0% |
| Germany | 9.2% |
| France | 8.4% |
| UK | 7.6% |
| USA | 6.8% |
| Brazil | 6.0% |
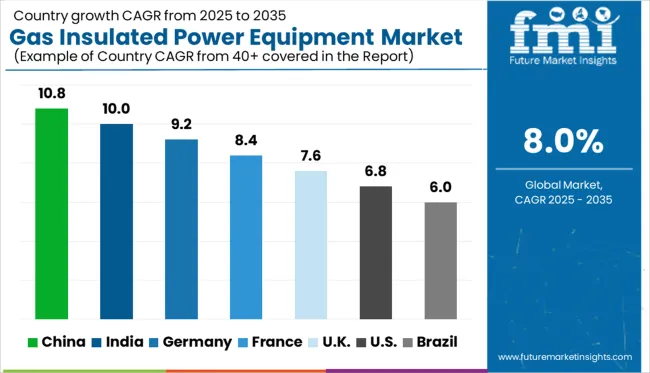
The global market is projected to grow at a CAGR of 8.0% from 2025 to 2035. China (BRICS) leads the expansion with a CAGR of 10.8%, outperforming the global average by 2.8 percentage points, reflecting large-scale infrastructure development and grid modernization. India (BRICS) follows closely at 10.0% (+2.0 pp), driven by rapid urbanization and a focus on efficient transmission systems.
Germany (OECD) posts 9.2% (+1.2 pp), supported by renewable integration and smart grid investments. France (OECD) records 8.4% (+0.4 pp), slightly above the global average. In contrast, the UK (OECD) lags behind with 7.6% (-0.4 pp), indicating a more conservative approach to deployment, possibly influenced by regulatory or budgetary constraints.
These regional differences highlight BRICS nations’ stronger growth momentum, fueled by infrastructure expansion, while OECD markets maintain moderate growth aligned with policy-driven upgrades. The report features insights from 40+ countries, with the top five shown below:
Growth for gas insulated power equipment across China is anticipated to continue strongly, with a projected CAGR of 10.8% from 2025 to 2035. The market expanded at an average rate of 8.9% annually from 2020 to 2024, backed by aggressive grid automation programs and regional high-voltage corridor expansion. Substation modernization in provincial clusters accelerated demand for 220kV and 400kV GIS assemblies, while domestic output of SF6-free gas mixtures grew across manufacturing hubs.
India market for gas insulated power equipment is projected to grow at a CAGR of 10.0% during 2025-2035, supported by public electrification schemes and increased demand for compact substation layouts in metro regions. From 2020 to 2024, average growth stood at 7.8%, driven by deployment of 132kV and 245kV GIS units across dense population zones. Policy-based manufacturing incentives encouraged local production of standardized insulated switchgear systems.
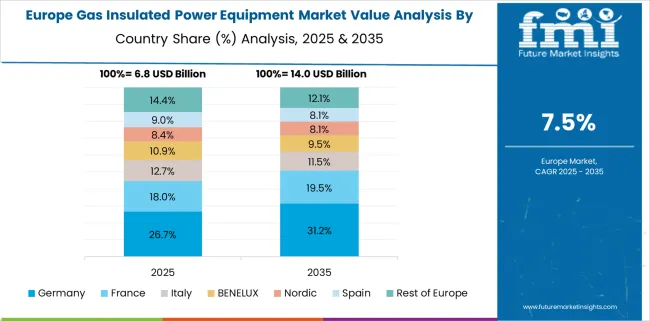
Germany gas insulated power equipment market is expected to grow at a CAGR of 9.2% from 2025 to 2035, reflecting increased installation of compact medium-voltage substations in dense commercial and renewable-heavy zones. Growth from 2020 to 2024 averaged 6.9%, largely attributed to hybrid GIS adoption in offshore wind farms and commercial real estate electrification. Domestic operators are replacing legacy SF6 units with low-GWP configurations to align with policy transitions.
United Kingdom gas insulated power equipment market is estimated to grow at a CAGR of 7.6% during 2025-2035. Between 2020 and 2024, the market expanded at 5.9% annually, driven by infrastructure constraints in transmission upgrades, especially across older grids. Adoption of GIS panels was observed in data center power nodes and key electrification programs within the national rail network.
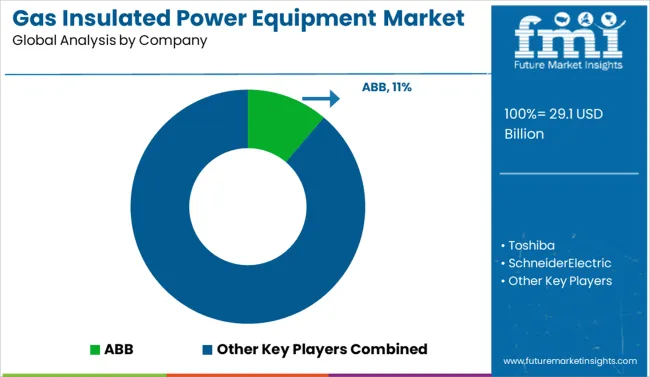
The GIS market in 2025 is dominated by established players delivering advanced high-voltage solutions for complex substations and grid modernization projects. ABB holds 11.2% share, leveraging its global manufacturing footprint and innovation in digitalized GIS platforms. Siemens AG, General Electric, Toshiba, and Mitsubishi Electric maintain leadership through large-scale installations in transmission and offshore wind integration projects. Schneider Electric and Hitachi Energy focus on compact GIS systems designed for urban substations and space-limited environments. Hyundai Electric & Energy Systems and Fuji Electric are expanding their East Asian presence by offering turnkey GIS projects and next-generation dielectric insulation technologies to ensure superior safety and reliability.
Indian companies like BHEL, Crompton Greaves, and Larsen & Toubro support grid strengthening initiatives aligned with renewable integration and smart transmission frameworks. Global firms such as Hyosung, Iljin Electric, and Xi’an XD Switchgear are targeting emerging economies with exports and regional assembly plants. High entry barriers persist, driven by capital-heavy manufacturing, rigorous IEC and ANSI certification processes, and extended qualification cycles for utility tenders.
Key Developments in the Gas Insulated Power Equipment Market
Key players in the gas insulated power equipment market are focusing on developing compact and modular designs to support urban grid expansion and space-constrained projects. Companies are investing heavily in eco-efficient technologies, particularly alternatives to SF₆, to meet tightening environmental regulations. Strategic partnerships with utilities and governments are being pursued to secure large-scale infrastructure projects, while R&D efforts emphasize digital monitoring and predictive diagnostics for improved reliability and reduced lifecycle costs.
| Item | Value |
|---|---|
| Quantitative Units | USD 29.1 Billion |
| Product Type | Gas Insulated Switchgear (GIS), Gas Insulated Transmission Lines (GIL), Gas Insulated Substations (GIS Substation), Circuit Breakers, Disconnectors, and Others (Current Transformers, Voltage Transformers, etc.) |
| End Use | Power Utilities, Industrial (Oil & Gas, Mining, etc.), Commercial & Institutional, Transportation (Railways, Airports, etc.), and Renewable Energy Plants |
| Regions Covered | North America, Europe, Asia-Pacific, Latin America, Middle East & Africa |
| Country Covered | United States, Canada, Germany, France, United Kingdom, China, Japan, India, Brazil, South Africa |
| Key Companies Profiled | ABB, Toshiba, SchneiderElectric, SiemensAG, GeneralElectric, MitsubishiElectric, BHEL, CromptonGreaves, LarsenandToubro, Ormazabal, HyundaiElectric&EnergySystem, Hitachi, FujiElectric, IljinElectric, ChintGroup, Hyosung, Xi'anXDSwitchgearElectric, AZZ, and MeidenshaCorporation |
| Additional Attributes | Dollar sales by equipment type and voltage rating, rising deployment in urban substations and renewable energy integration, stable demand across transmission and distribution infrastructure, SF₆-free and eco-efficient technologies drive innovation amid tightening environmental regulations |
The global gas insulated power equipment market is estimated to be valued at USD 29.1 billion in 2025.
The market size for the gas insulated power equipment market is projected to reach USD 62.9 billion by 2035.
The gas insulated power equipment market is expected to grow at a 8.0% CAGR between 2025 and 2035.
The key product types in gas insulated power equipment market are gas insulated switchgear (gis), gas insulated transmission lines (gil), gas insulated substations (gis substation), circuit breakers, disconnectors and others (current transformers, voltage transformers, etc.).
In terms of end use, power utilities segment to command 38.4% share in the gas insulated power equipment market in 2025.


Full Research Suite comprises of:
Market outlook & trends analysis
Interviews & case studies
Strategic recommendations
Vendor profiles & capabilities analysis
5-year forecasts
8 regions and 60+ country-level data splits
Market segment data splits
12 months of continuous data updates
DELIVERED AS:
PDF EXCEL ONLINE
Gas & Dual-Fuel Injection Systems Market Size and Share Forecast Outlook 2025 to 2035
Gas Desiccant Dehydration Unit Market Size and Share Forecast Outlook 2025 to 2035
Gas Cylinder Market Size and Share Forecast Outlook 2025 to 2035
Gasket and Seal Market Size and Share Forecast Outlook 2025 to 2035
Gas Separation Membrane Market Size and Share Forecast Outlook 2025 to 2035
Gas Jet Compressor Market Size and Share Forecast Outlook 2025 to 2035
Gas Fired Water-Tube Food Processing Boiler Market Size and Share Forecast Outlook 2025 to 2035
Gas Fired Real Estate Generator Market Size and Share Forecast Outlook 2025 to 2035
Gastric-soluble Hollow Capsules Market Size and Share Forecast Outlook 2025 to 2035
Gas Cooling System Market Analysis - Size, Share, and Forecast Outlook 2025 to 2035
Gasoline Gensets Market Size and Share Forecast Outlook 2025 to 2035
Gas Turbine Oil Market Size and Share Forecast Outlook 2025 to 2035
Gas Telecom Generator Market Size and Share Forecast Outlook 2025 to 2035
Gas Fired Condensing Low Temperature Commercial Boiler Market Size and Share Forecast Outlook 2025 to 2035
Gas Commercial Deep Fryers Market Size and Share Forecast Outlook 2025 to 2035
Gastroesophageal Reflux Disease (GERD) Device Market Analysis - Size, Share, and Forecast Outlook 2025 to 2035
Gaskets Market Size and Share Forecast Outlook 2025 to 2035
Gas Chromatography Systems Market Size and Share Forecast Outlook 2025 to 2035
Gas Fired Water Tube Chemical Boiler Market Size and Share Forecast Outlook 2025 to 2035
Gas Fired Boiler Market Size and Share Forecast Outlook 2025 to 2035

Thank you!
You will receive an email from our Business Development Manager. Please be sure to check your SPAM/JUNK folder too.
Chat With
MaRIA