Gas Cooling System Market Forecast and Outlook 2025-2035

The gas cooling system market is projected to grow from USD 4,789.1 million in 2025 to approximately USD 7,021.1 million by 2035, recording an absolute increase of USD 2,232.0 million over the forecast period. This translates into a total growth of 46.6%, with the market forecast to expand at a compound annual growth rate (CAGR) of 3.9% between 2025 and 2035. The overall market size is expected to grow by nearly 1.47X during the same period, supported by the rising adoption of advanced cooling technologies and increasing demand for energy-efficient heat exchange solutions following industrial expansion and infrastructure development.
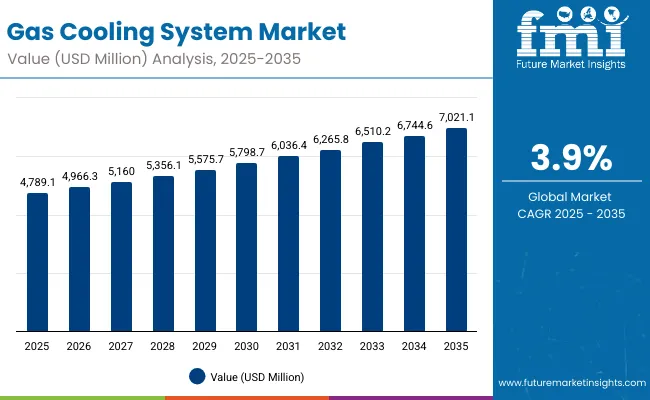
Quick Stats for Gas Cooling System Market

  • Gas Cooling System Market Value (2025): USD 4,789.1 million
  • Gas Cooling System Market Forecast Value (2035): USD 7,021.1 million
  • Gas Cooling System Market Forecast CAGR: 3.9%
  • Leading Product Type in Gas Cooling System Market: Air-cooled Heat Exchanger (45.0%)
  • Key Growth Regions in Gas Cooling System Market: North America, Europe, East Asia, and South Asia & Pacific
  • Top Key Players in Gas Cooling System Market: Howden, Kelvion, SPX Cooling (Marley), Danfoss, Alfa Laval

Gas Cooling System Market

Metric Value
Industry Size (2025E) USD 4,789.1 million
Industry Value (2035F) USD 7,021.1 million
CAGR (2025 to 2035) 3.9%

Between 2025 and 2030, the Gas Cooling System market is projected to expand from USD 4,789.1 million to USD 5,794.3 million, resulting in a value increase of USD 1,005.2 million, which represents 45.0% of the total forecast growth for the decade. This phase of growth will be shaped by rising penetration of advanced cooling technologies in industrial facilities, increasing manufacturing activities requiring efficient heat management, and growing awareness among operators about the importance of energy-efficient cooling solutions. Service providers are expanding their capabilities to address the growing complexity of modern industrial thermal management systems.

From 2030 to 2035, the market is forecast to grow from USD 5,794.3 million to USD 7,021.1 million, adding another USD 1,226.8 million, which constitutes 55.0% of the overall ten-year expansion. This period is expected to be characterized by expansion of greenfield industrial installations, integration of smart cooling technologies, and development of standardized cooling protocols across different industrial sectors. The growing adoption of high-capacity cooling systems will drive demand for more sophisticated cooling solutions and specialized technical expertise.

Between 2020 and 2025, the Gas Cooling System market experienced steady expansion, driven by increasing industrialization in emerging economies and growing awareness of cooling requirements in oil and gas processing facilities. The market developed as industrial facilities recognized the need for specialized equipment and training to properly manage high-temperature processes. Energy companies and manufacturing facilities began emphasizing proper cooling procedures to maintain operational efficiency and equipment longevity.

Why the Gas Cooling System Market is Growing?

Market expansion is being supported by the rapid increase in industrial processing activities worldwide and the corresponding need for specialized cooling solutions in high-temperature environments. Modern industrial facilities rely on precise temperature control and heat management to ensure proper functioning of manufacturing processes including petrochemical refining, power generation, and chemical processing. Even minor temperature fluctuations can require comprehensive cooling systems to maintain optimal process performance and equipment safety.

The growing complexity of industrial cooling requirements and increasing liability concerns are driving demand for professional cooling solutions from certified providers with appropriate equipment and expertise. Environmental agencies are increasingly requiring proper thermal management documentation following industrial installations to maintain compliance and ensure operational safety. Regulatory requirements and industrial specifications are establishing standardized cooling procedures that require specialized tools and trained technicians.

Segmental Analysis

The market is segmented by product type, industry, capacity, installation, and region. By product type, the market is divided into air-cooled heat exchanger, dry coolers, evaporative/gas coolers, and others. Based on industry, the market is categorized into oil and gas, petrochemicals/chemicals, power generation, and metals/mining. In terms of capacity, the market is segmented into less than 1 MW, 1-5 MW, and greater than 5 MW. By installation, the market is classified into greenfield and retrofit/upgrade. Regionally, the market is divided into North America, Europe, East Asia, South Asia & Pacific, Latin America, and Middle East & Africa.
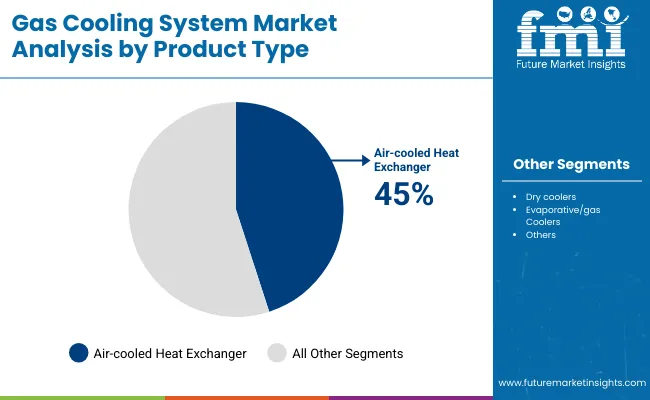
By Product Type - Air-cooled Heat Exchangers Lead with 45% Market Share

Gas Cooling System Market By Product

Air-cooled heat exchangers are expected to command a 45% share of the global gas cooling system market in 2025, making them the leading product type. Their dominance stems from their widespread adoption in industrial process applications where direct air circulation provides reliable and cost-efficient cooling. Unlike water-cooled systems, which face challenges in water-scarce regions or facilities with high environmental compliance needs, air-cooled heat exchangers use ambient air as the cooling medium eliminating dependency on water supply and reducing operating risks.

This approach has become the standard choice across oil and gas facilities, petrochemical plants, and power generation units, where large-scale process streams demand consistent thermal management. The technology benefits from decades of proven operating procedures, a deep supplier ecosystem, and a well-established aftermarket network for parts and services. As industries continue to prioritize energy efficiency and reduced environmental footprint, the use of air-cooled exchangers is expected to expand further, reinforcing the segment’s stronghold in the market.
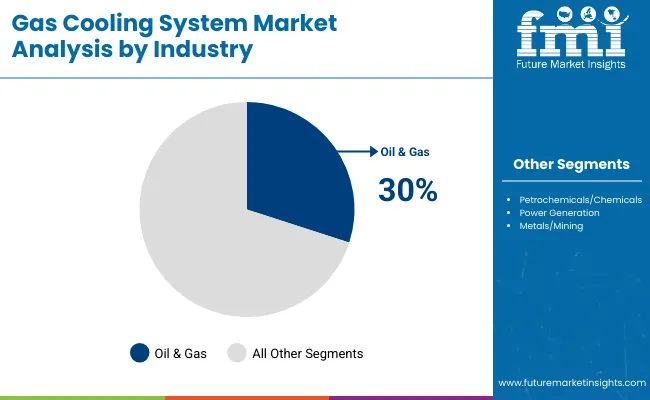
By Industry - Oil & Gas Holds 30% Market Share

Gas Cooling System Market By Industry

The oil and gas industry is projected to account for 30% of gas cooling system demand in 2025, underscoring its position as the single largest application segment. Thermal management is a critical requirement across upstream production fields, midstream transportation networks, and downstream refining operations, making cooling systems indispensable to nearly every stage of the value chain.

In many facilities, multiple gas cooling systems are integrated to manage fluctuations in gas composition, pressure, and throughput. After any maintenance, process modification, or infrastructure upgrade, coordinated cooling is required to restore operational stability and safety compliance. The sector’s reliance on cooling solutions is further reinforced by stricter environmental regulations mandating efficient gas handling and thermal control to limit emissions. With oil and gas operators continuing to modernize infrastructure, upgrade LNG terminals, and integrate higher-capacity pipelines, demand for advanced gas cooling systems is expected to remain steady and resilient.
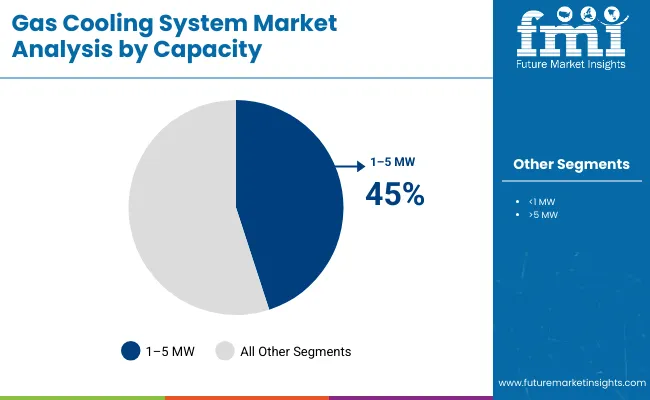
By Capacity - 1-5 MW Systems Command 45% Market Share

Gas Cooling System Market By Capacity

Medium-capacity systems in the 1-5 MW range are projected to hold 45% of the market in 2025. These installations strike an ideal balance between energy efficiency, footprint, and thermal load management, making them highly suitable for petrochemical complexes, independent power producers, and large-scale manufacturing plants. They are engineered to meet the requirements of both continuous and intermittent industrial operations, ensuring flexibility across use cases.

The segment’s growth is supported by the increasing push for standardized, modular cooling units that allow quick deployment, easy scalability, and lower maintenance costs. In industries where process uptime and reliability are non-negotiable, medium-scale cooling installations provide an optimal blend of capacity and cost-efficiency. Their adaptability across different industrial sectors gives this category a structural edge over both small-capacity niche systems and very large-scale specialized installations.
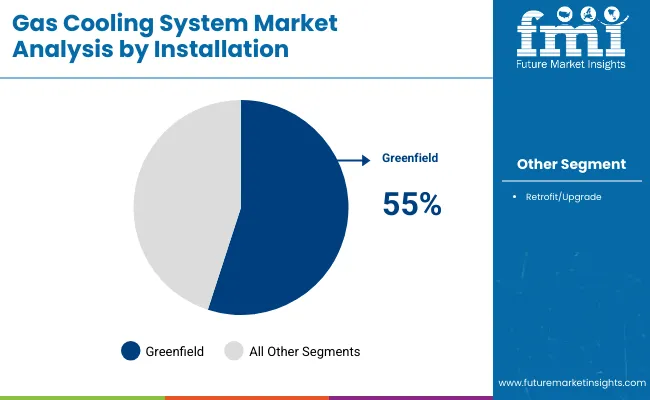
By Installation - Greenfield Projects Dominate with 55% Market Share

Gas Cooling System Market By Installation

Greenfield installations are forecast to account for 55% of the gas cooling system market in 2025, driven by the steady pipeline of new industrial projects and expansions worldwide. In such projects, operators prefer to integrate cooling solutions at the design stage, enabling system optimization for performance, energy efficiency, and long-term scalability. Unlike retrofit or brownfield installations, greenfield projects allow for seamless integration with plant layout, process flow, and automation frameworks, reducing complexity and operational risks.

This preference is particularly evident in regions investing heavily in new energy infrastructure, LNG terminals, and petrochemical clusters, where operators prioritize tailor-made, end-to-end cooling solutions. For equipment providers, greenfield projects offer opportunities for higher-value contracts, as they encompass not just equipment delivery but also engineering, system design, and lifecycle services. Consequently, the dominance of greenfield installations reflects both the project-driven expansion of heavy industries and the inherent benefits of building optimized cooling infrastructure from the ground up.

What are the Drivers, Restraints, and Key Trends of the Gas Cooling System Market?

The global gas cooling system market is advancing steadily, underpinned by robust industrial expansion, rising energy demand, and the growing recognition of thermal management as a mission-critical function across sectors. As manufacturing, petrochemicals, and power generation facilities operate at higher capacity levels, the importance of efficient and reliable gas cooling has become non-negotiable. Operators are increasingly viewing cooling systems not as auxiliary equipment, but as core infrastructure that directly influences operational safety, process continuity, and energy efficiency.

At the same time, the market faces a set of structural challenges that restrain growth. High equipment costs remain a significant barrier, particularly for small and mid-scale operators who find it difficult to invest in advanced cooling technologies with long payback periods. Continuous training and upskilling are another bottleneck, as technicians must keep pace with emerging cooling technologies, automation platforms, and environmental compliance requirements. Adding to this complexity is the lack of universal standards: cooling requirements vary widely across industrial applications, forcing providers to customize solutions and limiting economies of scale. Ongoing efforts around certification programs and standardization are shaping market development, but the pace remains uneven across geographies.

Key Trends

Expansion of Smart Cooling Technology Integration

One of the most transformative shifts in the market is the rapid adoption of smart cooling technologies. Modern industrial facilities, power generation plants, and petrochemical centers are deploying automated systems equipped with advanced sensors, AI-driven algorithms, and adaptive control platforms. These solutions enable real-time temperature monitoring, automated adjustment of cooling loads, and predictive maintenance, thereby improving precision while cutting energy consumption. For operators, this translates into higher reliability, reduced downtime, and lower total cost of ownership.

Smart cooling is particularly valuable in large-scale operations and high-temperature environments where even minor inefficiencies can escalate into costly disruptions. By enabling seamless integration with plant automation and energy management systems, smart cooling platforms are redefining thermal management as a digital, data-driven discipline rather than a purely mechanical process.

Integration of Advanced Heat Recovery and Energy Efficiency Technologies

Another defining trend is the integration of advanced heat recovery and energy efficiency solutions into modern gas cooling systems. Equipment providers are increasingly embedding automated energy management modules, regenerative cooling mechanisms, and IoT-based monitoring tools. These technologies not only improve cooling precision but also recycle waste heat, optimize energy utilization, and provide comprehensive documentation for compliance with energy efficiency standards.

This approach aligns closely with global sustainability goals and decarbonization mandates. Industrial operators are under mounting pressure to reduce energy intensity and carbon emissions, and advanced cooling systems provide a practical pathway by lowering operating costs while enhancing environmental performance. The capability to support next-generation applications ranging from renewable energy installations to advanced manufacturing processes positions these systems as enablers of industrial transition rather than just maintenance equipment.
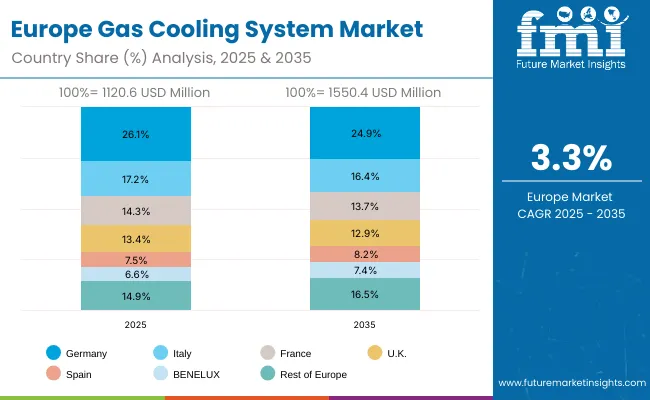
Europe Market Split by Country

Gas Cooling System Market Europe

The Gas Cooling System market in Europe is projected to grow from USD 1,120.6 million in 2025 to USD 1,550.4 million by 2035, registering a CAGR of 3.3% over the forecast period. Germany is expected to maintain its leadership with a 26.1% share in 2025 declining slightly to 24.9% by 2035, supported by its expansive industrial infrastructure and advanced manufacturing network.

The Rest of Europe region is projected to maintain its position, with its share remaining stable at 16.5% by 2035, attributed to steady cooling system adoption in Eastern and Nordic regions. BENELUX and Italy will see minor gains in market share, while France and the UK show marginal declines, likely due to mature cooling infrastructure and slower growth in industrial facility development.
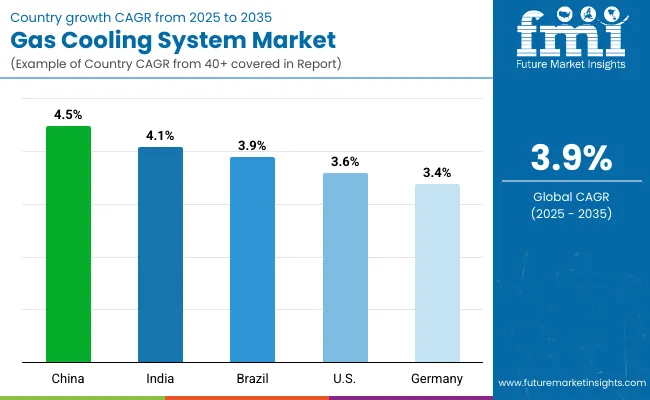
Analysis of Gas Cooling System Market by Key Country

Gas Cooling System Market By Country

The gas cooling system market is growing rapidly, with China leading at a 4.5% CAGR through 2035, driven by strong industrial expansion, government infrastructure investments, and expanding cooling networks. India follows at 4.1%, supported by rising manufacturing activity in power generation and petrochemical sectors and increasing certified service availability. Brazil grows steadily at 3.9%, integrating cooling systems into its established industrial base. Germany records 3.4%, emphasizing precision engineering, quality standards, and advanced technical expertise. The USA shows growth at 3.6%, focusing on energy efficiency, standardization, and environmental compliance. Overall, China and India emerge as the leading drivers of global gas cooling system market expansion.

The report covers an in-depth analysis of 40+ countries; five top-performing countries are highlighted below.

China Leads Global Market Growth with Industrial Development Advancement

Revenue from gas cooling systems in China is projected to exhibit the highest growth rate with a CAGR of 4.5% through 2035, driven by rapid expansion of manufacturing facilities and increasing demand for advanced thermal management solutions. The country's expanding industrial sector and growing petrochemical industry are creating significant demand for cooling systems. Major industrial manufacturers and equipment providers are establishing comprehensive cooling networks to support the growing population of high-temperature processes across urban and rural industrial areas.

  • Government industrial development policies are mandating proper thermal management and cooling requirements, driving demand for certified cooling system providers throughout major industrial zones.
  • Industrial modernization programs are supporting development of specialized cooling facilities and training programs that enhance system capability and technical expertise across manufacturing networks.

India Demonstrates Strong Market Potential with Growing Industrial Expansion

Revenue from gas cooling systems in India is expanding at a CAGR of 4.1%, supported by increasing industrial development in power generation and petrochemical sectors and growing awareness of cooling system requirements. The country's expanding manufacturing base and increasing power generation activities are driving demand for professional cooling solutions. Authorized service centers and specialized cooling facilities are gradually establishing capabilities to serve the growing population of industrial facilities requiring thermal management.

  • Industrial sector growth and power generation expansion are creating opportunities for specialized cooling system providers that can support diverse facility technologies and operational requirements.
  • Professional training and certification programs are developing technical expertise among service providers, enabling comprehensive cooling solutions that meet international quality and safety standards nationwide.

Brazil Maintains Steady Growth with Industrial Market Development

Revenue from gas cooling systems in Brazil is growing at a CAGR of 3.9%, driven by increasing industrial activity in oil and gas sectors and growing recognition of cooling system importance in manufacturing processes. The country's established industrial base is gradually integrating advanced cooling capabilities to serve modern facility technologies. Manufacturing centers and petrochemical facilities are investing in cooling equipment and training to address growing market demand.

  • Industrial infrastructure modernization is facilitating adoption of advanced cooling technologies that support comprehensive thermal management capabilities across major industrial and petrochemical regions.
  • Professional service development programs are enhancing technical capabilities among industrial facilities, enabling specialized cooling solutions that meet evolving industrial technology requirements and operational expectations.

Germany Focuses on Precision Cooling and Technical Excellence

Demand for gas cooling systems in Germany is projected to grow at a CAGR of 3.4%, supported by the country's emphasis on industrial technology innovation and precision engineering delivery. German industrial service providers are implementing comprehensive cooling capabilities that meet stringent quality standards and manufacturer specifications. The market is characterized by focus on technical excellence, advanced equipment integration, and compliance with comprehensive environmental safety regulations.
  • Industrial service sector investments are prioritizing advanced cooling technologies that demonstrate superior efficiency and reliability while meeting German industrial quality and environmental standards.
  • Professional certification programs are ensuring comprehensive technical expertise among service providers, enabling specialized cooling solutions that support diverse industrial technologies and manufacturer requirements.

United States Emphasizes Energy Efficiency and Standardization

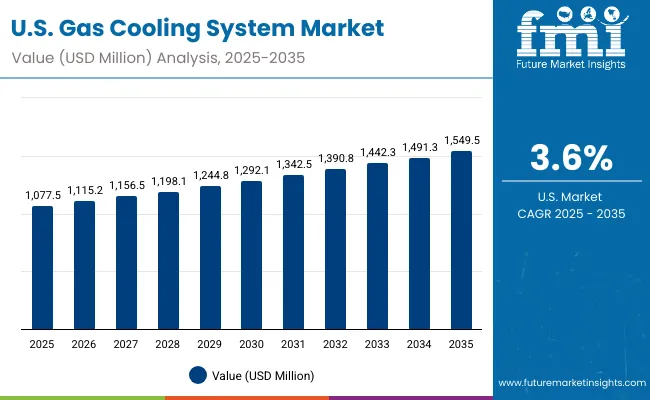
Gas Cooling System Market Usa

Demand for gas cooling systems in the USA is expanding at a CAGR of 3.6%, driven by increasing industrial activity across manufacturing sectors and growing emphasis on energy-efficient cooling procedures. Large industrial networks and specialized service providers are establishing comprehensive cooling capabilities to serve diverse operational needs. The market benefits from environmental agency requirements for proper thermal management documentation and manufacturer compliance following installations and maintenance activities.
  • Industrial sector consolidation is enabling standardized cooling service delivery across multiple locations, providing consistent service quality and comprehensive coverage throughout regional markets.
  • Professional training and certification programs are developing specialized technical expertise among service providers, enabling comprehensive cooling capabilities that support evolving industrial technology requirements.

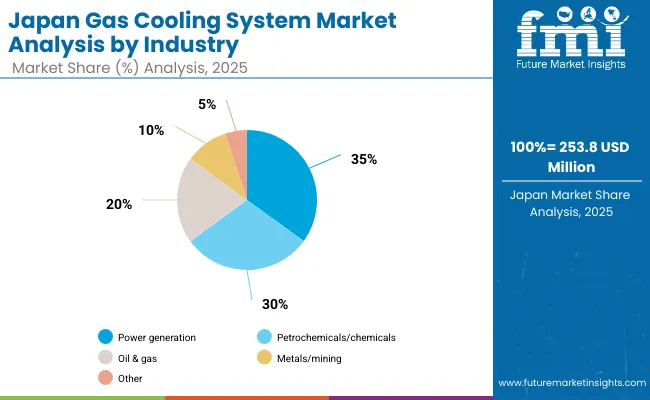
Power Generation Industry Continues to be at Forefront of Japan Gas Cooling System Market

Gas Cooling System Market Japan

In Japan, the gas cooling system market is largely driven by the power generation segment, which accounts for 35% of total service revenues in 2025. The high penetration of advanced cooling technologies in domestic industrial facilities and stringent thermal management protocols mandated for industrial operations are key contributing factors. Petrochemicals/chemicals follow with a 30% share, primarily in manufacturing facilities that integrate advanced cooling and heat recovery systems. Metals/mining and other industries contribute 35% as cooling adoption in these categories continues expanding across diverse applications.
  • Power generation facilities continue to drive industrial cooling demand across thermal and renewable energy applications
  • Increasing integration of energy recovery and efficiency features in industrial cooling installations
  • Manufacturer partnerships with industrial facilities to integrate cooling systems during facility upgrades and expansions
  • Industrial facilities adopting comprehensive cooling solutions for operational efficiency and environmental compliance

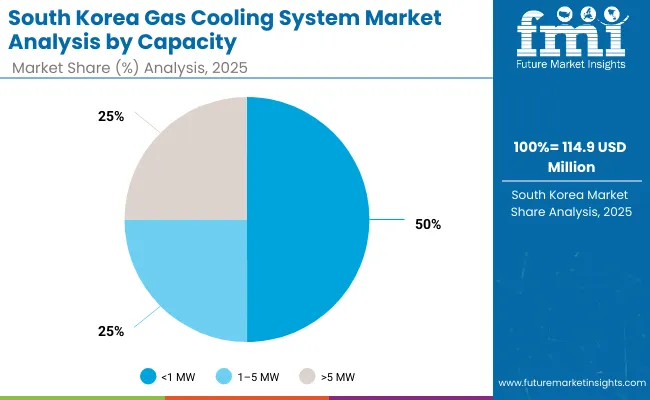
<1 MW Systems Lead Gas Cooling Applications in South Korea

Gas Cooling System Market South Korea

In South Korea, the market is expected to remain dominated by <1 MW capacity systems, which hold a 50% share in 2025. These systems are typically the optimal choice for industrial facilities requiring balanced cooling capacity and energy efficiency, where medium-scale cooling solutions provide comprehensive thermal management capabilities. Greater than 5 MW systems account for the remaining 25%, serving large-scale industrial complexes and power generation facilities requiring high-capacity cooling solutions.
  • Medium-capacity systems provide optimal balance between cooling efficiency and operational flexibility for most industrial applications
  • Industrial facilities increasingly adopt standardized cooling capacity ranges for equipment compatibility and maintenance efficiency
  • Manufacturing operations integrate modular cooling solutions that can be expanded based on production requirements
  • Power generation and industrial networks invest in standardized capacity cooling systems for comprehensive thermal management

Competitive Landscape of Gas Cooling System Market

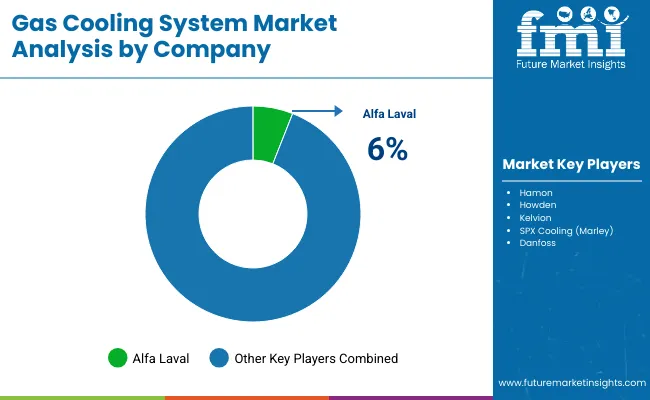
Gas Cooling System Market By Company

The gas cooling system market is defined by competition among specialized equipment manufacturers, industrial cooling system providers, and thermal management companies. Companies are investing in advanced cooling technologies, energy-efficient solutions, standardized installation procedures, and technical training to deliver precise, reliable, and cost-effective cooling solutions. Strategic partnerships, technological innovation, and geographic expansion are central to strengthening product portfolios and market presence.

The Gas Cooling System market is characterized by fragmentation, with no clear dominant player exerting control. Alfa Laval, despite being a recognized global engineering company with significant presence across process industries, accounts for just 6% of the total market share. This small but visible share underlines two realities: Alfa Laval has the credibility and reach to secure presence, but the market’s structural dynamics make it difficult for any single company to build commanding dominance. For a sector where reliability and efficiency are non-negotiable, this dispersion reflects how buyers spread risk by diversifying supplier bases and how regional competitors carve niches in geographies or applications.

Such dispersion inherently points to opportunity. With the balance of 94% share held by a long tail of competitors, the white space lies in consolidation, scaling, or specialization. A firm with the ability to integrate advanced cooling technologies while ensuring cost efficiency could reshape the market’s power structure. Bain-style analysis would call this "the consolidation play" turning a fragmented field into a platform for share capture. However, this is easier said than done. The entrenched position of companies like Hamon, Howden, Kelvion, SPX Cooling (Marley), and Danfoss ensures that competitive intensity remains high. Each brings differentiated strengths whether engineering design, regional depth, or service networks that make share gains a slow and expensive pursuit. The path forward will demand clarity of focus: either niche leadership in specialized applications or aggressive consolidation to create scale. Both routes require sharp execution and investment discipline, but without them, firms risk remaining marginal players in a crowded market.

Key Players in the Gas Cooling System Market

  • Howden
  • Kelvion
  • SPX Cooling (Marley)
  • Danfoss
  • Alfa Laval
  • Johnson Controls
  • Baltimore Aircoil Company
  • Emerson Electric Co.
  • GEA Group
  • Airedale International

Scope of the Report

Item Value
Quantitative Units USD Million
Product Type Air-cooled Heat Exchanger, dry coolers, evaporative/gas coolers, and others
Industry Oil & Gas, petrochemicals/chemicals, power generation, and metals/mining
Capacity <1 MW, 1-5 MW, and >5 MW
Installation Greenfield and retrofit/upgrade
Regions Covered North America, Europe, East Asia, South Asia & Pacific, Latin America, Middle East & Africa
Country Covered United States, Germany, India, China, United Kingdom, Japan, Brazil
Key Companies Profiled Howden, Kelvion, SPX Cooling (Marley), Danfoss, Alfa Laval
Additional Attributes Dollar sales by product type, industry, and capacity, regional demand trends across North America, Europe, and Asia-Pacific, competitive landscape with established players and emerging suppliers, buyer preferences for energy-efficient versus conventional systems, integration with smart control and digital monitoring platforms, innovations in heat recovery capabilities and closed-loop cooling systems, and adoption of environmental compliance solutions with advanced efficiency features for enhanced operational performance.

Gas Cooling System Market by Segments

By Product Type:

  • Air-cooled Heat Exchanger
  • Dry Coolers
  • Evaporative/Gas Coolers
  • Others

By Industry:

  • Oil & Gas
  • Petrochemicals/Chemicals
  • Power Generation
  • Metals/Mining

By Capacity:

  • Less than 1 MW
  • 1-5 MW
  • Greater than 5 MW

By Installation:

  • Greenfield
  • Retrofit/Upgrade

By Region:

  • North America
  • Latin America
  • Western Europe
  • Eastern Europe
  • South Asia & Pacific
  • East Asia
  • Middle East & Africa (MEA)

Table of Content

  1. Executive Summary
    • Global Market Outlook
    • Demand-side Trends
    • Supply-side Trends
    • Technology Roadmap Analysis
    • Analysis and Recommendations
  2. Market Overview
    • Market Coverage / Taxonomy
    • Market Definition / Scope / Limitations
  3. Market Background
    • Market Dynamics
      • Drivers
      • Restraints
      • Opportunity
      • Trends
    • Scenario Forecast
      • Demand in Optimistic Scenario
      • Demand in Likely Scenario
      • Demand in Conservative Scenario
    • Opportunity Map Analysis
    • Product Life Cycle Analysis
    • Supply Chain Analysis
      • Supply Side Participants and their Roles
        • Producers
        • Mid-Level Participants (Traders/ Agents/ Brokers)
        • Wholesalers and Distributors
      • Value Added and Value Created at Node in the Supply Chain
      • List of Raw Material Suppliers
      • List of Existing and Potential Buyer's
    • Investment Feasibility Matrix
    • Value Chain Analysis
      • Profit Margin Analysis
      • Wholesalers and Distributors
      • Retailers
    • PESTLE and Porter's Analysis
    • Regulatory Landscape
      • By Key Regions
      • By Key Countries
    • Regional Parent Market Outlook
    • Production and Consumption Statistics
    • Import and Export Statistics
  4. Global Market Analysis 2020 to 2024 and Forecast, 2025 to 2035
    • Historical Market Size Value (USD Billion) & Volume (Units) Analysis, 2020 to 2024
    • Current and Future Market Size Value (USD Billion) & Volume (Units) Projections, 2025 to 2035
      • Y-o-Y Growth Trend Analysis
      • Absolute $ Opportunity Analysis
  5. Global Market Pricing Analysis 2020 to 2024 and Forecast 2025 to 2035
  6. Global Market Analysis 2020 to 2024 and Forecast 2025 to 2035, By Product Type
    • Introduction / Key Findings
    • Historical Market Size Value (USD Billion) & Volume (Units) Analysis By Product Type, 2020 to 2024
    • Current and Future Market Size Value (USD Billion) & Volume (Units) Analysis and Forecast By Product Type, 2025 to 2035
      • Air-cooled Heat Exchanger
      • Dry Coolers
      • Evaporative/Gas Coolers
      • Others
    • Y-o-Y Growth Trend Analysis By Product Type, 2020 to 2024
    • Absolute $ Opportunity Analysis By Product Type, 2025 to 2035
  7. Global Market Analysis 2020 to 2024 and Forecast 2025 to 2035, By Industry
    • Introduction / Key Findings
    • Historical Market Size Value (USD Billion) & Volume (Units) Analysis By Industry, 2020 to 2024
    • Current and Future Market Size Value (USD Billion) & Volume (Units) Analysis and Forecast By Industry, 2025 to 2035
      • Oil & Gas
      • Petrochemicals/Chemicals
      • Power Generation
      • Metals/Mining
    • Y-o-Y Growth Trend Analysis By Industry, 2020 to 2024
    • Absolute $ Opportunity Analysis By Industry, 2025 to 2035
  8. Global Market Analysis 2020 to 2024 and Forecast 2025 to 2035, By Capacity
    • Introduction / Key Findings
    • Historical Market Size Value (USD Billion) & Volume (Units) Analysis By Capacity, 2020 to 2024
    • Current and Future Market Size Value (USD Billion) & Volume (Units) Analysis and Forecast By Capacity, 2025 to 2035
      • Less than 1 MW
      • 1-5 MW
      • Greater than 5 MW
    • Y-o-Y Growth Trend Analysis By Capacity, 2020 to 2024
    • Absolute $ Opportunity Analysis By Capacity, 2025 to 2035
  9. Global Market Analysis 2020 to 2024 and Forecast 2025 to 2035, By Installation
    • Introduction / Key Findings
    • Historical Market Size Value (USD Billion) & Volume (Units) Analysis By Installation, 2020 to 2024
    • Current and Future Market Size Value (USD Billion) & Volume (Units) Analysis and Forecast By Installation, 2025 to 2035
      • Greenfield
      • Retrofit/Upgrade
    • Y-o-Y Growth Trend Analysis By Installation, 2020 to 2024
    • Absolute $ Opportunity Analysis By Installation, 2025 to 2035
  10. Global Market Analysis 2020 to 2024 and Forecast 2025 to 2035, By Region
    • Introduction
    • Historical Market Size Value (USD Billion) & Volume (Units) Analysis By Region, 2020 to 2024
    • Current Market Size Value (USD Billion) & Volume (Units) Analysis and Forecast By Region, 2025 to 2035
      • North America
      • Latin America
      • East Asia
      • South Asia & Pacific
      • Western Europe
      • Eastern Europe
      • Middle East & Africa
    • Market Attractiveness Analysis By Region
  11. North America Market Analysis 2020 to 2024 and Forecast 2025 to 2035, By Country
    • Historical Market Size Value (USD Billion) & Volume (Units) Trend Analysis By Market Taxonomy, 2020 to 2024
    • Market Size Value (USD Billion) & Volume (Units) Forecast By Market Taxonomy, 2025 to 2035
      • By Country
        • USA
        • Canada
        • Mexico
      • By Product Type
      • By Industry
      • By Capacity
      • By Installation
    • Market Attractiveness Analysis
      • By Country
      • By Product Type
      • By Industry
      • By Capacity
      • By Installation
    • Key Takeaways
  12. Latin America Market Analysis 2020 to 2024 and Forecast 2025 to 2035, By Country
    • Historical Market Size Value (USD Billion) & Volume (Units) Trend Analysis By Market Taxonomy, 2020 to 2024
    • Market Size Value (USD Billion) & Volume (Units) Forecast By Market Taxonomy, 2025 to 2035
      • By Country
        • Brazil
        • Chile
        • Rest of Latin America
      • By Product Type
      • By Industry
      • By Capacity
      • By Installation
    • Market Attractiveness Analysis
      • By Country
      • By Product Type
      • By Industry
      • By Capacity
      • By Installation
    • Key Takeaways
  13. East Asia Market Analysis 2020 to 2024 and Forecast 2025 to 2035, By Country
    • Historical Market Size Value (USD Billion) & Volume (Units) Trend Analysis By Market Taxonomy, 2020 to 2024
    • Market Size Value (USD Billion) & Volume (Units) Forecast By Market Taxonomy, 2025 to 2035
      • By Country
        • China
        • Japan
        • South Korea
      • By Product Type
      • By Industry
      • By Capacity
      • By Installation
    • Market Attractiveness Analysis
      • By Country
      • By Product Type
      • By Industry
      • By Capacity
      • By Installation
    • Key Takeaways
  14. South Asia & Pacific Market Analysis 2020 to 2024 and Forecast 2025 to 2035, By Country
    • Historical Market Size Value (USD Billion) & Volume (Units) Trend Analysis By Market Taxonomy, 2020 to 2024
    • Market Size Value (USD Billion) & Volume (Units) Forecast By Market Taxonomy, 2025 to 2035
      • By Country
        • India
        • ASEAN Countries
        • Australia & New Zealand
        • Rest of South Asia & Pacific
      • By Product Type
      • By Industry
      • By Capacity
      • By Installation
    • Market Attractiveness Analysis
      • By Country
      • By Product Type
      • By Industry
      • By Capacity
      • By Installation
    • Key Takeaways
  15. Western Europe Market Analysis 2020 to 2024 and Forecast 2025 to 2035, By Country
    • Historical Market Size Value (USD Billion) & Volume (Units) Trend Analysis By Market Taxonomy, 2020 to 2024
    • Market Size Value (USD Billion) & Volume (Units) Forecast By Market Taxonomy, 2025 to 2035
      • By Country
        • Germany
        • UK
        • France
        • Italy
        • Spain
        • BENELUX
        • Nordic Countries
        • Rest of Western Europe
      • By Product Type
      • By Industry
      • By Capacity
      • By Installation
    • Market Attractiveness Analysis
      • By Country
      • By Product Type
      • By Industry
      • By Capacity
      • By Installation
    • Key Takeaways
  16. Eastern Europe Market Analysis 2020 to 2024 and Forecast 2025 to 2035, By Country
    • Historical Market Size Value (USD Billion) & Volume (Units) Trend Analysis By Market Taxonomy, 2020 to 2024
    • Market Size Value (USD Billion) & Volume (Units) Forecast By Market Taxonomy, 2025 to 2035
      • By Country
        • Russia
        • Hungary
        • Poland
        • Rest of Eastern Europe
      • By Product Type
      • By Industry
      • By Capacity
      • By Installation
    • Market Attractiveness Analysis
      • By Country
      • By Product Type
      • By Industry
      • By Capacity
      • By Installation
    • Key Takeaways
  17. Middle East & Africa Market Analysis 2020 to 2024 and Forecast 2025 to 2035, By Country
    • Historical Market Size Value (USD Billion) & Volume (Units) Trend Analysis By Market Taxonomy, 2020 to 2024
    • Market Size Value (USD Billion) & Volume (Units) Forecast By Market Taxonomy, 2025 to 2035
      • By Country
        • Saudi Arabia
        • Türkiye
        • South Africa
        • Other African Union
        • Rest of Middle East & Africa
      • By Product Type
      • By Industry
      • By Capacity
      • By Installation
    • Market Attractiveness Analysis
      • By Country
      • By Product Type
      • By Industry
      • By Capacity
      • By Installation
    • Key Takeaways
  18. Key Countries Market Analysis
    • USA
      • Pricing Analysis
      • Market Share Analysis, 2024
        • By Product Type
        • By Industry
        • By Capacity
        • By Installation
    • Brazil
      • Pricing Analysis
      • Market Share Analysis, 2024
        • By Product Type
        • By Industry
        • By Capacity
        • By Installation
    • China
      • Pricing Analysis
      • Market Share Analysis, 2024
        • By Product Type
        • By Industry
        • By Capacity
        • By Installation
    • India
      • Pricing Analysis
      • Market Share Analysis, 2024
        • By Product Type
        • By Industry
        • By Capacity
        • By Installation
    • Germany
      • Pricing Analysis
      • Market Share Analysis, 2024
        • By Product Type
        • By Industry
        • By Capacity
        • By Installation
    • France
      • Pricing Analysis
      • Market Share Analysis, 2024
        • By Product Type
        • By Industry
        • By Capacity
        • By Installation
    • UK
      • Pricing Analysis
      • Market Share Analysis, 2024
        • By Product Type
        • By Industry
        • By Capacity
        • By Installation
    • Japan
      • Pricing Analysis
      • Market Share Analysis, 2024
        • By Product Type
        • By Industry
        • By Capacity
        • By Installation
    • South Korea
      • Pricing Analysis
      • Market Share Analysis, 2024
        • By Product Type
        • By Industry
        • By Capacity
        • By Installation
  19. Market Structure Analysis
    • Competition Dashboard
    • Competition Benchmarking
    • Market Share Analysis of Top Players
      • By Regional
      • By Product Type
      • By Industry
      • By Capacity
      • By Installation
  20. Competition Analysis
    • Competition Deep Dive
      • Howden
        • Overview
        • Product Portfolio
        • Profitability by Market Segments (Product/Age/Sales Channel/Region)
        • Sales Footprint
        • Strategy Overview
          • Marketing Strategy
          • Product Strategy
          • Channel Strategy
      • Kelvion
        • Overview
        • Product Portfolio
        • Profitability by Market Segments (Product/Age/Sales Channel/Region)
        • Sales Footprint
        • Strategy Overview
          • Marketing Strategy
          • Product Strategy
          • Channel Strategy
      • SPX Cooling (Marley)
        • Overview
        • Product Portfolio
        • Profitability by Market Segments (Product/Age/Sales Channel/Region)
        • Sales Footprint
        • Strategy Overview
          • Marketing Strategy
          • Product Strategy
          • Channel Strategy
      • Danfoss
        • Overview
        • Product Portfolio
        • Profitability by Market Segments (Product/Age/Sales Channel/Region)
        • Sales Footprint
        • Strategy Overview
          • Marketing Strategy
          • Product Strategy
          • Channel Strategy
      • Alfa Laval
        • Overview
        • Product Portfolio
        • Profitability by Market Segments (Product/Age/Sales Channel/Region)
        • Sales Footprint
        • Strategy Overview
          • Marketing Strategy
          • Product Strategy
          • Channel Strategy
      • Johnson Controls
        • Overview
        • Product Portfolio
        • Profitability by Market Segments (Product/Age/Sales Channel/Region)
        • Sales Footprint
        • Strategy Overview
          • Marketing Strategy
          • Product Strategy
          • Channel Strategy
      • Baltimore Aircoil Company
        • Overview
        • Product Portfolio
        • Profitability by Market Segments (Product/Age/Sales Channel/Region)
        • Sales Footprint
        • Strategy Overview
          • Marketing Strategy
          • Product Strategy
          • Channel Strategy
      • Emerson Electric Co.
        • Overview
        • Product Portfolio
        • Profitability by Market Segments (Product/Age/Sales Channel/Region)
        • Sales Footprint
        • Strategy Overview
          • Marketing Strategy
          • Product Strategy
          • Channel Strategy
      • GEA Group
        • Overview
        • Product Portfolio
        • Profitability by Market Segments (Product/Age/Sales Channel/Region)
        • Sales Footprint
        • Strategy Overview
          • Marketing Strategy
          • Product Strategy
          • Channel Strategy
      • Airedale International
        • Overview
        • Product Portfolio
        • Profitability by Market Segments (Product/Age/Sales Channel/Region)
        • Sales Footprint
        • Strategy Overview
          • Marketing Strategy
          • Product Strategy
          • Channel Strategy
  21. Assumptions & Acronyms Used
  22. Research Methodology

List of Tables

  • Table 1: Global Market Value (USD Billion) Forecast by Region, 2020-2035
  • Table 2: Global Market Volume (Units) Forecast by Region, 2020-2035
  • Table 3: Global Market Value (USD Billion) Forecast by Product Type, 2020-2035
  • Table 4: Global Market Volume (Units) Forecast by Product Type, 2020-2035
  • Table 5: Global Market Value (USD Billion) Forecast by Industry, 2020-2035
  • Table 6: Global Market Volume (Units) Forecast by Industry, 2020-2035
  • Table 7: Global Market Value (USD Billion) Forecast by Capacity, 2020-2035
  • Table 8: Global Market Volume (Units) Forecast by Capacity, 2020-2035
  • Table 9: Global Market Value (USD Billion) Forecast by Installation, 2020-2035
  • Table 10: Global Market Volume (Units) Forecast by Installation, 2020-2035
  • Table 11: North America Market Value (USD Billion) Forecast by Country, 2020-2035
  • Table 12: North America Market Volume (Units) Forecast by Country, 2020-2035
  • Table 13: North America Market Value (USD Billion) Forecast by Product Type, 2020-2035
  • Table 14: North America Market Volume (Units) Forecast by Product Type, 2020-2035
  • Table 15: North America Market Value (USD Billion) Forecast by Industry, 2020-2035
  • Table 16: North America Market Volume (Units) Forecast by Industry, 2020-2035
  • Table 17: North America Market Value (USD Billion) Forecast by Capacity, 2020-2035
  • Table 18: North America Market Volume (Units) Forecast by Capacity, 2020-2035
  • Table 19: North America Market Value (USD Billion) Forecast by Installation, 2020-2035
  • Table 20: North America Market Volume (Units) Forecast by Installation, 2020-2035
  • Table 21: Latin America Market Value (USD Billion) Forecast by Country, 2020-2035
  • Table 22: Latin America Market Volume (Units) Forecast by Country, 2020-2035
  • Table 23: Latin America Market Value (USD Billion) Forecast by Product Type, 2020-2035
  • Table 24: Latin America Market Volume (Units) Forecast by Product Type, 2020-2035
  • Table 25: Latin America Market Value (USD Billion) Forecast by Industry, 2020-2035
  • Table 26: Latin America Market Volume (Units) Forecast by Industry, 2020-2035
  • Table 27: Latin America Market Value (USD Billion) Forecast by Capacity, 2020-2035
  • Table 28: Latin America Market Volume (Units) Forecast by Capacity, 2020-2035
  • Table 29: Latin America Market Value (USD Billion) Forecast by Installation, 2020-2035
  • Table 30: Latin America Market Volume (Units) Forecast by Installation, 2020-2035
  • Table 31: East Asia Market Value (USD Billion) Forecast by Country, 2020-2035
  • Table 32: East Asia Market Volume (Units) Forecast by Country, 2020-2035
  • Table 33: East Asia Market Value (USD Billion) Forecast by Product Type, 2020-2035
  • Table 34: East Asia Market Volume (Units) Forecast by Product Type, 2020-2035
  • Table 35: East Asia Market Value (USD Billion) Forecast by Industry, 2020-2035
  • Table 36: East Asia Market Volume (Units) Forecast by Industry, 2020-2035
  • Table 37: East Asia Market Value (USD Billion) Forecast by Capacity, 2020-2035
  • Table 38: East Asia Market Volume (Units) Forecast by Capacity, 2020-2035
  • Table 39: East Asia Market Value (USD Billion) Forecast by Installation, 2020-2035
  • Table 40: East Asia Market Volume (Units) Forecast by Installation, 2020-2035
  • Table 41: South Asia & Pacific Market Value (USD Billion) Forecast by Country, 2020-2035
  • Table 42: South Asia & Pacific Market Volume (Units) Forecast by Country, 2020-2035
  • Table 43: South Asia & Pacific Market Value (USD Billion) Forecast by Product Type, 2020-2035
  • Table 44: South Asia & Pacific Market Volume (Units) Forecast by Product Type, 2020-2035
  • Table 45: South Asia & Pacific Market Value (USD Billion) Forecast by Industry, 2020-2035
  • Table 46: South Asia & Pacific Market Volume (Units) Forecast by Industry, 2020-2035
  • Table 47: South Asia & Pacific Market Value (USD Billion) Forecast by Capacity, 2020-2035
  • Table 48: South Asia & Pacific Market Volume (Units) Forecast by Capacity, 2020-2035
  • Table 49: South Asia & Pacific Market Value (USD Billion) Forecast by Installation, 2020-2035
  • Table 50: South Asia & Pacific Market Volume (Units) Forecast by Installation, 2020-2035
  • Table 51: Western Europe Market Value (USD Billion) Forecast by Country, 2020-2035
  • Table 52: Western Europe Market Volume (Units) Forecast by Country, 2020-2035
  • Table 53: Western Europe Market Value (USD Billion) Forecast by Product Type, 2020-2035
  • Table 54: Western Europe Market Volume (Units) Forecast by Product Type, 2020-2035
  • Table 55: Western Europe Market Value (USD Billion) Forecast by Industry, 2020-2035
  • Table 56: Western Europe Market Volume (Units) Forecast by Industry, 2020-2035
  • Table 57: Western Europe Market Value (USD Billion) Forecast by Capacity, 2020-2035
  • Table 58: Western Europe Market Volume (Units) Forecast by Capacity, 2020-2035
  • Table 59: Western Europe Market Value (USD Billion) Forecast by Installation, 2020-2035
  • Table 60: Western Europe Market Volume (Units) Forecast by Installation, 2020-2035
  • Table 61: Eastern Europe Market Value (USD Billion) Forecast by Country, 2020-2035
  • Table 62: Eastern Europe Market Volume (Units) Forecast by Country, 2020-2035
  • Table 63: Eastern Europe Market Value (USD Billion) Forecast by Product Type, 2020-2035
  • Table 64: Eastern Europe Market Volume (Units) Forecast by Product Type, 2020-2035
  • Table 65: Eastern Europe Market Value (USD Billion) Forecast by Industry, 2020-2035
  • Table 66: Eastern Europe Market Volume (Units) Forecast by Industry, 2020-2035
  • Table 67: Eastern Europe Market Value (USD Billion) Forecast by Capacity, 2020-2035
  • Table 68: Eastern Europe Market Volume (Units) Forecast by Capacity, 2020-2035
  • Table 69: Eastern Europe Market Value (USD Billion) Forecast by Installation, 2020-2035
  • Table 70: Eastern Europe Market Volume (Units) Forecast by Installation, 2020-2035
  • Table 71: Middle East & Africa Market Value (USD Billion) Forecast by Country, 2020-2035
  • Table 72: Middle East & Africa Market Volume (Units) Forecast by Country, 2020-2035
  • Table 73: Middle East & Africa Market Value (USD Billion) Forecast by Product Type, 2020-2035
  • Table 74: Middle East & Africa Market Volume (Units) Forecast by Product Type, 2020-2035
  • Table 75: Middle East & Africa Market Value (USD Billion) Forecast by Industry, 2020-2035
  • Table 76: Middle East & Africa Market Volume (Units) Forecast by Industry, 2020-2035
  • Table 77: Middle East & Africa Market Value (USD Billion) Forecast by Capacity, 2020-2035
  • Table 78: Middle East & Africa Market Volume (Units) Forecast by Capacity, 2020-2035
  • Table 79: Middle East & Africa Market Value (USD Billion) Forecast by Installation, 2020-2035
  • Table 80: Middle East & Africa Market Volume (Units) Forecast by Installation, 2020-2035
  • Table 81: USA Market Value (USD Billion) Forecast by Product Type, 2020-2035
  • Table 82: USA Market Volume (Units) Forecast by Product Type, 2020-2035
  • Table 83: USA Market Value (USD Billion) Forecast by Industry, 2020-2035
  • Table 84: USA Market Volume (Units) Forecast by Industry, 2020-2035
  • Table 85: USA Market Value (USD Billion) Forecast by Capacity, 2020-2035
  • Table 86: USA Market Volume (Units) Forecast by Capacity, 2020-2035
  • Table 87: USA Market Value (USD Billion) Forecast by Installation, 2020-2035
  • Table 88: USA Market Volume (Units) Forecast by Installation, 2020-2035
  • Table 89: Canada Market Value (USD Billion) Forecast by Product Type, 2020-2035
  • Table 90: Canada Market Volume (Units) Forecast by Product Type, 2020-2035
  • Table 91: Canada Market Value (USD Billion) Forecast by Industry, 2020-2035
  • Table 92: Canada Market Volume (Units) Forecast by Industry, 2020-2035
  • Table 93: Canada Market Value (USD Billion) Forecast by Capacity, 2020-2035
  • Table 94: Canada Market Volume (Units) Forecast by Capacity, 2020-2035
  • Table 95: Canada Market Value (USD Billion) Forecast by Installation, 2020-2035
  • Table 96: Canada Market Volume (Units) Forecast by Installation, 2020-2035
  • Table 97: Mexico Market Value (USD Billion) Forecast by Product Type, 2020-2035
  • Table 98: Mexico Market Volume (Units) Forecast by Product Type, 2020-2035
  • Table 99: Mexico Market Value (USD Billion) Forecast by Industry, 2020-2035
  • Table 100: Mexico Market Volume (Units) Forecast by Industry, 2020-2035
  • Table 101: Mexico Market Value (USD Billion) Forecast by Capacity, 2020-2035
  • Table 102: Mexico Market Volume (Units) Forecast by Capacity, 2020-2035
  • Table 103: Mexico Market Value (USD Billion) Forecast by Installation, 2020-2035
  • Table 104: Mexico Market Volume (Units) Forecast by Installation, 2020-2035
  • Table 105: Brazil Market Value (USD Billion) Forecast by Product Type, 2020-2035
  • Table 106: Brazil Market Volume (Units) Forecast by Product Type, 2020-2035
  • Table 107: Brazil Market Value (USD Billion) Forecast by Industry, 2020-2035
  • Table 108: Brazil Market Volume (Units) Forecast by Industry, 2020-2035
  • Table 109: Brazil Market Value (USD Billion) Forecast by Capacity, 2020-2035
  • Table 110: Brazil Market Volume (Units) Forecast by Capacity, 2020-2035
  • Table 111: Brazil Market Value (USD Billion) Forecast by Installation, 2020-2035
  • Table 112: Brazil Market Volume (Units) Forecast by Installation, 2020-2035
  • Table 113: Chile Market Value (USD Billion) Forecast by Product Type, 2020-2035
  • Table 114: Chile Market Volume (Units) Forecast by Product Type, 2020-2035
  • Table 115: Chile Market Value (USD Billion) Forecast by Industry, 2020-2035
  • Table 116: Chile Market Volume (Units) Forecast by Industry, 2020-2035
  • Table 117: Chile Market Value (USD Billion) Forecast by Capacity, 2020-2035
  • Table 118: Chile Market Volume (Units) Forecast by Capacity, 2020-2035
  • Table 119: Chile Market Value (USD Billion) Forecast by Installation, 2020-2035
  • Table 120: Chile Market Volume (Units) Forecast by Installation, 2020-2035
  • Table 121: China Market Value (USD Billion) Forecast by Product Type, 2020-2035
  • Table 122: China Market Volume (Units) Forecast by Product Type, 2020-2035
  • Table 123: China Market Value (USD Billion) Forecast by Industry, 2020-2035
  • Table 124: China Market Volume (Units) Forecast by Industry, 2020-2035
  • Table 125: China Market Value (USD Billion) Forecast by Capacity, 2020-2035
  • Table 126: China Market Volume (Units) Forecast by Capacity, 2020-2035
  • Table 127: China Market Value (USD Billion) Forecast by Installation, 2020-2035
  • Table 128: China Market Volume (Units) Forecast by Installation, 2020-2035
  • Table 129: Japan Market Value (USD Billion) Forecast by Product Type, 2020-2035
  • Table 130: Japan Market Volume (Units) Forecast by Product Type, 2020-2035
  • Table 131: Japan Market Value (USD Billion) Forecast by Industry, 2020-2035
  • Table 132: Japan Market Volume (Units) Forecast by Industry, 2020-2035
  • Table 133: Japan Market Value (USD Billion) Forecast by Capacity, 2020-2035
  • Table 134: Japan Market Volume (Units) Forecast by Capacity, 2020-2035
  • Table 135: Japan Market Value (USD Billion) Forecast by Installation, 2020-2035
  • Table 136: Japan Market Volume (Units) Forecast by Installation, 2020-2035
  • Table 137: South Korea Market Value (USD Billion) Forecast by Product Type, 2020-2035
  • Table 138: South Korea Market Volume (Units) Forecast by Product Type, 2020-2035
  • Table 139: South Korea Market Value (USD Billion) Forecast by Industry, 2020-2035
  • Table 140: South Korea Market Volume (Units) Forecast by Industry, 2020-2035
  • Table 141: South Korea Market Value (USD Billion) Forecast by Capacity, 2020-2035
  • Table 142: South Korea Market Volume (Units) Forecast by Capacity, 2020-2035
  • Table 143: South Korea Market Value (USD Billion) Forecast by Installation, 2020-2035
  • Table 144: South Korea Market Volume (Units) Forecast by Installation, 2020-2035
  • Table 145: India Market Value (USD Billion) Forecast by Product Type, 2020-2035
  • Table 146: India Market Volume (Units) Forecast by Product Type, 2020-2035
  • Table 147: India Market Value (USD Billion) Forecast by Industry, 2020-2035
  • Table 148: India Market Volume (Units) Forecast by Industry, 2020-2035
  • Table 149: India Market Value (USD Billion) Forecast by Capacity, 2020-2035
  • Table 150: India Market Volume (Units) Forecast by Capacity, 2020-2035
  • Table 151: India Market Value (USD Billion) Forecast by Installation, 2020-2035
  • Table 152: India Market Volume (Units) Forecast by Installation, 2020-2035
  • Table 153: ASEAN Countries Market Value (USD Billion) Forecast by Product Type, 2020-2035
  • Table 154: ASEAN Countries Market Volume (Units) Forecast by Product Type, 2020-2035
  • Table 155: ASEAN Countries Market Value (USD Billion) Forecast by Industry, 2020-2035
  • Table 156: ASEAN Countries Market Volume (Units) Forecast by Industry, 2020-2035
  • Table 157: ASEAN Countries Market Value (USD Billion) Forecast by Capacity, 2020-2035
  • Table 158: ASEAN Countries Market Volume (Units) Forecast by Capacity, 2020-2035
  • Table 159: ASEAN Countries Market Value (USD Billion) Forecast by Installation, 2020-2035
  • Table 160: ASEAN Countries Market Volume (Units) Forecast by Installation, 2020-2035
  • Table 161: Australia & New Zealand Market Value (USD Billion) Forecast by Product Type, 2020-2035
  • Table 162: Australia & New Zealand Market Volume (Units) Forecast by Product Type, 2020-2035
  • Table 163: Australia & New Zealand Market Value (USD Billion) Forecast by Industry, 2020-2035
  • Table 164: Australia & New Zealand Market Volume (Units) Forecast by Industry, 2020-2035
  • Table 165: Australia & New Zealand Market Value (USD Billion) Forecast by Capacity, 2020-2035
  • Table 166: Australia & New Zealand Market Volume (Units) Forecast by Capacity, 2020-2035
  • Table 167: Australia & New Zealand Market Value (USD Billion) Forecast by Installation, 2020-2035
  • Table 168: Australia & New Zealand Market Volume (Units) Forecast by Installation, 2020-2035
  • Table 169: Germany Market Value (USD Billion) Forecast by Product Type, 2020-2035
  • Table 170: Germany Market Volume (Units) Forecast by Product Type, 2020-2035
  • Table 171: Germany Market Value (USD Billion) Forecast by Industry, 2020-2035
  • Table 172: Germany Market Volume (Units) Forecast by Industry, 2020-2035
  • Table 173: Germany Market Value (USD Billion) Forecast by Capacity, 2020-2035
  • Table 174: Germany Market Volume (Units) Forecast by Capacity, 2020-2035
  • Table 175: Germany Market Value (USD Billion) Forecast by Installation, 2020-2035
  • Table 176: Germany Market Volume (Units) Forecast by Installation, 2020-2035
  • Table 177: UK Market Value (USD Billion) Forecast by Product Type, 2020-2035
  • Table 178: UK Market Volume (Units) Forecast by Product Type, 2020-2035
  • Table 179: UK Market Value (USD Billion) Forecast by Industry, 2020-2035
  • Table 180: UK Market Volume (Units) Forecast by Industry, 2020-2035
  • Table 181: UK Market Value (USD Billion) Forecast by Capacity, 2020-2035
  • Table 182: UK Market Volume (Units) Forecast by Capacity, 2020-2035
  • Table 183: UK Market Value (USD Billion) Forecast by Installation, 2020-2035
  • Table 184: UK Market Volume (Units) Forecast by Installation, 2020-2035
  • Table 185: France Market Value (USD Billion) Forecast by Product Type, 2020-2035
  • Table 186: France Market Volume (Units) Forecast by Product Type, 2020-2035
  • Table 187: France Market Value (USD Billion) Forecast by Industry, 2020-2035
  • Table 188: France Market Volume (Units) Forecast by Industry, 2020-2035
  • Table 189: France Market Value (USD Billion) Forecast by Capacity, 2020-2035
  • Table 190: France Market Volume (Units) Forecast by Capacity, 2020-2035
  • Table 191: France Market Value (USD Billion) Forecast by Installation, 2020-2035
  • Table 192: France Market Volume (Units) Forecast by Installation, 2020-2035
  • Table 193: Italy Market Value (USD Billion) Forecast by Product Type, 2020-2035
  • Table 194: Italy Market Volume (Units) Forecast by Product Type, 2020-2035
  • Table 195: Italy Market Value (USD Billion) Forecast by Industry, 2020-2035
  • Table 196: Italy Market Volume (Units) Forecast by Industry, 2020-2035
  • Table 197: Italy Market Value (USD Billion) Forecast by Capacity, 2020-2035
  • Table 198: Italy Market Volume (Units) Forecast by Capacity, 2020-2035
  • Table 199: Italy Market Value (USD Billion) Forecast by Installation, 2020-2035
  • Table 200: Italy Market Volume (Units) Forecast by Installation, 2020-2035
  • Table 201: Spain Market Value (USD Billion) Forecast by Product Type, 2020-2035
  • Table 202: Spain Market Volume (Units) Forecast by Product Type, 2020-2035
  • Table 203: Spain Market Value (USD Billion) Forecast by Industry, 2020-2035
  • Table 204: Spain Market Volume (Units) Forecast by Industry, 2020-2035
  • Table 205: Spain Market Value (USD Billion) Forecast by Capacity, 2020-2035
  • Table 206: Spain Market Volume (Units) Forecast by Capacity, 2020-2035
  • Table 207: Spain Market Value (USD Billion) Forecast by Installation, 2020-2035
  • Table 208: Spain Market Volume (Units) Forecast by Installation, 2020-2035
  • Table 209: BENELUX Market Value (USD Billion) Forecast by Product Type, 2020-2035
  • Table 210: BENELUX Market Volume (Units) Forecast by Product Type, 2020-2035
  • Table 211: BENELUX Market Value (USD Billion) Forecast by Industry, 2020-2035
  • Table 212: BENELUX Market Volume (Units) Forecast by Industry, 2020-2035
  • Table 213: BENELUX Market Value (USD Billion) Forecast by Capacity, 2020-2035
  • Table 214: BENELUX Market Volume (Units) Forecast by Capacity, 2020-2035
  • Table 215: BENELUX Market Value (USD Billion) Forecast by Installation, 2020-2035
  • Table 216: BENELUX Market Volume (Units) Forecast by Installation, 2020-2035
  • Table 217: Nordic Countries Market Value (USD Billion) Forecast by Product Type, 2020-2035
  • Table 218: Nordic Countries Market Volume (Units) Forecast by Product Type, 2020-2035
  • Table 219: Nordic Countries Market Value (USD Billion) Forecast by Industry, 2020-2035
  • Table 220: Nordic Countries Market Volume (Units) Forecast by Industry, 2020-2035
  • Table 221: Nordic Countries Market Value (USD Billion) Forecast by Capacity, 2020-2035
  • Table 222: Nordic Countries Market Volume (Units) Forecast by Capacity, 2020-2035
  • Table 223: Nordic Countries Market Value (USD Billion) Forecast by Installation, 2020-2035
  • Table 224: Nordic Countries Market Volume (Units) Forecast by Installation, 2020-2035
  • Table 225: Russia Market Value (USD Billion) Forecast by Product Type, 2020-2035
  • Table 226: Russia Market Volume (Units) Forecast by Product Type, 2020-2035
  • Table 227: Russia Market Value (USD Billion) Forecast by Industry, 2020-2035
  • Table 228: Russia Market Volume (Units) Forecast by Industry, 2020-2035
  • Table 229: Russia Market Value (USD Billion) Forecast by Capacity, 2020-2035
  • Table 230: Russia Market Volume (Units) Forecast by Capacity, 2020-2035
  • Table 231: Russia Market Value (USD Billion) Forecast by Installation, 2020-2035
  • Table 232: Russia Market Volume (Units) Forecast by Installation, 2020-2035
  • Table 233: Hungary Market Value (USD Billion) Forecast by Product Type, 2020-2035
  • Table 234: Hungary Market Volume (Units) Forecast by Product Type, 2020-2035
  • Table 235: Hungary Market Value (USD Billion) Forecast by Industry, 2020-2035
  • Table 236: Hungary Market Volume (Units) Forecast by Industry, 2020-2035
  • Table 237: Hungary Market Value (USD Billion) Forecast by Capacity, 2020-2035
  • Table 238: Hungary Market Volume (Units) Forecast by Capacity, 2020-2035
  • Table 239: Hungary Market Value (USD Billion) Forecast by Installation, 2020-2035
  • Table 240: Hungary Market Volume (Units) Forecast by Installation, 2020-2035
  • Table 241: Poland Market Value (USD Billion) Forecast by Product Type, 2020-2035
  • Table 242: Poland Market Volume (Units) Forecast by Product Type, 2020-2035
  • Table 243: Poland Market Value (USD Billion) Forecast by Industry, 2020-2035
  • Table 244: Poland Market Volume (Units) Forecast by Industry, 2020-2035
  • Table 245: Poland Market Value (USD Billion) Forecast by Capacity, 2020-2035
  • Table 246: Poland Market Volume (Units) Forecast by Capacity, 2020-2035
  • Table 247: Poland Market Value (USD Billion) Forecast by Installation, 2020-2035
  • Table 248: Poland Market Volume (Units) Forecast by Installation, 2020-2035
  • Table 249: Saudi Arabia Market Value (USD Billion) Forecast by Product Type, 2020-2035
  • Table 250: Saudi Arabia Market Volume (Units) Forecast by Product Type, 2020-2035
  • Table 251: Saudi Arabia Market Value (USD Billion) Forecast by Industry, 2020-2035
  • Table 252: Saudi Arabia Market Volume (Units) Forecast by Industry, 2020-2035
  • Table 253: Saudi Arabia Market Value (USD Billion) Forecast by Capacity, 2020-2035
  • Table 254: Saudi Arabia Market Volume (Units) Forecast by Capacity, 2020-2035
  • Table 255: Saudi Arabia Market Value (USD Billion) Forecast by Installation, 2020-2035
  • Table 256: Saudi Arabia Market Volume (Units) Forecast by Installation, 2020-2035
  • Table 257: Türkiye Market Value (USD Billion) Forecast by Product Type, 2020-2035
  • Table 258: Türkiye Market Volume (Units) Forecast by Product Type, 2020-2035
  • Table 259: Türkiye Market Value (USD Billion) Forecast by Industry, 2020-2035
  • Table 260: Türkiye Market Volume (Units) Forecast by Industry, 2020-2035
  • Table 261: Türkiye Market Value (USD Billion) Forecast by Capacity, 2020-2035
  • Table 262: Türkiye Market Volume (Units) Forecast by Capacity, 2020-2035
  • Table 263: Türkiye Market Value (USD Billion) Forecast by Installation, 2020-2035
  • Table 264: Türkiye Market Volume (Units) Forecast by Installation, 2020-2035
  • Table 265: South Africa Market Value (USD Billion) Forecast by Product Type, 2020-2035
  • Table 266: South Africa Market Volume (Units) Forecast by Product Type, 2020-2035
  • Table 267: South Africa Market Value (USD Billion) Forecast by Industry, 2020-2035
  • Table 268: South Africa Market Volume (Units) Forecast by Industry, 2020-2035
  • Table 269: South Africa Market Value (USD Billion) Forecast by Capacity, 2020-2035
  • Table 270: South Africa Market Volume (Units) Forecast by Capacity, 2020-2035
  • Table 271: South Africa Market Value (USD Billion) Forecast by Installation, 2020-2035
  • Table 272: South Africa Market Volume (Units) Forecast by Installation, 2020-2035

List of Figures

  • Figure 1: Global Market Value (USD Billion) by Product Type, 2025-2035
  • Figure 2: Global Market Value (USD Billion) by Industry, 2025-2035
  • Figure 3: Global Market Value (USD Billion) by Capacity, 2025-2035
  • Figure 4: Global Market Value (USD Billion) by Installation, 2025-2035
  • Figure 5: Global Market Value (USD Billion) by Region, 2025-2035
  • Figure 6: Global Market Value (USD Billion) Analysis by Region, 2020-2035
  • Figure 7: Global Market Volume (Units) Analysis by Region, 2020-2035
  • Figure 8: Global Market Value Share (%) and BPS Analysis by Region, 2025-2035
  • Figure 9: Global Market Y-o-Y Growth (%) Projections by Region, 2025-2035
  • Figure 10: Global Market Value (USD Billion) Analysis by Product Type, 2020-2035
  • Figure 11: Global Market Volume (Units) Analysis by Product Type, 2020-2035
  • Figure 12: Global Market Value Share (%) and BPS Analysis by Product Type, 2025-2035
  • Figure 13: Global Market Y-o-Y Growth (%) Projections by Product Type, 2025-2035
  • Figure 14: Global Market Value (USD Billion) Analysis by Industry, 2020-2035
  • Figure 15: Global Market Volume (Units) Analysis by Industry, 2020-2035
  • Figure 16: Global Market Value Share (%) and BPS Analysis by Industry, 2025-2035
  • Figure 17: Global Market Y-o-Y Growth (%) Projections by Industry, 2025-2035
  • Figure 18: Global Market Value (USD Billion) Analysis by Capacity, 2020-2035
  • Figure 19: Global Market Volume (Units) Analysis by Capacity, 2020-2035
  • Figure 20: Global Market Value Share (%) and BPS Analysis by Capacity, 2025-2035
  • Figure 21: Global Market Y-o-Y Growth (%) Projections by Capacity, 2025-2035
  • Figure 22: Global Market Value (USD Billion) Analysis by Installation, 2020-2035
  • Figure 23: Global Market Volume (Units) Analysis by Installation, 2020-2035
  • Figure 24: Global Market Value Share (%) and BPS Analysis by Installation, 2025-2035
  • Figure 25: Global Market Y-o-Y Growth (%) Projections by Installation, 2025-2035
  • Figure 26: Global Market Attractiveness by Product Type, 2025-2035
  • Figure 27: Global Market Attractiveness by Industry, 2025-2035
  • Figure 28: Global Market Attractiveness by Capacity, 2025-2035
  • Figure 29: Global Market Attractiveness by Installation, 2025-2035
  • Figure 30: Global Market Attractiveness by Region, 2025-2035
  • Figure 31: North America Market Value (USD Billion) by Product Type, 2025-2035
  • Figure 32: North America Market Value (USD Billion) by Industry, 2025-2035
  • Figure 33: North America Market Value (USD Billion) by Capacity, 2025-2035
  • Figure 34: North America Market Value (USD Billion) by Installation, 2025-2035
  • Figure 35: North America Market Value (USD Billion) by Country, 2025-2035
  • Figure 36: North America Market Value (USD Billion) Analysis by Country, 2020-2035
  • Figure 37: North America Market Volume (Units) Analysis by Country, 2020-2035
  • Figure 38: North America Market Value Share (%) and BPS Analysis by Country, 2025-2035
  • Figure 39: North America Market Y-o-Y Growth (%) Projections by Country, 2025-2035
  • Figure 40: North America Market Value (USD Billion) Analysis by Product Type, 2020-2035
  • Figure 41: North America Market Volume (Units) Analysis by Product Type, 2020-2035
  • Figure 42: North America Market Value Share (%) and BPS Analysis by Product Type, 2025-2035
  • Figure 43: North America Market Y-o-Y Growth (%) Projections by Product Type, 2025-2035
  • Figure 44: North America Market Value (USD Billion) Analysis by Industry, 2020-2035
  • Figure 45: North America Market Volume (Units) Analysis by Industry, 2020-2035
  • Figure 46: North America Market Value Share (%) and BPS Analysis by Industry, 2025-2035
  • Figure 47: North America Market Y-o-Y Growth (%) Projections by Industry, 2025-2035
  • Figure 48: North America Market Value (USD Billion) Analysis by Capacity, 2020-2035
  • Figure 49: North America Market Volume (Units) Analysis by Capacity, 2020-2035
  • Figure 50: North America Market Value Share (%) and BPS Analysis by Capacity, 2025-2035
  • Figure 51: North America Market Y-o-Y Growth (%) Projections by Capacity, 2025-2035
  • Figure 52: North America Market Value (USD Billion) Analysis by Installation, 2020-2035
  • Figure 53: North America Market Volume (Units) Analysis by Installation, 2020-2035
  • Figure 54: North America Market Value Share (%) and BPS Analysis by Installation, 2025-2035
  • Figure 55: North America Market Y-o-Y Growth (%) Projections by Installation, 2025-2035
  • Figure 56: North America Market Attractiveness by Product Type, 2025-2035
  • Figure 57: North America Market Attractiveness by Industry, 2025-2035
  • Figure 58: North America Market Attractiveness by Capacity, 2025-2035
  • Figure 59: North America Market Attractiveness by Installation, 2025-2035
  • Figure 60: North America Market Attractiveness by Country, 2025-2035
  • Figure 61: Latin America Market Value (USD Billion) by Product Type, 2025-2035
  • Figure 62: Latin America Market Value (USD Billion) by Industry, 2025-2035
  • Figure 63: Latin America Market Value (USD Billion) by Capacity, 2025-2035
  • Figure 64: Latin America Market Value (USD Billion) by Installation, 2025-2035
  • Figure 65: Latin America Market Value (USD Billion) by Country, 2025-2035
  • Figure 66: Latin America Market Value (USD Billion) Analysis by Country, 2020-2035
  • Figure 67: Latin America Market Volume (Units) Analysis by Country, 2020-2035
  • Figure 68: Latin America Market Value Share (%) and BPS Analysis by Country, 2025-2035
  • Figure 69: Latin America Market Y-o-Y Growth (%) Projections by Country, 2025-2035
  • Figure 70: Latin America Market Value (USD Billion) Analysis by Product Type, 2020-2035
  • Figure 71: Latin America Market Volume (Units) Analysis by Product Type, 2020-2035
  • Figure 72: Latin America Market Value Share (%) and BPS Analysis by Product Type, 2025-2035
  • Figure 73: Latin America Market Y-o-Y Growth (%) Projections by Product Type, 2025-2035
  • Figure 74: Latin America Market Value (USD Billion) Analysis by Industry, 2020-2035
  • Figure 75: Latin America Market Volume (Units) Analysis by Industry, 2020-2035
  • Figure 76: Latin America Market Value Share (%) and BPS Analysis by Industry, 2025-2035
  • Figure 77: Latin America Market Y-o-Y Growth (%) Projections by Industry, 2025-2035
  • Figure 78: Latin America Market Value (USD Billion) Analysis by Capacity, 2020-2035
  • Figure 79: Latin America Market Volume (Units) Analysis by Capacity, 2020-2035
  • Figure 80: Latin America Market Value Share (%) and BPS Analysis by Capacity, 2025-2035
  • Figure 81: Latin America Market Y-o-Y Growth (%) Projections by Capacity, 2025-2035
  • Figure 82: Latin America Market Value (USD Billion) Analysis by Installation, 2020-2035
  • Figure 83: Latin America Market Volume (Units) Analysis by Installation, 2020-2035
  • Figure 84: Latin America Market Value Share (%) and BPS Analysis by Installation, 2025-2035
  • Figure 85: Latin America Market Y-o-Y Growth (%) Projections by Installation, 2025-2035
  • Figure 86: Latin America Market Attractiveness by Product Type, 2025-2035
  • Figure 87: Latin America Market Attractiveness by Industry, 2025-2035
  • Figure 88: Latin America Market Attractiveness by Capacity, 2025-2035
  • Figure 89: Latin America Market Attractiveness by Installation, 2025-2035
  • Figure 90: Latin America Market Attractiveness by Country, 2025-2035
  • Figure 91: East Asia Market Value (USD Billion) by Product Type, 2025-2035
  • Figure 92: East Asia Market Value (USD Billion) by Industry, 2025-2035
  • Figure 93: East Asia Market Value (USD Billion) by Capacity, 2025-2035
  • Figure 94: East Asia Market Value (USD Billion) by Installation, 2025-2035
  • Figure 95: East Asia Market Value (USD Billion) by Country, 2025-2035
  • Figure 96: East Asia Market Value (USD Billion) Analysis by Country, 2020-2035
  • Figure 97: East Asia Market Volume (Units) Analysis by Country, 2020-2035
  • Figure 98: East Asia Market Value Share (%) and BPS Analysis by Country, 2025-2035
  • Figure 99: East Asia Market Y-o-Y Growth (%) Projections by Country, 2025-2035
  • Figure 100: East Asia Market Value (USD Billion) Analysis by Product Type, 2020-2035
  • Figure 101: East Asia Market Volume (Units) Analysis by Product Type, 2020-2035
  • Figure 102: East Asia Market Value Share (%) and BPS Analysis by Product Type, 2025-2035
  • Figure 103: East Asia Market Y-o-Y Growth (%) Projections by Product Type, 2025-2035
  • Figure 104: East Asia Market Value (USD Billion) Analysis by Industry, 2020-2035
  • Figure 105: East Asia Market Volume (Units) Analysis by Industry, 2020-2035
  • Figure 106: East Asia Market Value Share (%) and BPS Analysis by Industry, 2025-2035
  • Figure 107: East Asia Market Y-o-Y Growth (%) Projections by Industry, 2025-2035
  • Figure 108: East Asia Market Value (USD Billion) Analysis by Capacity, 2020-2035
  • Figure 109: East Asia Market Volume (Units) Analysis by Capacity, 2020-2035
  • Figure 110: East Asia Market Value Share (%) and BPS Analysis by Capacity, 2025-2035
  • Figure 111: East Asia Market Y-o-Y Growth (%) Projections by Capacity, 2025-2035
  • Figure 112: East Asia Market Value (USD Billion) Analysis by Installation, 2020-2035
  • Figure 113: East Asia Market Volume (Units) Analysis by Installation, 2020-2035
  • Figure 114: East Asia Market Value Share (%) and BPS Analysis by Installation, 2025-2035
  • Figure 115: East Asia Market Y-o-Y Growth (%) Projections by Installation, 2025-2035
  • Figure 116: East Asia Market Attractiveness by Product Type, 2025-2035
  • Figure 117: East Asia Market Attractiveness by Industry, 2025-2035
  • Figure 118: East Asia Market Attractiveness by Capacity, 2025-2035
  • Figure 119: East Asia Market Attractiveness by Installation, 2025-2035
  • Figure 120: East Asia Market Attractiveness by Country, 2025-2035
  • Figure 121: South Asia & Pacific Market Value (USD Billion) by Product Type, 2025-2035
  • Figure 122: South Asia & Pacific Market Value (USD Billion) by Industry, 2025-2035
  • Figure 123: South Asia & Pacific Market Value (USD Billion) by Capacity, 2025-2035
  • Figure 124: South Asia & Pacific Market Value (USD Billion) by Installation, 2025-2035
  • Figure 125: South Asia & Pacific Market Value (USD Billion) by Country, 2025-2035
  • Figure 126: South Asia & Pacific Market Value (USD Billion) Analysis by Country, 2020-2035
  • Figure 127: South Asia & Pacific Market Volume (Units) Analysis by Country, 2020-2035
  • Figure 128: South Asia & Pacific Market Value Share (%) and BPS Analysis by Country, 2025-2035
  • Figure 129: South Asia & Pacific Market Y-o-Y Growth (%) Projections by Country, 2025-2035
  • Figure 130: South Asia & Pacific Market Value (USD Billion) Analysis by Product Type, 2020-2035
  • Figure 131: South Asia & Pacific Market Volume (Units) Analysis by Product Type, 2020-2035
  • Figure 132: South Asia & Pacific Market Value Share (%) and BPS Analysis by Product Type, 2025-2035
  • Figure 133: South Asia & Pacific Market Y-o-Y Growth (%) Projections by Product Type, 2025-2035
  • Figure 134: South Asia & Pacific Market Value (USD Billion) Analysis by Industry, 2020-2035
  • Figure 135: South Asia & Pacific Market Volume (Units) Analysis by Industry, 2020-2035
  • Figure 136: South Asia & Pacific Market Value Share (%) and BPS Analysis by Industry, 2025-2035
  • Figure 137: South Asia & Pacific Market Y-o-Y Growth (%) Projections by Industry, 2025-2035
  • Figure 138: South Asia & Pacific Market Value (USD Billion) Analysis by Capacity, 2020-2035
  • Figure 139: South Asia & Pacific Market Volume (Units) Analysis by Capacity, 2020-2035
  • Figure 140: South Asia & Pacific Market Value Share (%) and BPS Analysis by Capacity, 2025-2035
  • Figure 141: South Asia & Pacific Market Y-o-Y Growth (%) Projections by Capacity, 2025-2035
  • Figure 142: South Asia & Pacific Market Value (USD Billion) Analysis by Installation, 2020-2035
  • Figure 143: South Asia & Pacific Market Volume (Units) Analysis by Installation, 2020-2035
  • Figure 144: South Asia & Pacific Market Value Share (%) and BPS Analysis by Installation, 2025-2035
  • Figure 145: South Asia & Pacific Market Y-o-Y Growth (%) Projections by Installation, 2025-2035
  • Figure 146: South Asia & Pacific Market Attractiveness by Product Type, 2025-2035
  • Figure 147: South Asia & Pacific Market Attractiveness by Industry, 2025-2035
  • Figure 148: South Asia & Pacific Market Attractiveness by Capacity, 2025-2035
  • Figure 149: South Asia & Pacific Market Attractiveness by Installation, 2025-2035
  • Figure 150: South Asia & Pacific Market Attractiveness by Country, 2025-2035
  • Figure 151: Western Europe Market Value (USD Billion) by Product Type, 2025-2035
  • Figure 152: Western Europe Market Value (USD Billion) by Industry, 2025-2035
  • Figure 153: Western Europe Market Value (USD Billion) by Capacity, 2025-2035
  • Figure 154: Western Europe Market Value (USD Billion) by Installation, 2025-2035
  • Figure 155: Western Europe Market Value (USD Billion) by Country, 2025-2035
  • Figure 156: Western Europe Market Value (USD Billion) Analysis by Country, 2020-2035
  • Figure 157: Western Europe Market Volume (Units) Analysis by Country, 2020-2035
  • Figure 158: Western Europe Market Value Share (%) and BPS Analysis by Country, 2025-2035
  • Figure 159: Western Europe Market Y-o-Y Growth (%) Projections by Country, 2025-2035
  • Figure 160: Western Europe Market Value (USD Billion) Analysis by Product Type, 2020-2035
  • Figure 161: Western Europe Market Volume (Units) Analysis by Product Type, 2020-2035
  • Figure 162: Western Europe Market Value Share (%) and BPS Analysis by Product Type, 2025-2035
  • Figure 163: Western Europe Market Y-o-Y Growth (%) Projections by Product Type, 2025-2035
  • Figure 164: Western Europe Market Value (USD Billion) Analysis by Industry, 2020-2035
  • Figure 165: Western Europe Market Volume (Units) Analysis by Industry, 2020-2035
  • Figure 166: Western Europe Market Value Share (%) and BPS Analysis by Industry, 2025-2035
  • Figure 167: Western Europe Market Y-o-Y Growth (%) Projections by Industry, 2025-2035
  • Figure 168: Western Europe Market Value (USD Billion) Analysis by Capacity, 2020-2035
  • Figure 169: Western Europe Market Volume (Units) Analysis by Capacity, 2020-2035
  • Figure 170: Western Europe Market Value Share (%) and BPS Analysis by Capacity, 2025-2035
  • Figure 171: Western Europe Market Y-o-Y Growth (%) Projections by Capacity, 2025-2035
  • Figure 172: Western Europe Market Value (USD Billion) Analysis by Installation, 2020-2035
  • Figure 173: Western Europe Market Volume (Units) Analysis by Installation, 2020-2035
  • Figure 174: Western Europe Market Value Share (%) and BPS Analysis by Installation, 2025-2035
  • Figure 175: Western Europe Market Y-o-Y Growth (%) Projections by Installation, 2025-2035
  • Figure 176: Western Europe Market Attractiveness by Product Type, 2025-2035
  • Figure 177: Western Europe Market Attractiveness by Industry, 2025-2035
  • Figure 178: Western Europe Market Attractiveness by Capacity, 2025-2035
  • Figure 179: Western Europe Market Attractiveness by Installation, 2025-2035
  • Figure 180: Western Europe Market Attractiveness by Country, 2025-2035
  • Figure 181: Eastern Europe Market Value (USD Billion) by Product Type, 2025-2035
  • Figure 182: Eastern Europe Market Value (USD Billion) by Industry, 2025-2035
  • Figure 183: Eastern Europe Market Value (USD Billion) by Capacity, 2025-2035
  • Figure 184: Eastern Europe Market Value (USD Billion) by Installation, 2025-2035
  • Figure 185: Eastern Europe Market Value (USD Billion) by Country, 2025-2035
  • Figure 186: Eastern Europe Market Value (USD Billion) Analysis by Country, 2020-2035
  • Figure 187: Eastern Europe Market Volume (Units) Analysis by Country, 2020-2035
  • Figure 188: Eastern Europe Market Value Share (%) and BPS Analysis by Country, 2025-2035
  • Figure 189: Eastern Europe Market Y-o-Y Growth (%) Projections by Country, 2025-2035
  • Figure 190: Eastern Europe Market Value (USD Billion) Analysis by Product Type, 2020-2035
  • Figure 191: Eastern Europe Market Volume (Units) Analysis by Product Type, 2020-2035
  • Figure 192: Eastern Europe Market Value Share (%) and BPS Analysis by Product Type, 2025-2035
  • Figure 193: Eastern Europe Market Y-o-Y Growth (%) Projections by Product Type, 2025-2035
  • Figure 194: Eastern Europe Market Value (USD Billion) Analysis by Industry, 2020-2035
  • Figure 195: Eastern Europe Market Volume (Units) Analysis by Industry, 2020-2035
  • Figure 196: Eastern Europe Market Value Share (%) and BPS Analysis by Industry, 2025-2035
  • Figure 197: Eastern Europe Market Y-o-Y Growth (%) Projections by Industry, 2025-2035
  • Figure 198: Eastern Europe Market Value (USD Billion) Analysis by Capacity, 2020-2035
  • Figure 199: Eastern Europe Market Volume (Units) Analysis by Capacity, 2020-2035
  • Figure 200: Eastern Europe Market Value Share (%) and BPS Analysis by Capacity, 2025-2035
  • Figure 201: Eastern Europe Market Y-o-Y Growth (%) Projections by Capacity, 2025-2035
  • Figure 202: Eastern Europe Market Value (USD Billion) Analysis by Installation, 2020-2035
  • Figure 203: Eastern Europe Market Volume (Units) Analysis by Installation, 2020-2035
  • Figure 204: Eastern Europe Market Value Share (%) and BPS Analysis by Installation, 2025-2035
  • Figure 205: Eastern Europe Market Y-o-Y Growth (%) Projections by Installation, 2025-2035
  • Figure 206: Eastern Europe Market Attractiveness by Product Type, 2025-2035
  • Figure 207: Eastern Europe Market Attractiveness by Industry, 2025-2035
  • Figure 208: Eastern Europe Market Attractiveness by Capacity, 2025-2035
  • Figure 209: Eastern Europe Market Attractiveness by Installation, 2025-2035
  • Figure 210: Eastern Europe Market Attractiveness by Country, 2025-2035
  • Figure 211: Middle East & Africa Market Value (USD Billion) by Product Type, 2025-2035
  • Figure 212: Middle East & Africa Market Value (USD Billion) by Industry, 2025-2035
  • Figure 213: Middle East & Africa Market Value (USD Billion) by Capacity, 2025-2035
  • Figure 214: Middle East & Africa Market Value (USD Billion) by Installation, 2025-2035
  • Figure 215: Middle East & Africa Market Value (USD Billion) by Country, 2025-2035
  • Figure 216: Middle East & Africa Market Value (USD Billion) Analysis by Country, 2020-2035
  • Figure 217: Middle East & Africa Market Volume (Units) Analysis by Country, 2020-2035
  • Figure 218: Middle East & Africa Market Value Share (%) and BPS Analysis by Country, 2025-2035
  • Figure 219: Middle East & Africa Market Y-o-Y Growth (%) Projections by Country, 2025-2035
  • Figure 220: Middle East & Africa Market Value (USD Billion) Analysis by Product Type, 2020-2035
  • Figure 221: Middle East & Africa Market Volume (Units) Analysis by Product Type, 2020-2035
  • Figure 222: Middle East & Africa Market Value Share (%) and BPS Analysis by Product Type, 2025-2035
  • Figure 223: Middle East & Africa Market Y-o-Y Growth (%) Projections by Product Type, 2025-2035
  • Figure 224: Middle East & Africa Market Value (USD Billion) Analysis by Industry, 2020-2035
  • Figure 225: Middle East & Africa Market Volume (Units) Analysis by Industry, 2020-2035
  • Figure 226: Middle East & Africa Market Value Share (%) and BPS Analysis by Industry, 2025-2035
  • Figure 227: Middle East & Africa Market Y-o-Y Growth (%) Projections by Industry, 2025-2035
  • Figure 228: Middle East & Africa Market Value (USD Billion) Analysis by Capacity, 2020-2035
  • Figure 229: Middle East & Africa Market Volume (Units) Analysis by Capacity, 2020-2035
  • Figure 230: Middle East & Africa Market Value Share (%) and BPS Analysis by Capacity, 2025-2035
  • Figure 231: Middle East & Africa Market Y-o-Y Growth (%) Projections by Capacity, 2025-2035
  • Figure 232: Middle East & Africa Market Value (USD Billion) Analysis by Installation, 2020-2035
  • Figure 233: Middle East & Africa Market Volume (Units) Analysis by Installation, 2020-2035
  • Figure 234: Middle East & Africa Market Value Share (%) and BPS Analysis by Installation, 2025-2035
  • Figure 235: Middle East & Africa Market Y-o-Y Growth (%) Projections by Installation, 2025-2035
  • Figure 236: Middle East & Africa Market Attractiveness by Product Type, 2025-2035
  • Figure 237: Middle East & Africa Market Attractiveness by Industry, 2025-2035
  • Figure 238: Middle East & Africa Market Attractiveness by Capacity, 2025-2035
  • Figure 239: Middle East & Africa Market Attractiveness by Installation, 2025-2035
  • Figure 240: Middle East & Africa Market Attractiveness by Country, 2025-2035

Frequently Asked Questions

How big is the gas cooling system market in 2025?

The global gas cooling system market is valued at USD 4,789.1 million in 2025.

What will be the size of gas cooling system market in 2035?

The size for the gas cooling system market is projected to reach USD 7,021.1 million by 2035.

How much will be the gas cooling system market growth between 2025 and 2035?

The gas cooling system market is expected to grow at a 3.9% CAGR between 2025 and 2035.

What are the key product type segments in the gas cooling system market?

The key product type segments in the gas cooling system market are air-cooled heat exchanger, dry coolers, evaporative/gas coolers, and others.

Which industry segment is expected to contribute significant share in the gas cooling system market in 2025?

In terms of industry, oil and gas segment is set to command 30.0% share in the gas cooling system market in 2025.

Explore Similar Insights

Future Market Insights

Gas Cooling System Market

Chat With

MaRIA

Hi There, I am MaRIA, Your Market Research Intelligence Assistant. How may I help you?