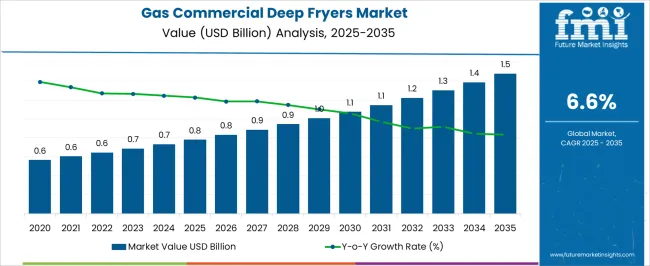
The Gas Commercial Deep Fryers Market is estimated to be valued at USD 0.8 billion in 2025 and is projected to reach USD 1.5 billion by 2035, registering a compound annual growth rate (CAGR) of 6.6% over the forecast period.
| Metric | Value |
|---|---|
| Gas Commercial Deep Fryers Market Estimated Value in (2025 E) | USD 0.8 billion |
| Gas Commercial Deep Fryers Market Forecast Value in (2035 F) | USD 1.5 billion |
| Forecast CAGR (2025 to 2035) | 6.6% |
The gas commercial deep fryers market is experiencing steady growth as foodservice operators continue to demand efficient, high capacity, and cost effective frying equipment. Rising consumer preference for fried food across quick service restaurants, full service dining, and institutional kitchens has driven the adoption of advanced fryer technologies.
Gas powered fryers are being favored for their superior heating efficiency, faster recovery times, and lower long term operational costs compared to electric alternatives. Manufacturers are focusing on energy efficient burners, oil management systems, and digital controls to enhance performance while reducing waste and environmental impact.
Regulatory requirements on energy efficiency standards in commercial kitchens are also shaping product innovation. The outlook for this market remains positive with opportunities emerging in smart kitchen integration, sustainability focused designs, and increasing expansion of foodservice chains across developing economies.
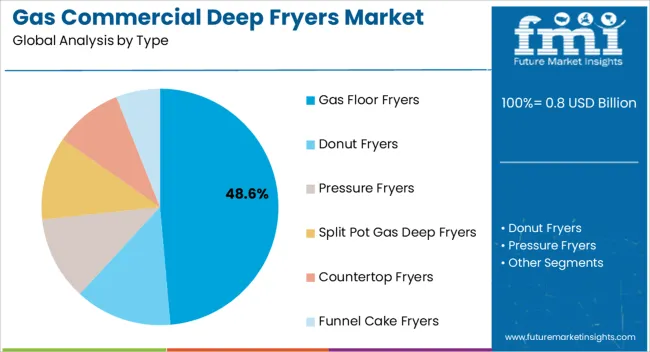
The gas floor fryers segment is expected to account for 48.60% of the total market revenue by 2025 within the type category, making it the leading segment. This dominance is attributed to their ability to handle high volume frying requirements, faster cooking cycles, and consistent product quality which are critical for large scale foodservice operations.
Their durability and compatibility with advanced oil filtration systems have further increased adoption across quick service restaurants and institutional kitchens.
The operational efficiency and long lifespan of gas floor fryers continue to strengthen their position as the preferred choice within the type category.
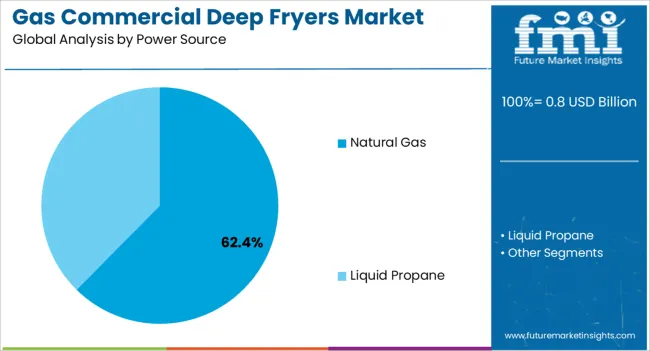
The natural gas segment is projected to hold 62.40% of total market revenue by 2025 within the power source category, positioning it as the most significant contributor. This growth is supported by the wide availability of natural gas, its cost effectiveness compared to other energy sources, and the lower environmental impact associated with cleaner burning fuel.
Foodservice operators have increasingly relied on natural gas to maintain stable energy costs while meeting sustainability goals.
The consistent heat distribution and efficient combustion properties of natural gas further enhance frying performance, consolidating its leadership in the power source category.
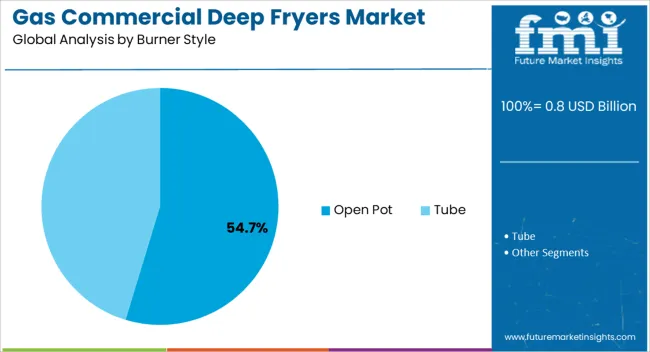
The open pot burner style segment is anticipated to represent 54.70% of market revenue by 2025 under the burner style category, making it the dominant style. This is due to its suitability for cooking a wide range of food products such as fries, chicken, and seafood, while providing easier cleaning and maintenance compared to tube style fryers.
Open pot designs allow for quicker oil heating and recovery, ensuring consistent cooking quality during peak demand.
Their efficiency and ease of use have made them popular among fast paced commercial kitchens, reinforcing their dominance in the burner style category.
The global demand for gas commercial deep fryers is projected to increase at a CAGR of 3.9% during the forecast period between 2020 and 2025, reaching a total of USD 1,301.4 million in 2035. According to Future Market Insights, a market research and competitive intelligence provider, the gas commercial deep fryers market was valued at USD 0.8 million in 2025.
The hospitality industry, which includes hotels, resorts, and other accommodation establishments, is expanding globally. The demand for gas commercial deep fryers is expected to increase, as these establishments offer food services.
Also, with increasing health consciousness, there is a growing demand for healthier fried food alternatives. To meet this demand, gas commercial deep fryer manufacturers are developing fryers that use less oil and are more efficient, which is anticipated to foster growth prospects in the forthcoming years.
Furthermore, governments across the globe are increasingly setting safety standards for commercial cooking equipment, including gas fryers. These standards ensure that the equipment is safe to use and reduce the risk of accidents in commercial kitchens. This has led to an increase in the adoption of gas commercial deep fryers, as businesses seek to comply with these regulations.
The increasing government initiatives can create a more favorable environment for the growth of the gas commercial deep fryers market by setting safety and energy efficiency standards, providing incentives for businesses, and addressing environmental concerns.
For instance, in the United States, the Environmental Protection Agency (EPA) has established energy efficiency standards for commercial kitchen equipment, including gas fryers. Additionally, there may be government incentives or programs to encourage the use of energy-efficient or environmentally-friendly equipment.
Moreover, in the European Union, the Energy-related Products Directive (ErP) sets energy efficiency standards for commercial cooking equipment, including gas fryers. Manufacturers must meet these standards in order to sell their equipment in the EU market. The ErP aims to reduce energy consumption and greenhouse gas emissions from commercial kitchen equipment.
Increasing Adoption of Online Food Ordering to Fuel the Market Growth
Increasing adoption of online food ordering: The trend of online food ordering has been growing rapidly in recent years, and it is expected to continue to do so in the future. The foodservice industry is a major user of commercial deep fryers, and the demand for gas commercial deep fryers is expected to increase due to the growing demand for fried food items in restaurants, fast-food chains, and other food outlets. Additionally, with the rising popularity of street food and food trucks, the demand for portable gas commercial deep fryers is also expected to increase.
As more consumers order food online, restaurants and other food outlets are under pressure to offer a wider range of menu items to cater to this demand. Many online food ordering platforms offer a large selection of restaurants and food outlets, and these outlets need to differentiate themselves by offering unique and tasty menu items, including fried food items.
Fried food items are a popular choice for many consumers, and they require gas commercial deep fryers to prepare. As a result, the growing trend of online food ordering is expected to increase demand for gas commercial deep fryers, as restaurants and other food outlets seek to offer a wider range of menu items to cater to this demand.
Growing Popularity of Fried Foods to Accelerate the Market Growth
Fried foods, such as french fries, chicken wings, and fried chicken, are popular around the world and continue to be a part of people's daily diets. This popularity has driven the demand for gas commercial deep fryers, which are used to fry these food items in restaurants, fast-food chains, and other food outlets.
Consumers are increasingly demanding fried foods due to their taste, convenience, and affordability. They are also becoming more health-conscious, which has led to the development of healthier versions of fried foods, such as air-fried and oven-fried items.
As the demand for fried foods continues to grow, restaurants and food outlets need to meet this demand by using efficient and reliable cooking equipment. Gas commercial deep fryers are preferred by many food businesses due to their high cooking capacity, faster cooking time, and cost-effectiveness. They are also easier to maintain and clean compared to other types of deep fryers.
The trend of eating out is also contributing to the growth of the gas commercial deep fryers market. As people eat out more often, they are exposed to a wider range of food options, including fried foods. This has led to an increased demand for gas commercial deep fryers in restaurants, fast-food chains, and other food outlets.
Increasing Concern Regarding Health Risks to Restrain the Market
One major factor limiting the growth of the Commercial Deep Fryers Market is the growing concern among consumers about the health risks associated with consuming fried foods. Fried foods are often high in fat, calories, and cholesterol, and their consumption has been linked to health issues such as obesity, heart disease, and diabetes.
Consequently, many consumers are looking for healthier food options, and this has led to a shift in demand away from fried foods. This shift in consumer preferences has had an impact on the demand for commercial deep fryers, as foodservice operators are under pressure to offer healthier menu items and reduce their reliance on fried foods.
Furthermore, government regulations and initiatives aimed at promoting healthy eating habits have also contributed to the decline in demand for fried foods and commercial deep fryers. For instance, some countries have introduced taxes on sugary and fatty foods to discourage their consumption and promote healthier options.
Rising Interest in Convenience Foods in North America to Fuel the Market Growth
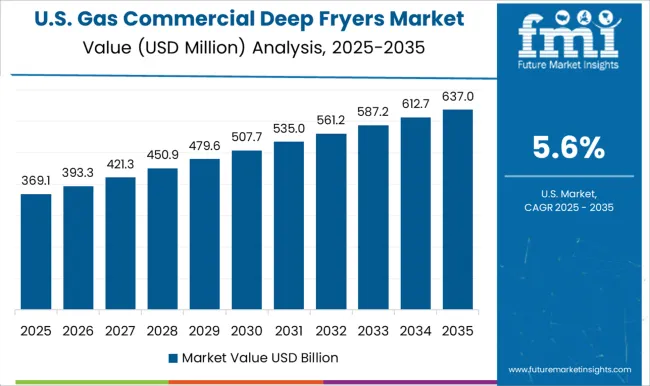
The gas commercial deep fryers market in the United States accumulated the highest market share of 33.4% in 2025. The foodservice industry in North America is a major consumer of commercial deep fryers, as they are an essential piece of equipment for preparing a wide range of popular menu items, such as french fries, onion rings, chicken wings, and fried chicken. As the food service industry in North America continues to grow, the demand for commercial deep fryers is also expected to increase.
Additionally, technological advancements in commercial deep fryers, such as the introduction of energy-efficient models, are also contributing to the growth of the market in North America. These advancements have helped to reduce operating costs and increase efficiency, making commercial deep fryers a more attractive investment for foodservice operators.
Moreover, convenience foods, such as frozen foods and pre-packaged meals, are also driving the growth of the Commercial Deep Fryers Market in North America. These foods often require deep frying to prepare, and as the demand for convenience foods continues to increase, so too does the demand for commercial deep fryers in the region.
Rising Government Initiatives such as Subsidies in the Region to Fuel the Market Growth
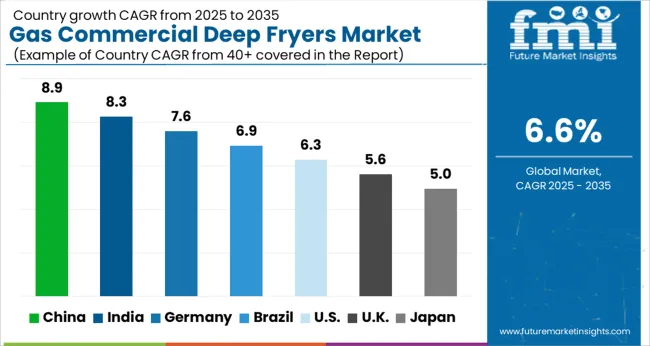
The gas commercial deep fryers market in the Asia Pacific is expected to be significant, with China set to expand at a CAGR of 6.0% from 2025 to 2035. The rapid urbanization and changing lifestyles in many countries in the Asia Pacific are driving the growth of the foodservice industry, which in turn is increasing demand for commercial deep fryers in the region. As more people move to urban areas and lead busy lifestyles, they are more likely to eat out or order food online, which has led to an increase in the number of restaurants and food outlets in the region.
Fast food and fried foods are becoming increasingly popular in Asia Pacific, particularly among younger consumers. This popularity is driving demand for commercial deep fryers, as these foods require deep frying to prepare. In addition, the technological advancements in commercial deep fryers, such as the introduction of energy-efficient models and automation features, are also contributing to the growth of the market in Asia Pacific. These advancements have helped to reduce operating costs and increase efficiency, making commercial deep fryers a more attractive investment for foodservice operators.
Furthermore, government initiatives and support in some countries in Asia Pacific are also driving the growth of the Commercial Deep Fryers Market. For instance, some governments are promoting the growth of the foodservice industry through subsidies and tax incentives, which is increasing demand for commercial deep fryers.
In India, the government has established safety standards for commercial cooking equipment, including gas fryers. The Bureau of Indian Standards (BIS) has issued safety standards for gas fryers that manufacturers must comply with in order to sell their equipment in the Indian market. These standards aim to ensure the safety of workers and customers in commercial kitchens.
Gas Floor Fryers Segment to beat Competition in Untiring Market
On the basis of type, the market is dominated by gas floor fryers segment, which is expected to hold a CAGR of 6.4% over the analysis period. One major factor driving the growth of gas floor fryers is their efficiency and cost-effectiveness. Gas floor fryers are known for their quick heating and recovery times, which allows food to be cooked quickly and efficiently, leading to improved productivity in the kitchen. Additionally, gas floor fryers are more cost-effective than electric fryers, as natural gas is generally less expensive than electricity.
Moreover, gas floor fryers are versatile and can be used to prepare a wide range of food items, making them a popular choice for many types of foodservice establishments. Their durability and ease of maintenance are also factors that contribute to their popularity.
Manufacturers of gas floor fryers are increasingly focusing on developing energy-efficient models that help reduce operating costs for foodservice operators. This is driving the adoption of gas floor fryers, particularly among small and medium-sized foodservice establishments. In addition, the growing popularity of ethnic cuisine, particularly in North America and Europe, is driving the demand for gas floor fryers. These fryers are used to prepare a wide range of ethnic dishes, such as tempura, pakoras, and samosas, among others.
Natural Gas Segment to Drive the Gas Commercial Deep Fryers Market
Based on the power source, the natural gas segment is expected to expand at rapid rate of 6.3% CAGR over the analysis period. Natural gas is typically less expensive than liquid propane, making it a more cost-effective fuel source for deep fryers. As a result, natural gas-powered deep fryers are preferred by food service operators who are looking to reduce their operating costs.
The segmental growth is also driven by the increasing availability of natural gas infrastructure. The availability of natural gas infrastructure has been steadily increasing over the past few years, particularly in North America and Europe. This has made it easier for food service operators to connect their deep fryers to the natural gas grid, further driving the growth of the Commercial Deep Fryers Market.
In addition, natural gas is a cleaner-burning fuel source than liquid propane, which makes it a more environmentally friendly option. As sustainability becomes increasingly important to consumers, food service operators are looking for ways to reduce their carbon footprint, and natural gas-powered deep fryers can help them achieve this goal.
Gas commercial deep fryers market startup players are adopting various marketing strategies such as new product launches, geographical expansion, merger and acquisitions, partnerships and collaboration to identify the interest of potential patients and create a larger customer base. For instance,
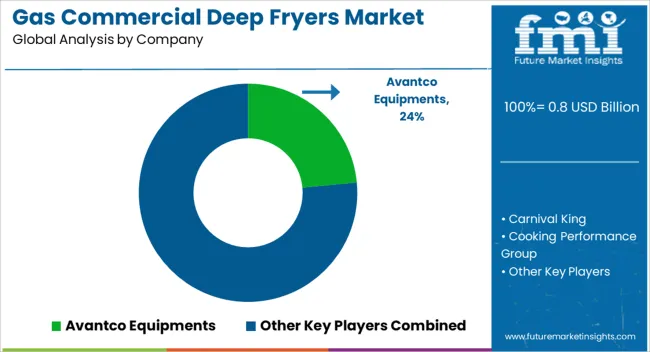
Prominent players in the gas commercial deep fryers market are
Recent Developments:
| Report Attribute | Details |
|---|---|
| Growth Rate | CAGR of 6.6% from 2025 to 2035 |
| Market Value in 2025 | USD 0.8 billion |
| Market Value in 2035 | USD 1.5 billion |
| Base Year for Estimation | 2025 |
| Historical Data | 2020 to 2025 |
| Forecast Period | 2025 to 2035 |
| Quantitative Units | Revenue in USD Million and CAGR from 2025 to 2035 |
| Report Coverage | Revenue Forecast, Company Ranking, Competitive Landscape, Growth Factors, Trends and Pricing Analysis |
| Segments Covered | Type, Power Source, Burner Style, Capacity |
| Regions Covered | North America; South Asia; East Asia; Oceania; Europe; Latin America; Middle East & Africa |
| Key Countries Profiled | United States, Canada, Brazil, Mexico, Germany, United Kingdom, France, Spain, Italy, India, Malaysia, Singapore, Thailand, China, Japan, South Korea, Australia, New Zealand, GCC Countries, South Africa, Israel |
| Key Companies Profiled | Avantco Equipments; Carnival King; Cooking Performance Group; Main Street Equipment; Frymaster; Garland; Globe Food Equipment; Henny Penny; Imperial Range; Pitco; Vulcan; Falcon Foodservice Equipment; Middleby Corporation; Ali Group |
| Report Customization & Pricing | Available upon Request |
The global gas commercial deep fryers market is estimated to be valued at USD 0.8 billion in 2025.
The market size for the gas commercial deep fryers market is projected to reach USD 1.5 billion by 2035.
The gas commercial deep fryers market is expected to grow at a 6.6% CAGR between 2025 and 2035.
The key product types in gas commercial deep fryers market are gas floor fryers, donut fryers, pressure fryers, split pot gas deep fryers, countertop fryers and funnel cake fryers.
In terms of power source, natural gas segment to command 62.4% share in the gas commercial deep fryers market in 2025.


Our Research Products

The "Full Research Suite" delivers actionable market intel, deep dives on markets or technologies, so clients act faster, cut risk, and unlock growth.

The Leaderboard benchmarks and ranks top vendors, classifying them as Established Leaders, Leading Challengers, or Disruptors & Challengers.

Locates where complements amplify value and substitutes erode it, forecasting net impact by horizon

We deliver granular, decision-grade intel: market sizing, 5-year forecasts, pricing, adoption, usage, revenue, and operational KPIs—plus competitor tracking, regulation, and value chains—across 60 countries broadly.

Spot the shifts before they hit your P&L. We track inflection points, adoption curves, pricing moves, and ecosystem plays to show where demand is heading, why it is changing, and what to do next across high-growth markets and disruptive tech

Real-time reads of user behavior. We track shifting priorities, perceptions of today’s and next-gen services, and provider experience, then pace how fast tech moves from trial to adoption, blending buyer, consumer, and channel inputs with social signals (#WhySwitch, #UX).

Partner with our analyst team to build a custom report designed around your business priorities. From analysing market trends to assessing competitors or crafting bespoke datasets, we tailor insights to your needs.
Supplier Intelligence
Discovery & Profiling
Capacity & Footprint
Performance & Risk
Compliance & Governance
Commercial Readiness
Who Supplies Whom
Scorecards & Shortlists
Playbooks & Docs
Category Intelligence
Definition & Scope
Demand & Use Cases
Cost Drivers
Market Structure
Supply Chain Map
Trade & Policy
Operating Norms
Deliverables
Buyer Intelligence
Account Basics
Spend & Scope
Procurement Model
Vendor Requirements
Terms & Policies
Entry Strategy
Pain Points & Triggers
Outputs
Pricing Analysis
Benchmarks
Trends
Should-Cost
Indexation
Landed Cost
Commercial Terms
Deliverables
Brand Analysis
Positioning & Value Prop
Share & Presence
Customer Evidence
Go-to-Market
Digital & Reputation
Compliance & Trust
KPIs & Gaps
Outputs
Full Research Suite comprises of:
Market outlook & trends analysis
Interviews & case studies
Strategic recommendations
Vendor profiles & capabilities analysis
5-year forecasts
8 regions and 60+ country-level data splits
Market segment data splits
12 months of continuous data updates
DELIVERED AS:
PDF EXCEL ONLINE
Electric Commercial Deep Fryers Market Analysis – Trends, Growth & Forecast 2025 to 2035
Specialty Commercial Deep Fryers Market Size and Share Forecast Outlook 2025 to 2035
Gas Fryers Market
Gas Fired Commercial Hot Water Boiler Market Size and Share Forecast Outlook 2025 to 2035
Gas Floor Fryers Market
Commercial Gas-Fired Boiler Market Size and Share Forecast Outlook 2025 to 2035
Commercial Deep Fryer Parts & Accessories Market Size and Share Forecast Outlook 2025 to 2035
Commercial Gas Restaurant Ranges Market Size and Share Forecast Outlook 2025 to 2035
Commercial Gas Gensets Market Size and Share Forecast Outlook 2025 to 2035
Gas Insulated Commercial Switchgear Market Size and Share Forecast Outlook 2025 to 2035
Gas Fired Low Temperature Commercial Boiler Market Size and Share Forecast Outlook 2025 to 2035
Gas Fired Condensing Low Temperature Commercial Boiler Market Size and Share Forecast Outlook 2025 to 2035
Commercial and Industrial Rotating Rack Oven Market Size and Share Forecast Outlook 2025 to 2035
Gas Insulated Switchgear (GIS) Bushing Market Size and Share Forecast Outlook 2025 to 2035
Gas Discharge Tube (GDT) Arresters Market Size and Share Forecast Outlook 2025 to 2035
Commercial Baking Rack Oven Market Size and Share Forecast Outlook 2025 to 2035
Commercial Blast Freezer Market Size and Share Forecast Outlook 2025 to 2035
Gas & Dual-Fuel Injection Systems Market Size and Share Forecast Outlook 2025 to 2035
Deep Brain Stimulator Market Size and Share Forecast Outlook 2025 to 2035
Gas Desiccant Dehydration Unit Market Size and Share Forecast Outlook 2025 to 2035

Thank you!
You will receive an email from our Business Development Manager. Please be sure to check your SPAM/JUNK folder too.
Chat With
MaRIA