- Global Locations -
Headquarters
Future Market Insights, Inc.
Christiana Corporate, 200 Continental Drive, Suite 401, Newark, Delaware - 19713, United States
T: +1-845-579-5705
Americas
Future Market Insights, Inc.
616 Corporate Way, Suite 2-9018,
Valley Cottage, NY 10989,
United States
T: +1-347-918-3531
MEA
Future Market Insights

1602-6 Jumeirah Bay X2 Tower, Plot No: JLT-PH2-X2A,

Jumeirah Lakes Towers, Dubai,

United Arab Emirates

Europe
Future Market Insights
3rd Floor, 207 Regent Street,
London W1B 3HH
United Kingdom
T: + 44 (0) 20 8123 9659
D: +44 (0) 20 3287 4268
Asia Pacific
Future Market Insights Global & Consulting Pvt. Ltd.
Office No. 401-A, 4th Floor,
VANTAGE 9, S.No. 36/1/1,
Baner, Pune 411045 India

Gas Cylinders Market

Market Survey on Gas Cylinders Market Covering Sales Outlook, Up-to-date Key Trends, Market Size and Forecast, Supply and Demand Analysis, Production Capacity, Regulations, Trade Analysis, and Competitor Analysis by Primary and Secondary Packaging Manufacturers

An In-depth Market Insights of Gas Cylinders Market including Inert Gases,Flammable Gases,Toxic Gases,Pyrophoric Gases, and Oxidizers Covering 30+ Countries like United States, United Kingdom, Germany, France, Norway, Sweden, Saudi Arabia, United Arab Emirates, Japan, Korea, Australia, New Zealand, and Others

Request Sample

Gas Cylinders Market Outlook – 2022-2026

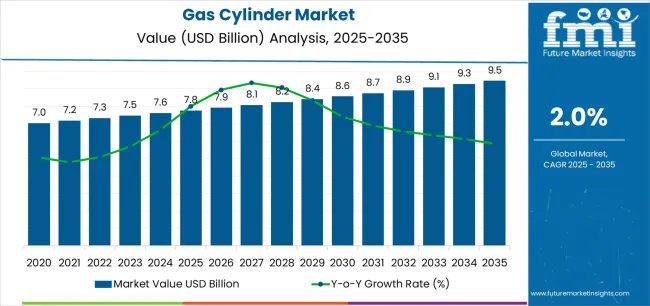
[170 Pages Report] Sales in the global gas cylinders market are slated to top US$ 8 Bn in 2022. Expanding at a healthy 8.2% CAGR, the market size is projected to total US$ 11 Bn by 2026.

Attribute

Details

Gas Cylinders Market Estimated Size 2022

US$ 8 Bn 

Gas Cylinders Market Value-based CAGR (2022-2026)

~8.2%

Gas Cylinders Market Size in Projected 2026

US$ 11 Bn

The increasing usage of gas cylinders for a wide range of applications, such as water treatment, soldering, dispensing beverages, medical uses, heating and cooking, and extinguishing fires is expected to bolster their demand across the globe.

Besides this, governments of various countries are implementing stringent norms to reduce the emissions from vehicles with combustion engines. Hence, the demand for cylinders is surging at a rapid pace as many people are purchasing natural gas vehicles globally.

The increasing focus of renowned manufacturers on the development of unique cylinder designs that are capable of improving safety measures, optimizing handling and storage abilities, and are lightweight is anticipated to drive the market.  

Don't pay for what you don't need

Customize your report by selecting specific countries or regions and save 30%!

How The Market Progressed Till June 2022?

Particulars

Details

H1 2021

7.9%

H1 2022 Projected

8.1%

H1 2022 Expected

7.8%

BPS Change - H1, 2022 (O) – H1, 2022 (P)

(+) 30 ↑

BPS Change – H1, 2022 (O) – H1, 2021

(-) 10 ↓

Future Market Insights predict a comparison and review analysis of the dynamics of the gas cylinders market, which is principally subjected to an array of industry factors along with a few definite influences concerning high cost of oxygen cylinders will hinder the market growth of gas cylinders.

Some new advances that have taken place in the market include the development of new type I cylinders with high corrosion resistance using powder coating technology.

The market for gas cylinders is expected to decline by 10 basis share points (BPS) in H1-2022 (O) against comparison with H1-2021, according to an FMI analysis. However, when comparing H1-2022 projected and H1-2022 outlook period, a rise in BPS change by 30 BPS has been noticed.

The key reason for this change in growth rate is due to increasing demand for oxygen cylinder due to increased prevalence of chronic bronchitis, emphysema, and chronic obstructive pulmonary disease (COPD) is expected to increase the demand for the gas cylinders.                                                                                                                                               

Despite these prospects, the increased use of gas cylinders in a variety of applications such as water treatment, soldering, beverage dispensing, medical purposes, heating and cooking, and fire extinguishing is expected to increase demand worldwide.

2012-2021 Gas Cylinders Market Outlook in Comparison to 2022-2026 Growth Forecast

The gas cylinders market is expected to register 8.2% CAGR between 2022 and 2026, up from 6.4% CAGR recorded during 2012-2021.

The high demand for gas cylinders for various industrial sectors, such as life support, transportation, automotive, and recreation industries is anticipated to spur the growth in this market. Numerous manufacturers are also striving to meet the stringent safety precautions by launching innovative products, such as smart cylinders. Some of the other companies are aiming to engage in collaborations to build new plants.

Gas Cylinders Market

In December 2021, for instance, the Nigerian Content Development and Monitoring Board (NCDMB) joined hands with Butane Energy Limited to develop LPG bottling plants in the Federal Capital Territory (FCT) and eight northern states. These new plants are expected to help in eliminating supply constraints in the domestic LPG sector. Such developments by major companies across the globe are likely to propel the market over the forthcoming years.

Gas cylinders are projected to be used in ventilating and heating applications as LPG is gradually replacing hydrofluorocarbon and chlorofluorocarbon as a refrigerant. It would thus help in minimizing the depletion of the ozone layer.

How is the Surging Number of Smokers Impacting the Gas Cylinders Market Growth?

The increasing demand for oxygen gas cylinders on the back of the surging prevalence of chronic bronchitis, emphysema, and Chronic Obstructive Pulmonary Disease (COPD) is anticipated to augment the demand in this market.

As per the World Health Organization (WHO), in 2019, COPD resulted in around 3.23 million deaths across the globe. Also, it is considered to be the third-leading cause of death. This shows that the number of COPD cases in various parts of the globe is growing at a fast pace, which would propel the market.

The increasing exposure to dust particles and the rising number of smokers are set to fuel the market in the upcoming years. Inhalation of dust particles often results in the inflammation of the bronchitis or trachea with the consistent disposal of these particles in the airways.

Similarly, cigarette smoke emits various chemicals that can damage the cells or tissues once these are absorbed by the lungs. Therefore, the cases of respiratory diseases are anticipated to rise, which would impact the market positively.

Ismail Sutaria
Ismail Sutaria
Principal Consultant
LinkedIn
Talk to Analyst

Find your sweet spots for generating winning opportunities in this market.

Country-wise Insights

What are the Drivers of the India Gas Cylinders Market?

India is anticipated to remain at the forefront in the market owing to the easy affordability of cooking cylinders. Asia Pacific excluding Japan gas cylinders market is set to account for 32.6% of the share in 2022, says FMI.

Furthermore, the presence of government subsidies on LPG cylinders, increasing energy necessities, and availability of resources in abundance are estimated to accelerate the growth in India. In December 2021, for instance, the Pradhan Mantri Ujjwala Yojana (PMUY) 2.0 that was recently introduced by Prime Minister Narendra Modi in Uttar Pradesh provided around 8.05 million domestic cooking gas connections. Such innovative steps taken by the Indian government are expected to drive the market.

How is the U.K. Gas Cylinders Market Faring?

The high demand for cylinders for commercial and residential applications in the U.K. is expected to propel the growth in this market. As per FMI, Europe gas cylinders market is anticipated to procure approximately 25.6% of the share in 2022.

Also, the U.K. government is striving to cut down emissions by implementing new policies to govern the usage of gases. In December 2021, for instance, the Climate Change Committee based in London, declared that the U.K. needs to fulfill its emission reduction commitments made at the Cop26 climate conference by increasing taxes on cooking and home heating gas. These norms put forward by regulatory bodies are set to bolster the demand in the country.

How is the High Geriatric Population Affecting the U.S. Gas Cylinders Market?

The rising geriatric population and the increasing cases of COVID-19 infections are likely to fuel the market in the U.S. North America gas cylinders market is expected to account for 21.9% of the share in 2022, mentions FMI.

According to the Rural Health Information Hub, at present, more than 46 million adults belonging to the age group of 65 years and above are living in the U.S. This number is expected to rise at a fast pace in the near future, thereby surging the prevalence of respiratory diseases and boosting the demand for medical oxygen gas cylinders.

Category-wise Insights

Why is the Demand for Type I Cylinders Growing at a Fast Pace?

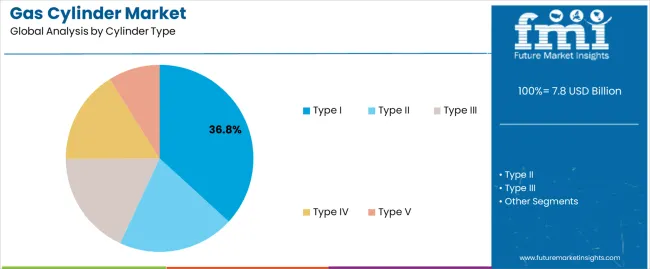
Based on cylinder type, the type I segment is expected to account for the largest share in the gas cylinders market in the upcoming years. This growth is attributable to the ongoing development of novel type I cylinders with powder coating technologies to make them highly resistant to corrosion.

Further, the demand for safe cylinders is surging at a rapid pace worldwide because of the high risks associated with the transportation of bulk gas. Type I cylinders are lightweight and have superior safety features, which make these suitable for fuel-efficient gas transportation, thereby reducing accidental gas leaks. Many companies are also applying advanced fabrication during the production of these cylinders to make these robust and gain a competitive edge.

Why is Aramid Fiber Wrap Type Leading the Gas Cylinders Market?

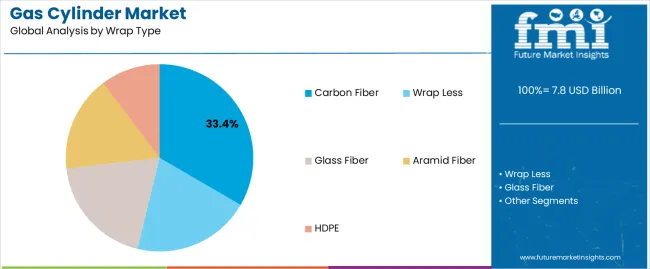
By wrap type, the aramid fiber segment is likely to remain at the forefront by registering a high revenue growth in the gas cylinders market in the forthcoming years. As aramid fibers possess high thermal stability, these are extensively used for wrapping the openings of cylinders.

In addition, aramid fibers are capable of resisting compression seismic and wind, shearing, and bend. These are also easy to shape and can provide good insulation and high strength. These have anti-corrosion and high tenacity properties.

Which is the Most Common Size of Gas Cylinders?

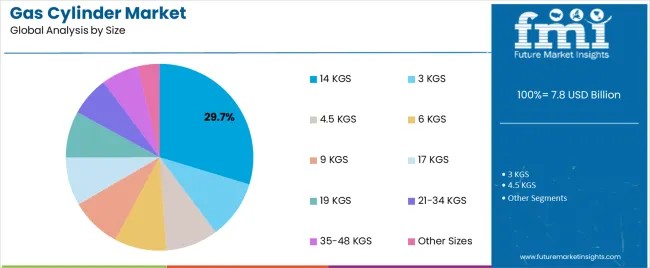
In terms of size, the 14 kgs segment is anticipated to account for the largest gas cylinders market share during the assessment period. Cylinders of this size are commonly used for cooking at homes. However, the sizes vary from country to country depending on the usage and government norms.

In Australia, for instance, a cooking gas cylinder weighs around 45 kgs and it lasts for about a year or more, whereas BBQ gas bottles are available in 4 kgs and 9 kgs. These cylinders are often used for camping. The storage capacity has a high influence on the safety regulations implemented for the production of cylinders.

Which Type of Gas is Expected to Be in High Demand?

Based on gas type, the flammable gases segment is set to hold the maximum revenue share in the gas cylinders market in the near future. The increasing usage of these gases, especially LPG for cooking across the globe is anticipated to propel the segment.

Moreover, the rising number of government initiatives in emerging economies to educate people about the benefits of using LPG by replacing traditional cooking fuels, such as coal, wood, and kerosene is anticipated to augment the growth of this segment. Additionally, unlike the conventional fuels, LPG is cost-effective, clean, portable, and non-toxic, which is projected to boost its demand.

Get the data you need at a Fraction of the cost

Personalize your report by choosing insights you need
and save 40%!

Competition Landscape

Various key players operating in the gas cylinders market are focusing on introducing novel products meant for the healthcare sector owing to the outbreak of the COVID-19 pandemic worldwide. Meanwhile, some of the other players, especially in developing countries, are aiming to launch smart cylinders to allow customers to check the level of gas present in the cylinders and make these lightweight.

For instance,

  • In July 2021, Indane, which is a subsidiary of Indian Oil Corporation, launched its latest smart gas cylinder named Composite Cylinder. It is considered to be safer, stronger, and lighter than the conventional cylinders. It would enable customers to check the amount of gas present in the cylinder as some parts of it are transparent. It contains a blow-mold HDPE inner liner fitted to the jacket outside. The liner is covered in a layer of polymer-wrapped fiberglass.
  • In October 2020, Luxfer Gas Cylinders, a leading manufacturer of lightweight, high-pressure type III composite cylinders headquartered in the U.S., introduced its first Non-Limited Life (NLL) medical cylinders. The company aims to help people with respiratory conditions with the rising cases of COVID-19 with this launch. The new cylinder has a long lifespan of more than 15-20 years and is destined for healthcare institutions.

Scope of Report

Attribute

Details

Forecast Period

2012-2021

Historical Data Available for

2022-2026

Market Analysis

Units for Volume and US$ Mn for Value

Key Regions Covered

North America, Latin America, Europe, Japan, Asia Pacific excluding Japan, and the Middle East and Africa.

Key Countries Covered

United States, Canada, Brazil, Mexico, Germany, UK, France, Italy, Spain, Nordic, Russia, Poland, China, India, Thailand, Indonesia, Australia and New Zealand, Japan, GCC countries, North Africa, South Africa, others.

Key Market Segments Covered

Cylinder Type, Wrap Type, Size, Gas Type, and Region

Key Companies Profiled

  • Avery Dennison Corporation
  • Thai KK
  • UPM-Raflatac
  • PMC LABEL
  • Fuji Seal International, Inc.
  • CCL Industries, Symbio, Inc.
  • 3M Company
  • S&K Label

Pricing

Available upon Request

Gas Cylinders Market by Category

By Cylinder Type:

  • Type I
  • Type II
  • Type III
  • Type IV
  • Type V

By Wrap Type:

  • Wrap Less
  • Glass Fiber
  • Aramid Fiber
  • Carbon Fiber
  • HDPE

By Size:

  • 3 kgs
  • 4.5 kgs
  • 6 kgs
  • 9 kgs
  • 14 kgs
  • 17 kgs
  • 19 kgs
  • 21-34 kgs
  • 35-48 kgs
  • Other Sizes

By Gas Type:

  • Inert Gases
  • Flammable Gases
  • Toxic Gases
  • Pyrophoric Gases
  • Oxidizers

By Region:

  • North America
  • Europe
  • Latin America
  • Asia Pacific excluding Japan
  • Japan
  • Middle East and Africa

Frequently Asked Questions

The gas cylinders market is estimated to capture a valuation of US$ 11.0 billion through 2026.

The gas cylinders market is anticipated to register a CAGR of 8.2% in 2033.

Asia Pacific is estimated to dominate the global market by securing a share of 32.6% in 2023.

The aramid fiber category is leading the gas cylinders market.

Launching smart, conventional, and lightweight cylinders become the default growth strategies of competitors.

Table of Content

1. Global Economic Outlook

2. Global Gas Cylinders Market - Executive Summary

3. Global Gas Cylinders Market Overview

    3.1. Introduction

        3.1.1. Global Gas Cylinders Market Taxonomy

        3.1.2. Global Gas Cylinders Market Definition

    3.2. Global Gas Cylinders Market Size (US$ Mn) and Forecast, 2022-2026

        3.2.1. Global Gas Cylinders Market Y-o-Y Growth

    3.3. Global Gas Cylinders Market Dynamics

    3.4. Supply Chain

    3.5. Cost Structure

    3.6. New Regulations in Oil & Gas Industry

    3.7. R&D Spending Per Country 2012-2017

    3.8. Geographical Expansion by Gas Cylinders Manufacturers

    3.9. Application Growth Matrix

    3.10. Investment Feasibility Matrix

    3.11. Product Life Cycle

    3.12. Porter’s Five Forces

    3.13. Key Participants Market Presence (Intensity Map) By Region

4. Global Gas Cylinders Market Analysis and Forecast 2022-2026 

    4.1. Global Gas Cylinders Market Size and Forecast By Cylinder Type, 2022-2026

        4.1.1. Type I Market Size and Forecast, 2022-2026

            4.1.1.1. Revenue (US$ Mn) Comparison, By Region

            4.1.1.2. Market Share Comparison, By Region

            4.1.1.3. Y-o-Y growth Comparison, By Region

        4.1.2. Type II Market Size and Forecast, 2022-2026

            4.1.2.1. Revenue (US$ Mn) Comparison, By Region

            4.1.2.2. Market Share Comparison, By Region

            4.1.2.3. Y-o-Y growth Comparison, By Region

        4.1.3. Type III Market Size and Forecast, 2022-2026

            4.1.3.1. Revenue (US$ Mn) Comparison, By Region

            4.1.3.2. Market Share Comparison, By Region

            4.1.3.3. Y-o-Y growth Comparison, By Region

        4.1.4. Type IV Market Size and Forecast, 2022-2026

            4.1.4.1. Revenue (US$ Mn) Comparison, By Region

            4.1.4.2. Market Share Comparison, By Region

            4.1.4.3. Y-o-Y growth Comparison, By Region

        4.1.5. Type V Market Size and Forecast, 2022-2026

            4.1.5.1. Revenue (US$ Mn) Comparison, By Region

            4.1.5.2. Market Share Comparison, By Region

            4.1.5.3. Y-o-Y growth Comparison, By Region

    4.2. Global Gas Cylinders Market Size and Forecast By Wrap Type, 2022-2026

        4.2.1. Wrap Less Market Size and Forecast, 2022-2026

            4.2.1.1. Revenue (US$ Mn) Comparison, By Region

            4.2.1.2. Market Share Comparison, By Region

            4.2.1.3. Y-o-Y growth Comparison, By Region

        4.2.2. Glass Fiber Market Size and Forecast, 2022-2026

            4.2.2.1. Revenue (US$ Mn) Comparison, By Region

            4.2.2.2. Market Share Comparison, By Region

            4.2.2.3. Y-o-Y growth Comparison, By Region

        4.2.3. Aramid Fiber Market Size and Forecast, 2022-2026

            4.2.3.1. Revenue (US$ Mn) Comparison, By Region

            4.2.3.2. Market Share Comparison, By Region

            4.2.3.3. Y-o-Y growth Comparison, By Region

        4.2.4. Carbon Fiber Market Size and Forecast, 2022-2026

            4.2.4.1. Revenue (US$ Mn) Comparison, By Region

            4.2.4.2. Market Share Comparison, By Region

            4.2.4.3. Y-o-Y growth Comparison, By Region

        4.2.5. HDPE Market Size and Forecast, 2022-2026

            4.2.5.1. Revenue (US$ Mn) Comparison, By Region

            4.2.5.2. Market Share Comparison, By Region

            4.2.5.3. Y-o-Y growth Comparison, By Region

    4.3. Global Gas Cylinders Market Size and Forecast By Size, 2022-2026

        4.3.1. 3 kgs Market Size and Forecast, 2022-2026

            4.3.1.1. Revenue (US$ Mn) Comparison, By Region

            4.3.1.2. Market Share Comparison, By Region

            4.3.1.3. Y-o-Y growth Comparison, By Region

        4.3.2. 4.5 kgs Market Size and Forecast, 2022-2026

            4.3.2.1. Revenue (US$ Mn) Comparison, By Region

            4.3.2.2. Market Share Comparison, By Region

            4.3.2.3. Y-o-Y growth Comparison, By Region

        4.3.3. 6 kgs Market Size and Forecast, 2022-2026

            4.3.3.1. Revenue (US$ Mn) Comparison, By Region

            4.3.3.2. Market Share Comparison, By Region

            4.3.3.3. Y-o-Y growth Comparison, By Region

        4.3.4. 9 kgs Market Size and Forecast, 2022-2026

            4.3.4.1. Revenue (US$ Mn) Comparison, By Region

            4.3.4.2. Market Share Comparison, By Region

            4.3.4.3. Y-o-Y growth Comparison, By Region

        4.3.5. 14 kgs Market Size and Forecast, 2022-2026

            4.3.5.1. Revenue (US$ Mn) Comparison, By Region

            4.3.5.2. Market Share Comparison, By Region

            4.3.5.3. Y-o-Y growth Comparison, By Region

        4.3.6. 17 kgs Market Size and Forecast, 2022-2026

            4.3.6.1. Revenue (US$ Mn) Comparison, By Region

            4.3.6.2. Market Share Comparison, By Region

            4.3.6.3. Y-o-Y growth Comparison, By Region

        4.3.7. 19 kgs Market Size and Forecast, 2022-2026

            4.3.7.1. Revenue (US$ Mn) Comparison, By Region

            4.3.7.2. Market Share Comparison, By Region

            4.3.7.3. Y-o-Y growth Comparison, By Region

        4.3.8. 21-34 kgs Market Size and Forecast, 2022-2026

            4.3.8.1. Revenue (US$ Mn) Comparison, By Region

            4.3.8.2. Market Share Comparison, By Region

            4.3.8.3. Y-o-Y growth Comparison, By Region

        4.3.9. 35-48 kgs Market Size and Forecast, 2022-2026

            4.3.9.1. Revenue (US$ Mn) Comparison, By Region

            4.3.9.2. Market Share Comparison, By Region

            4.3.9.3. Y-o-Y growth Comparison, By Region

        4.3.10. Other Sizes Market Size and Forecast, 2022-2026

            4.3.10.1. Revenue (US$ Mn) Comparison, By Region

            4.3.10.2. Market Share Comparison, By Region

            4.3.10.3. Y-o-Y growth Comparison, By Region

    4.4. Global Gas Cylinders Market Size and Forecast By Gas Types, 2022-2026

        4.4.1. Inert Gases Market Size and Forecast, 2022-2026

            4.4.1.1. Revenue (US$ Mn) Comparison, By Region

            4.4.1.2. Market Share Comparison, By Region

            4.4.1.3. Y-o-Y growth Comparison, By Region

        4.4.2. Flammable Gases Market Size and Forecast, 2022-2026

            4.4.2.1. Revenue (US$ Mn) Comparison, By Region

            4.4.2.2. Market Share Comparison, By Region

            4.4.2.3. Y-o-Y growth Comparison, By Region

        4.4.3. Pyrophoric Gases Market Size and Forecast, 2022-2026

            4.4.3.1. Revenue (US$ Mn) Comparison, By Region

            4.4.3.2. Market Share Comparison, By Region

            4.4.3.3. Y-o-Y growth Comparison, By Region

        4.4.4. Pyrophoric Gases Market Size and Forecast, 2022-2026

            4.4.4.1. Revenue (US$ Mn) Comparison, By Region

            4.4.4.2. Market Share Comparison, By Region

            4.4.4.3. Y-o-Y growth Comparison, By Region

        4.4.5. Oxidisers Market Size and Forecast, 2022-2026

            4.4.5.1. Revenue (US$ Mn) Comparison, By Region

            4.4.5.2. Market Share Comparison, By Region

            4.4.5.3. Y-o-Y growth Comparison, By Region

5. North America Gas Cylinders Market Size and Forecast, 2022-2026

    5.1. North America Outlook 

    5.2. North America Parent Market Outlook 

    5.3. North America Target Market Outlook 

    5.4. Revenue (US$ Mn) Comparison, By Country 

        5.4.1. US Market Size and Forecast (US$ Mn), 2022-2026

        5.4.2. Canada Market Size and Forecast (US$ Mn), 2022-2026

    5.5. Revenue (US$ Mn) Comparison, By Cylinder Type 

    5.6. Revenue (US$ Mn) Comparison, By Wrap Type 

    5.7. Revenue (US$ Mn) Comparison, By Size 

    5.8. Revenue (US$ Mn) Comparison, By Gas Types 

6. Latin America Gas Cylinders Market Size and Forecast, 2022-2026

    6.1. Latin America Outlook 

    6.2. Latin America Parent Market Outlook 

    6.3. Latin America Target Market Outlook 

    6.4. Revenue (US$ Mn) Comparison, By Country 

        6.4.1. Brazil Market Size and Forecast (US$ Mn), 2022-2026

        6.4.2. Mexico Market Size and Forecast (US$ Mn), 2022-2026

        6.4.3. Argentina Market Size and Forecast (US$ Mn), 2022-2026

        6.4.4. Rest of Latin America Market Size and Forecast (US$ Mn), 2022-2026

    6.5. Revenue (US$ Mn) Comparison, By Cylinder Type 

    6.6. Revenue (US$ Mn) Comparison, By Wrap Type 

    6.7. Revenue (US$ Mn) Comparison, By Size 

    6.8. Revenue (US$ Mn) Comparison, By Gas Types 

7. Europe Gas Cylinders Market Size and Forecast, 2022-2026

    7.1. Europe Outlook 

    7.2. Europe Parent Market Outlook 

    7.3. Europe Target Market Outlook 

    7.4. Revenue (US$ Mn) Comparison, By Country 

        7.4.1. Germany Market Size and Forecast (US$ Mn), 2022-2026

        7.4.2. UK Market Size and Forecast (US$ Mn), 2022-2026

        7.4.3. France Market Size and Forecast (US$ Mn), 2022-2026

        7.4.4. Spain Market Size and Forecast (US$ Mn), 2022-2026

        7.4.5. Italy Market Size and Forecast (US$ Mn), 2022-2026

        7.4.6. Rest of Europe Market Size and Forecast (US$ Mn), 2022-2026

    7.5. Revenue (US$ Mn) Comparison, By Cylinder Type 

    7.6. Revenue (US$ Mn) Comparison, By Wrap Type 

    7.7. Revenue (US$ Mn) Comparison, By Size 

    7.8. Revenue (US$ Mn) Comparison, By Gas Types 

8. Japan Gas Cylinders Market Size and Forecast, 2022-2026

    8.1. Japan Outlook 

    8.2. Japan Parent Market Outlook 

    8.3. Japan Target Market Outlook 

    8.4. Japan  Market Size and Forecast (US$ Mn), 2022-2026

    8.5. Revenue (US$ Mn) Comparison, By Cylinder Type 

    8.6. Revenue (US$ Mn) Comparison, By Wrap Type 

    8.7. Revenue (US$ Mn) Comparison, By Size 

    8.8. Revenue (US$ Mn) Comparison, By Gas Types 

9. APEJ Gas Cylinders Market Size and Forecast, 2022-2026

    9.1. APEJ Outlook 

    9.2. APEJ Parent Market Outlook 

    9.3. APEJ Target Market Outlook 

    9.4. Revenue (US$ Mn) Comparison, By Country 

        9.4.1. China Market Size and Forecast (US$ Mn), 2022-2026

        9.4.2. India Market Size and Forecast (US$ Mn), 2022-2026

        9.4.3. Thailand Market Size and Forecast (US$ Mn), 2022-2026

        9.4.4. Singapore Market Size and Forecast (US$ Mn), 2022-2026

        9.4.5. Australia & New Zealand Market Size and Forecast (US$ Mn), 2022-2026

        9.4.6. Rest of APEJ Market Size and Forecast (US$ Mn), 2022-2026

    9.5. Revenue (US$ Mn) Comparison, By Cylinder Type 

    9.6. Revenue (US$ Mn) Comparison, By Wrap Type 

    9.7. Revenue (US$ Mn) Comparison, By Size 

    9.8. Revenue (US$ Mn) Comparison, By Gas Types 

10. MEA Gas Cylinders Market Size and Forecast, 2022-2026

    10.1. MEA Outlook 

    10.2. MEA Parent Market Outlook 

    10.3. MEA Target Market Outlook 

    10.4. Revenue (US$ Mn) Comparison, By Country 

        10.4.1. GCC Countries Market Size and Forecast (US$ Mn), 2022-2026

        10.4.2. South Africa Market Size and Forecast (US$ Mn), 2022-2026

        10.4.3. Nigeria Market Size and Forecast (US$ Mn), 2022-2026

        10.4.4. Rest of MEA Market Size and Forecast (US$ Mn), 2022-2026

    10.5. Revenue (US$ Mn) Comparison, By Cylinder Type 

    10.6. Revenue (US$ Mn) Comparison, By Wrap Type 

    10.7. Revenue (US$ Mn) Comparison, By Size 

    10.8. Revenue (US$ Mn) Comparison, By Gas Types 

11. Global Gas Cylinders Market Company Share, Competition Landscape and Company Profiles

    11.1. ompany Profiles

        11.1.1. Lintec Corporation Company Share Analysis

    11.2. Competition Landscape

    11.3. C

        11.3.1. Avery Dennison Corporation

        11.3.2. Thai KK 

        11.3.3. UPM-Raflatac

        11.3.4. PMC LABEL

        11.3.5. Fuji Seal International, Inc.

        11.3.6. CCL Industries

        11.3.7. Symbio, Inc.

        11.3.8. 3M Company

        11.3.9. S&K Label

        11.3.10. Others

12. Global Gas Cylinders Market – Key Takeaways

13. Research Methodology

14. Disclaimer

Don't pay for what you don't need

Customize your report by selecting specific countries or regions and save 30%!

List of Tables

TABLE 1 Global Gas Cylinders Market Value (US$ Mn), 2012-2021

TABLE 2 Global Gas Cylinders Market Value (US$ Mn), 2022-2026

TABLE 3 Global Gas Cylinders Market Value (US$ Mn) and Y-o-Y, 2021-2026

TABLE 4 Global Type I Segment Value (US$ Mn), By Region 2012-2021

TABLE 5 Global Type I Segment Value (US$ Mn), By Region 2022-2026

TABLE 6 Global Type I Segment Market Share, By Region 2012-2021

TABLE 7 Global Type I Segment Market Share, By Region 2022-2026

TABLE 8 Global Type I Segment Y-o-Y, By Region 2021-2026

TABLE 9 Global Type II Segment Value (US$ Mn), By Region 2012-2021

TABLE 10 Global Type II Segment Value (US$ Mn), By Region 2022-2026

TABLE 11 Global Type II Segment Market Share, By Region 2012-2021

TABLE 12 Global Type II Segment Market Share, By Region 2022-2026

TABLE 13 Global Type II Segment Y-o-Y, By Region 2021-2026

TABLE 14 Global Type III Segment Value (US$ Mn), By Region 2012-2021

TABLE 15 Global Type III Segment Value (US$ Mn), By Region 2022-2026

TABLE 16 Global Type III Segment Market Share, By Region 2012-2021

TABLE 17 Global Type III Segment Market Share, By Region 2022-2026

TABLE 18 Global Type III Segment Y-o-Y, By Region 2021-2026

TABLE 19 Global Type IV Segment Value (US$ Mn), By Region 2012-2021

TABLE 20 Global Type IV Segment Value (US$ Mn), By Region 2022-2026

TABLE 21 Global Type IV Segment Market Share, By Region 2012-2021

TABLE 22 Global Type IV Segment Market Share, By Region 2022-2026

TABLE 23 Global Type IV Segment Y-o-Y, By Region 2021-2026

TABLE 24 Global Type V Segment Value (US$ Mn), By Region 2012-2021

TABLE 25 Global Type V Segment Value (US$ Mn), By Region 2022-2026

TABLE 26 Global Type V Segment Market Share, By Region 2012-2021

TABLE 27 Global Type V Segment Market Share, By Region 2022-2026

TABLE 28 Global Type V Segment Y-o-Y, By Region 2021-2026

TABLE 29 Global Wrap Less Segment Value (US$ Mn), By Region 2012-2021

TABLE 30 Global Wrap Less Segment Value (US$ Mn), By Region 2022-2026

TABLE 31 Global Wrap Less Segment Market Share, By Region 2012-2021

TABLE 32 Global Wrap Less Segment Market Share, By Region 2022-2026

TABLE 33 Global Wrap Less Segment Y-o-Y, By Region 2021-2026

TABLE 34 Global Glass Fiber Segment Value (US$ Mn), By Region 2012-2021

TABLE 35 Global Glass Fiber Segment Value (US$ Mn), By Region 2022-2026

TABLE 36 Global Glass Fiber Segment Market Share, By Region 2012-2021

TABLE 37 Global Glass Fiber Segment Market Share, By Region 2022-2026

TABLE 38 Global Glass Fiber Segment Y-o-Y, By Region 2021-2026

TABLE 39 Global Aramid Fiber Segment Value (US$ Mn), By Region 2012-2021

TABLE 40 Global Aramid Fiber Segment Value (US$ Mn), By Region 2022-2026

TABLE 41 Global Aramid Fiber Segment Market Share, By Region 2012-2021

TABLE 42 Global Aramid Fiber Segment Market Share, By Region 2022-2026

TABLE 43 Global Aramid Fiber Segment Y-o-Y, By Region 2021-2026

TABLE 44 Global Carbon Fiber Segment Value (US$ Mn), By Region 2012-2021

TABLE 45 Global Carbon Fiber Segment Value (US$ Mn), By Region 2022-2026

TABLE 46 Global Carbon Fiber Segment Market Share, By Region 2012-2021

TABLE 47 Global Carbon Fiber Segment Market Share, By Region 2022-2026

TABLE 48 Global Carbon Fiber Segment Y-o-Y, By Region 2021-2026

TABLE 49 Global HDPE Segment Value (US$ Mn), By Region 2012-2021

TABLE 50 Global HDPE Segment Value (US$ Mn), By Region 2022-2026

TABLE 51 Global HDPE Segment Market Share, By Region 2012-2021

TABLE 52 Global HDPE Segment Market Share, By Region 2022-2026

TABLE 53 Global HDPE Segment Y-o-Y, By Region 2021-2026

TABLE 54 Global 3 kgs Segment Value (US$ Mn), By Region 2012-2021

TABLE 55 Global 3 kgs Segment Value (US$ Mn), By Region 2022-2026

TABLE 56 Global 3 kgs Segment Market Share, By Region 2012-2021

TABLE 57 Global 3 kgs Segment Market Share, By Region 2022-2026

TABLE 58 Global 3 kgs Segment Y-o-Y, By Region 2021-2026

TABLE 59 Global 4.5 kgs Segment Value (US$ Mn), By Region 2012-2021

TABLE 60 Global 4.5 kgs Segment Value (US$ Mn), By Region 2022-2026

TABLE 61 Global 4.5 kgs Segment Market Share, By Region 2012-2021

TABLE 62 Global 4.5 kgs Segment Market Share, By Region 2022-2026

TABLE 63 Global 4.5 kgs Segment Y-o-Y, By Region 2021-2026

TABLE 64 Global 6 kgs Segment Value (US$ Mn), By Region 2012-2021

TABLE 65 Global 6 kgs Segment Value (US$ Mn), By Region 2022-2026

TABLE 66 Global 6 kgs Segment Market Share, By Region 2012-2021

TABLE 67 Global 6 kgs Segment Market Share, By Region 2022-2026

TABLE 68 Global 6 kgs Segment Y-o-Y, By Region 2021-2026

TABLE 69 Global 9 kgs Segment Value (US$ Mn), By Region 2012-2021

TABLE 70 Global 9 kgs Segment Value (US$ Mn), By Region 2022-2026

TABLE 71 Global 9 kgs Segment Market Share, By Region 2012-2021

TABLE 72 Global 9 kgs Segment Market Share, By Region 2022-2026

TABLE 73 Global 9 kgs Segment Y-o-Y, By Region 2021-2026

TABLE 74 Global 14 kgs Segment Value (US$ Mn), By Region 2012-2021

TABLE 75 Global 14 kgs Segment Value (US$ Mn), By Region 2022-2026

TABLE 76 Global 14 kgs Segment Market Share, By Region 2012-2021

TABLE 77 Global 14 kgs Segment Market Share, By Region 2022-2026

TABLE 78 Global 14 kgs Segment Y-o-Y, By Region 2021-2026

TABLE 79 Global 17 kgs Segment Value (US$ Mn), By Region 2012-2021

TABLE 80 Global 17 kgs Segment Value (US$ Mn), By Region 2022-2026

TABLE 81 Global 17 kgs Segment Market Share, By Region 2012-2021

TABLE 82 Global 17 kgs Segment Market Share, By Region 2022-2026

TABLE 83 Global 17 kgs Segment Y-o-Y, By Region 2021-2026

TABLE 84 Global 19 kgs Segment Value (US$ Mn), By Region 2012-2021

TABLE 85 Global 19 kgs Segment Value (US$ Mn), By Region 2022-2026

TABLE 86 Global 19 kgs Segment Market Share, By Region 2012-2021

TABLE 87 Global 19 kgs Segment Market Share, By Region 2022-2026

TABLE 88 Global 19 kgs Segment Y-o-Y, By Region 2021-2026

TABLE 89 Global 21-34 kgs Segment Value (US$ Mn), By Region 2012-2021

TABLE 90 Global 21-34 kgs Segment Value (US$ Mn), By Region 2022-2026

TABLE 91 Global 21-34 kgs Segment Market Share, By Region 2012-2021

TABLE 92 Global 21-34 kgs Segment Market Share, By Region 2022-2026

TABLE 93 Global 21-34 kgs Segment Y-o-Y, By Region 2021-2026

TABLE 94 Global 35-48 kgs Segment Value (US$ Mn), By Region 2012-2021

TABLE 95 Global 35-48 kgs Segment Value (US$ Mn), By Region 2022-2026

TABLE 96 Global 35-48 kgs Segment Market Share, By Region 2012-2021

TABLE 97 Global 35-48 kgs Segment Market Share, By Region 2022-2026

TABLE 98 Global 35-48 kgs Segment Y-o-Y, By Region 2021-2026

TABLE 99 Global Other Sizes Segment Value (US$ Mn), By Region 2012-2021

TABLE 100 Global Other Sizes Segment Value (US$ Mn), By Region 2022-2026

TABLE 101 Global Other Sizes Segment Market Share, By Region 2012-2021

TABLE 102 Global Other Sizes Segment Market Share, By Region 2022-2026

TABLE 103 Global Other Sizes Segment Y-o-Y, By Region 2021-2026

TABLE 104 Global Inert Gases Segment Value (US$ Mn), By Region 2012-2021

TABLE 105 Global Inert Gases Segment Value (US$ Mn), By Region 2022-2026

TABLE 106 Global Inert Gases Segment Market Share, By Region 2012-2021

TABLE 107 Global Inert Gases Segment Market Share, By Region 2022-2026

TABLE 108 Global Inert Gases Segment Y-o-Y, By Region 2021-2026

TABLE 109 Global Flammable Gases Segment Value (US$ Mn), By Region 2012-2021

TABLE 110 Global Flammable Gases Segment Value (US$ Mn), By Region 2022-2026

TABLE 111 Global Flammable Gases Segment Market Share, By Region 2012-2021

TABLE 112 Global Flammable Gases Segment Market Share, By Region 2022-2026

TABLE 113 Global Flammable Gases Segment Y-o-Y, By Region 2021-2026

TABLE 114 Global Toxic Gases Segment Value (US$ Mn), By Region 2012-2021

TABLE 115 Global Toxic Gases Segment Value (US$ Mn), By Region 2022-2026

TABLE 116 Global Toxic Gases Segment Market Share, By Region 2012-2021

TABLE 117 Global Toxic Gases Segment Market Share, By Region 2022-2026

TABLE 118 Global Toxic Gases Segment Y-o-Y, By Region 2021-2026

TABLE 119 Global Pyrophoric Gases Segment Value (US$ Mn), By Region 2012-2021

TABLE 120 Global Pyrophoric Gases Segment Value (US$ Mn), By Region 2022-2026

TABLE 121 Global Pyrophoric Gases Segment Market Share, By Region 2012-2021

TABLE 122 Global Pyrophoric Gases Segment Market Share, By Region 2022-2026

TABLE 123 Global Pyrophoric Gases Segment Y-o-Y, By Region 2021-2026

TABLE 124 Global Oxidisers Segment Value (US$ Mn), By Region 2012-2021

TABLE 125 Global Oxidisers Segment Value (US$ Mn), By Region 2022-2026

TABLE 126 Global Oxidisers Segment Market Share, By Region 2012-2021

TABLE 127 Global Oxidisers Segment Market Share, By Region 2022-2026

TABLE 128 Global Oxidisers Segment Y-o-Y, By Region 2021-2026

TABLE 129 North America Gas Cylinders Market Value (US$ Mn), By Country 2012-2021

TABLE 130 North America Gas Cylinders Market Value (US$ Mn), By Country 2022-2026

TABLE 131 North America Gas Cylinders Market Value (US$ Mn), By Cylinder Type 2012-2021

TABLE 132 North America Gas Cylinders Market Value (US$ Mn), By Cylinder Type 2022-2026

TABLE 133 North America Gas Cylinders Market Value (US$ Mn), By Wrap Type 2012-2021

TABLE 134 North America Gas Cylinders Market Value (US$ Mn), By Wrap Type 2022-2026

TABLE 135 North America Gas Cylinders Market Value (US$ Mn), By Size 2012-2021

TABLE 136 North America Gas Cylinders Market Value (US$ Mn), By Size 2022-2026

TABLE 137 North America Gas Cylinders Market Value (US$ Mn), By Gas Types 2012-2021

TABLE 138 North America Gas Cylinders Market Value (US$ Mn), By Gas Types 2022-2026

TABLE 139 Latin America Gas Cylinders Market Value (US$ Mn), By Country 2012-2021

TABLE 140 Latin America Gas Cylinders Market Value (US$ Mn), By Country 2022-2026

TABLE 141 Latin America Gas Cylinders Market Value (US$ Mn), By Cylinder Type 2012-2021

TABLE 142 Latin America Gas Cylinders Market Value (US$ Mn), By Cylinder Type 2022-2026

TABLE 143 Latin America Gas Cylinders Market Value (US$ Mn), By Wrap Type 2012-2021

TABLE 144 Latin America Gas Cylinders Market Value (US$ Mn), By Wrap Type 2022-2026

TABLE 145 Latin America Gas Cylinders Market Value (US$ Mn), By Size 2012-2021

TABLE 146 Latin America Gas Cylinders Market Value (US$ Mn), By Size 2022-2026

TABLE 147 Latin America Gas Cylinders Market Value (US$ Mn), By Gas Types 2012-2021

TABLE 148 Latin America Gas Cylinders Market Value (US$ Mn), By Gas Types 2022-2026

TABLE 149 Europe Gas Cylinders Market Value (US$ Mn), By Country 2012-2021

TABLE 150 Europe Gas Cylinders Market Value (US$ Mn), By Country 2022-2026

TABLE 151 Europe Gas Cylinders Market Value (US$ Mn), By Cylinder Type 2012-2021

TABLE 152 Europe Gas Cylinders Market Value (US$ Mn), By Cylinder Type 2022-2026

TABLE 153 Europe Gas Cylinders Market Value (US$ Mn), By Wrap Type 2012-2021

TABLE 154 Europe Gas Cylinders Market Value (US$ Mn), By Wrap Type 2022-2026

TABLE 155 Europe Gas Cylinders Market Value (US$ Mn), By Size 2012-2021

TABLE 156 Europe Gas Cylinders Market Value (US$ Mn), By Size 2022-2026

TABLE 157 Europe Gas Cylinders Market Value (US$ Mn), By Gas Types 2012-2021

TABLE 158 Europe Gas Cylinders Market Value (US$ Mn), By Gas Types 2022-2026

TABLE 159 Japan Gas Cylinders Market Value (US$ Mn), By Country 2012-2021

TABLE 160 Japan Gas Cylinders Market Value (US$ Mn), By Country 2022-2026

TABLE 161 Japan Gas Cylinders Market Value (US$ Mn), By Cylinder Type 2012-2021

TABLE 162 Japan Gas Cylinders Market Value (US$ Mn), By Cylinder Type 2022-2026

TABLE 163 Japan Gas Cylinders Market Value (US$ Mn), By Wrap Type 2012-2021

TABLE 164 Japan Gas Cylinders Market Value (US$ Mn), By Wrap Type 2022-2026

TABLE 165 Japan Gas Cylinders Market Value (US$ Mn), By Size 2012-2021

TABLE 166 Japan Gas Cylinders Market Value (US$ Mn), By Size 2022-2026

TABLE 167 Japan Gas Cylinders Market Value (US$ Mn), By Gas Types 2012-2021

TABLE 168 Japan Gas Cylinders Market Value (US$ Mn), By Gas Types 2022-2026

TABLE 169 APEJ Gas Cylinders Market Value (US$ Mn), By Country 2012-2021

TABLE 170 APEJ Gas Cylinders Market Value (US$ Mn), By Country 2022-2026

TABLE 171 APEJ Gas Cylinders Market Value (US$ Mn), By Cylinder Type 2012-2021

TABLE 172 APEJ Gas Cylinders Market Value (US$ Mn), By Cylinder Type 2022-2026

TABLE 173 APEJ Gas Cylinders Market Value (US$ Mn), By Wrap Type 2012-2021

TABLE 174 APEJ Gas Cylinders Market Value (US$ Mn), By Wrap Type 2022-2026

TABLE 175 APEJ Gas Cylinders Market Value (US$ Mn), By Size 2012-2021

TABLE 176 APEJ Gas Cylinders Market Value (US$ Mn), By Size 2022-2026

TABLE 177 APEJ Gas Cylinders Market Value (US$ Mn), By Gas Types 2012-2021

TABLE 178 APEJ Gas Cylinders Market Value (US$ Mn), By Gas Types 2022-2026

TABLE 179 MEA Gas Cylinders Market Value (US$ Mn), By Country 2012-2021

TABLE 180 MEA Gas Cylinders Market Value (US$ Mn), By Country 2022-2026

TABLE 181 MEA Gas Cylinders Market Value (US$ Mn), By Cylinder Type 2012-2021

TABLE 182 MEA Gas Cylinders Market Value (US$ Mn), By Cylinder Type 2022-2026

TABLE 183 MEA Gas Cylinders Market Value (US$ Mn), By Wrap Type 2012-2021

TABLE 184 MEA Gas Cylinders Market Value (US$ Mn), By Wrap Type 2022-2026

TABLE 185 MEA Gas Cylinders Market Value (US$ Mn), By Size 2012-2021

TABLE 186 MEA Gas Cylinders Market Value (US$ Mn), By Size 2022-2026

TABLE 187 MEA Gas Cylinders Market Value (US$ Mn), By Gas Types 2012-2021

TABLE 188 MEA Gas Cylinders Market Value (US$ Mn), By Gas Types 2022-2026
Ismail Sutaria
Ismail Sutaria
Principal Consultant
LinkedIn
Talk to Analyst

Find your sweet spots for generating winning opportunities in this market.

List of Charts

FIG. 1 Global Gas Cylinders Market Value (US$ Mn), 2012-2021

FIG. 2 Global Gas Cylinders Market Value (US$ Mn) Forecast, 2022-2026

FIG. 3 Global Gas Cylinders Market Value (US$ Mn) and Y-o-Y, 2021-2026

FIG. 4 Global Type I Segment Market Value (US$ Mn) By Region, 2012-2021

FIG. 5 Global Type I Segment Market Value (US$ Mn) By Region, 2022-2026

FIG. 6 Global Type I Segment Y-o-Y Growth Rate, By Region, 2021-2026

FIG. 7 Global Type II Segment Market Value (US$ Mn) By Region, 2012-2021

FIG. 8 Global Type II Segment Market Value (US$ Mn) By Region, 2022-2026

FIG. 9 Global Type II Segment Y-o-Y Growth Rate, By Region, 2021-2026

FIG. 10 Global Type III Segment Market Value (US$ Mn) By Region, 2012-2021

FIG. 11 Global Type III Segment Market Value (US$ Mn) By Region, 2022-2026

FIG. 12 Global Type III Segment Y-o-Y Growth Rate, By Region, 2021-2026

FIG. 13 Global Type IV Segment Market Value (US$ Mn) By Region, 2012-2021

FIG. 14 Global Type IV Segment Market Value (US$ Mn) By Region, 2022-2026

FIG. 15 Global Type IV Segment Y-o-Y Growth Rate, By Region, 2021-2026

FIG. 16 Global Type V Segment Market Value (US$ Mn) By Region, 2012-2021

FIG. 17 Global Type V Segment Market Value (US$ Mn) By Region, 2022-2026

FIG. 18 Global Type V Segment Y-o-Y Growth Rate, By Region, 2021-2026

FIG. 19 Global Wrap Less Segment Market Value (US$ Mn) By Region, 2012-2021

FIG. 20 Global Wrap Less Segment Market Value (US$ Mn) By Region, 2022-2026

FIG. 21 Global Wrap Less Segment Y-o-Y Growth Rate, By Region, 2021-2026

FIG. 22 Global Glass Fiber Segment Market Value (US$ Mn) By Region, 2012-2021

FIG. 23 Global Glass Fiber Segment Market Value (US$ Mn) By Region, 2022-2026

FIG. 24 Global Glass Fiber Segment Y-o-Y Growth Rate, By Region, 2021-2026

FIG. 25 Global Aramid Fiber Segment Market Value (US$ Mn) By Region, 2012-2021

FIG. 26 Global Aramid Fiber Segment Market Value (US$ Mn) By Region, 2022-2026

FIG. 27 Global Aramid Fiber Segment Y-o-Y Growth Rate, By Region, 2021-2026

FIG. 28 Global Carbon Fiber Segment Market Value (US$ Mn) By Region, 2012-2021

FIG. 29 Global Carbon Fiber Segment Market Value (US$ Mn) By Region, 2022-2026

FIG. 30 Global Carbon Fiber Segment Y-o-Y Growth Rate, By Region, 2021-2026

FIG. 31 Global HDPE Segment Market Value (US$ Mn) By Region, 2012-2021

FIG. 32 Global HDPE Segment Market Value (US$ Mn) By Region, 2022-2026

FIG. 33 Global HDPE Segment Y-o-Y Growth Rate, By Region, 2021-2026

FIG. 34 Global 3 kgs Segment Market Value (US$ Mn) By Region, 2012-2021

FIG. 35 Global 3 kgs Segment Market Value (US$ Mn) By Region, 2022-2026

FIG. 36 Global 3 kgs Segment Y-o-Y Growth Rate, By Region, 2021-2026

FIG. 37 Global 4.5 kgs Segment Market Value (US$ Mn) By Region, 2012-2021

FIG. 38 Global 4.5 kgs Segment Market Value (US$ Mn) By Region, 2022-2026

FIG. 39 Global 4.5 kgs Segment Y-o-Y Growth Rate, By Region, 2021-2026

FIG. 40 Global 6 kgs Segment Market Value (US$ Mn) By Region, 2012-2021

FIG. 41 Global 6 kgs Segment Market Value (US$ Mn) By Region, 2022-2026

FIG. 42 Global 6 kgs Segment Y-o-Y Growth Rate, By Region, 2021-2026

FIG. 43 Global 9 kgs Segment Market Value (US$ Mn) By Region, 2012-2021

FIG. 44 Global 9 kgs Segment Market Value (US$ Mn) By Region, 2022-2026

FIG. 45 Global 9 kgs Segment Y-o-Y Growth Rate, By Region, 2021-2026

FIG. 46 Global 14 kgs Segment Market Value (US$ Mn) By Region, 2012-2021

FIG. 47 Global 14 kgs Segment Market Value (US$ Mn) By Region, 2022-2026

FIG. 48 Global 14 kgs Segment Y-o-Y Growth Rate, By Region, 2021-2026

FIG. 49 Global 17 kgs Segment Market Value (US$ Mn) By Region, 2012-2021

FIG. 50 Global 17 kgs Segment Market Value (US$ Mn) By Region, 2022-2026

FIG. 51 Global 17 kgs Segment Y-o-Y Growth Rate, By Region, 2021-2026

FIG. 52 Global 19 kgs Segment Market Value (US$ Mn) By Region, 2012-2021

FIG. 53 Global 19 kgs Segment Market Value (US$ Mn) By Region, 2022-2026

FIG. 54 Global 19 kgs Segment Y-o-Y Growth Rate, By Region, 2021-2026

FIG. 55 Global 21-34 kgs Segment Market Value (US$ Mn) By Region, 2012-2021

FIG. 56 Global 21-34 kgs Segment Market Value (US$ Mn) By Region, 2022-2026

FIG. 57 Global 21-34 kgs Segment Y-o-Y Growth Rate, By Region, 2021-2026

FIG. 58 Global 35-48 kgs Segment Market Value (US$ Mn) By Region, 2012-2021

FIG. 59 Global 35-48 kgs Segment Market Value (US$ Mn) By Region, 2022-2026

FIG. 60 Global 35-48 kgs Segment Y-o-Y Growth Rate, By Region, 2021-2026

FIG. 61 Global Other Sizes Segment Market Value (US$ Mn) By Region, 2012-2021

FIG. 62 Global Other Sizes Segment Market Value (US$ Mn) By Region, 2022-2026

FIG. 63 Global Other Sizes Segment Y-o-Y Growth Rate, By Region, 2021-2026

FIG. 64 Global Inert Gases Segment Market Value (US$ Mn) By Region, 2012-2021

FIG. 65 Global Inert Gases Segment Market Value (US$ Mn) By Region, 2022-2026

FIG. 66 Global Inert Gases Segment Y-o-Y Growth Rate, By Region, 2021-2026

FIG. 67 Global Flammable Gases Segment Market Value (US$ Mn) By Region, 2012-2021

FIG. 68 Global Flammable Gases Segment Market Value (US$ Mn) By Region, 2022-2026

FIG. 69 Global Flammable Gases Segment Y-o-Y Growth Rate, By Region, 2021-2026

FIG. 70 Global Toxic Gases Segment Market Value (US$ Mn) By Region, 2012-2021

FIG. 71 Global Toxic Gases Segment Market Value (US$ Mn) By Region, 2022-2026

FIG. 72 Global Toxic Gases Segment Y-o-Y Growth Rate, By Region, 2021-2026

FIG. 73 Global Pyrophoric Gases Segment Market Value (US$ Mn) By Region, 2012-2021

FIG. 74 Global Pyrophoric Gases Segment Market Value (US$ Mn) By Region, 2022-2026

FIG. 75 Global Pyrophoric Gases Segment Y-o-Y Growth Rate, By Region, 2021-2026

FIG. 76 Global Oxidizers Segment Market Value (US$ Mn) By Region, 2012-2021

FIG. 77 Global Oxidizers Segment Market Value (US$ Mn) By Region, 2022-2026

FIG. 78 Global Oxidizers Segment Y-o-Y Growth Rate, By Region, 2021-2026

FIG. 79 North America Gas Cylinders Market Value (US$ Mn), By Country 2012-2021

FIG. 80 North America Gas Cylinders Market Value (US$ Mn), By Country 2022-2026

FIG. 81 North America Gas Cylinders Market Value (US$ Mn), By Cylinder Type 2012-2021

FIG. 82 North America Gas Cylinders Market Value (US$ Mn), By Cylinder Type 2022-2026

FIG. 83 North America Gas Cylinders Market Value (US$ Mn), By Wrap Type 2012-2021

FIG. 84 North America Gas Cylinders Market Value (US$ Mn), By Wrap Type 2022-2026

FIG. 85 North America Gas Cylinders Market Value (US$ Mn), By Size 2012-2021

FIG. 86 North America Gas Cylinders Market Value (US$ Mn), By Size 2022-2026

FIG. 87 North America Gas Cylinders Market Value (US$ Mn), By Gas Types 2012-2021

FIG. 88 North America Gas Cylinders Market Value (US$ Mn), By Gas Types 2022-2026

FIG. 89 Latin America Gas Cylinders Market Value (US$ Mn), By Country 2012-2021

FIG. 90 Latin America Gas Cylinders Market Value (US$ Mn), By Country 2022-2026

FIG. 91 Latin America Gas Cylinders Market Value (US$ Mn), By Cylinder Type 2012-2021

FIG. 92 Latin America Gas Cylinders Market Value (US$ Mn), By Cylinder Type 2022-2026

FIG. 93 Latin America Gas Cylinders Market Value (US$ Mn), By Wrap Type 2012-2021

FIG. 94 Latin America Gas Cylinders Market Value (US$ Mn), By Wrap Type 2022-2026

FIG. 95 Latin America Gas Cylinders Market Value (US$ Mn), By Size 2012-2021

FIG. 96 Latin America Gas Cylinders Market Value (US$ Mn), By Size 2022-2026

FIG. 97 Latin America Gas Cylinders Market Value (US$ Mn), By Gas Types 2012-2021

FIG. 98 Latin America Gas Cylinders Market Value (US$ Mn), By Gas Types 2022-2026

FIG. 99 Europe Gas Cylinders Market Value (US$ Mn), By Country 2012-2021

FIG. 100 Europe Gas Cylinders Market Value (US$ Mn), By Country 2022-2026

FIG. 101 Europe Gas Cylinders Market Value (US$ Mn), By Cylinder Type 2012-2021

FIG. 102 Europe Gas Cylinders Market Value (US$ Mn), By Cylinder Type 2022-2026

FIG. 103 Europe Gas Cylinders Market Value (US$ Mn), By Wrap Type 2012-2021

FIG. 104 Europe Gas Cylinders Market Value (US$ Mn), By Wrap Type 2022-2026

FIG. 105 Europe Gas Cylinders Market Value (US$ Mn), By Size 2012-2021

FIG. 106 Europe Gas Cylinders Market Value (US$ Mn), By Size 2022-2026

FIG. 107 Europe Gas Cylinders Market Value (US$ Mn), By Gas Types 2012-2021

FIG. 108 Europe Gas Cylinders Market Value (US$ Mn), By Gas Types 2022-2026

FIG. 109 Japan Gas Cylinders Market Value (US$ Mn), By Country 2012-2021

FIG. 110 Japan Gas Cylinders Market Value (US$ Mn), By Country 2022-2026

FIG. 111 Japan Gas Cylinders Market Value (US$ Mn), By Cylinder Type 2012-2021

FIG. 112 Japan Gas Cylinders Market Value (US$ Mn), By Cylinder Type 2022-2026

FIG. 113 Japan Gas Cylinders Market Value (US$ Mn), By Size 2012-2021

FIG. 114 Japan Gas Cylinders Market Value (US$ Mn), By Wrap Type 2022-2026

FIG. 115 Japan Gas Cylinders Market Value (US$ Mn), By Size 2012-2021

FIG. 116 Japan Gas Cylinders Market Value (US$ Mn), By Size 2022-2026

FIG. 117 Japan Gas Cylinders Market Value (US$ Mn), By Gas Types 2012-2021

FIG. 118 Japan Gas Cylinders Market Value (US$ Mn), By Gas Types 2022-2026

FIG. 119 APEJ Gas Cylinders Market Value (US$ Mn), By Country 2012-2021

FIG. 120 APEJ Gas Cylinders Market Value (US$ Mn), By Country 2022-2026

FIG. 121 APEJ Gas Cylinders Market Value (US$ Mn), By Cylinder Type 2012-2021

FIG. 122 APEJ Gas Cylinders Market Value (US$ Mn), By Cylinder Type 2022-2026

FIG. 123 APEJ Gas Cylinders Market Value (US$ Mn), By Wrap Type 2012-2021

FIG. 124 APEJ Gas Cylinders Market Value (US$ Mn), By Wrap Type 2022-2026

FIG. 125 APEJ Gas Cylinders Market Value (US$ Mn), By Size 2012-2021

FIG. 126 APEJ Gas Cylinders Market Value (US$ Mn), By Size 2022-2026

FIG. 127 APEJ Gas Cylinders Market Value (US$ Mn), By Gas Types 2012-2021

FIG. 128 APEJ Gas Cylinders Market Value (US$ Mn), By Gas Types 2022-2026

FIG. 129 MEA Gas Cylinders Market Value (US$ Mn), By Country 2012-2021

FIG. 130 MEA Gas Cylinders Market Value (US$ Mn), By Country 2022-2026

FIG. 131 MEA Gas Cylinders Market Value (US$ Mn), By Cylinder Type 2012-2021

FIG. 132 MEA Gas Cylinders Market Value (US$ Mn), By Cylinder Type 2022-2026

FIG. 133 MEA Gas Cylinders Market Value (US$ Mn), By Wrap Type 2012-2021

FIG. 134 MEA Gas Cylinders Market Value (US$ Mn), By Wrap Type 2022-2026

FIG. 135 MEA Gas Cylinders Market Value (US$ Mn), By Size 2012-2021

FIG. 136 MEA Gas Cylinders Market Value (US$ Mn), By Size 2022-2026

FIG. 137 MEA Gas Cylinders Market Value (US$ Mn), By Gas Types 2012-2021

FIG. 138 MEA Gas Cylinders Market Value (US$ Mn), By Gas Types 2022-2026

Recommendations

Packaging

Medical Gas Cylinders Market

Published : March 2023

Packaging

Label Printers Market

Published : January 2023

Packaging

Gas Cylinders Market

Published : June 2022

Explore Packaging Insights

View Reports

We value your privacy

We use cookies to enhance your browsing experience, serve personalized ads or content, and analyze our traffic.

By clicking "Accept All", you consent to our use of cookies. Cookie Policy