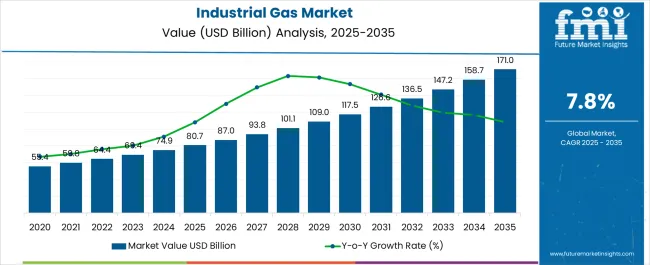
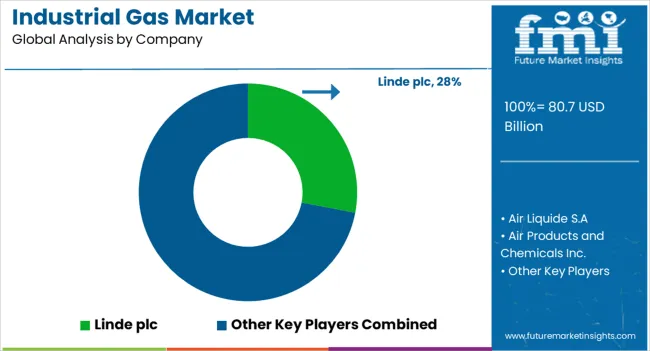
The global industrial gas market is valued at USD 80.7 billion in 2025. It is slated to reach USD 171.0 billion by 2035, recording an absolute increase of USD 87.3 billion over the forecast period. This translates into a total growth of 108%, with the market forecast to expand at a compound annual growth rate (CAGR) of 7.8% between 2025 and 2035. The overall market size is expected to grow by nearly 2.1X during the same period, supported by increasing demand for industrial gases in semiconductor fabrication and advanced manufacturing, growing adoption of hydrogen technologies for energy transition and decarbonization initiatives, expanding healthcare infrastructure requiring medical oxygen and specialty gases, and rising emphasis on sustainable production processes across metallurgy, chemicals, food processing, and electronics manufacturing applications.
Between 2025 and 2030, the industrial gas market is projected to expand from USD 80.7 billion to USD 118 billion, resulting in a value increase of USD 37.2 billion, which represents 42.6% of the total forecast growth for the decade. This phase of development will be shaped by increasing semiconductor manufacturing capacity expansions and advanced node technology deployments, rising adoption of green hydrogen production for industrial decarbonization and mobility applications, and growing demand for ultra-high-purity gases in electronics fabrication and pharmaceutical production. Manufacturing facilities and chemical processors are expanding their industrial gas infrastructure capabilities to address the growing demand for reliable and sustainable gas supply solutions that ensure operational excellence and environmental compliance.
Quality assurance personnel encounter ongoing tensions between achieving precise gas composition standards and accommodating varying storage conditions, particularly when facilities must manage multiple gas types including oxygen, nitrogen, argon, and specialty gases within unified distribution systems. Cross-functional difficulties emerge when process engineers specify ultra-high purity requirements while operations teams prioritize cost-effective bulk delivery methods that may compromise gas quality during handling and transfer procedures.
Environmental regulations add operational complexity when industrial gas production and distribution must comply with emission standards and refrigerant phase-out requirements affecting fluorinated gases and greenhouse gas reporting obligations. Regulatory affairs personnel must coordinate between air quality compliance and operational efficiency objectives, particularly when implementing alternative refrigerants that may require equipment modifications and retraining programs.
Supply chain coordination becomes difficult when industrial gas projects require integration of production facilities, distribution networks, and end-user equipment from multiple suppliers with varying delivery schedules and technical specifications. International operations encounter additional complications when gas transport must comply with hazardous material regulations while meeting quality standards established by customer process requirements and safety protocols.
| Metric | Value |
|---|---|
| Estimated Value in (2025E) | USD 80.7 billion |
| Forecast Value in (2035F) | USD 171.0 billion |
| Forecast CAGR (2025 to 2035) | 7.8% |
From 2030 to 2035, the market is forecast to grow from USD 118 billion to USD 171.0 billion, adding another USD 50.1 billion, which constitutes 57.4% of the overall ten-year expansion. This period is expected to be characterized by the expansion of hydrogen economy infrastructure and carbon capture utilization projects, the development of decarbonized steel production using hydrogen direct reduction technologies, and the growth of specialized gas applications for electric vehicle battery manufacturing and advanced semiconductor packaging. The growing adoption of circular economy principles and process intensification strategies will drive demand for industrial gases with enhanced purity specifications and integrated supply chain management features.
Between 2020 and 2025, the industrial gas market experienced steady growth, driven by increasing manufacturing output recovery following pandemic disruptions and growing recognition of industrial gases as essential materials for enhancing process efficiency and product quality in diverse manufacturing, healthcare, chemical processing, and technology fabrication applications. The market developed as industrial engineers and process specialists recognized the potential for industrial gas technology to improve energy efficiency, enable advanced manufacturing processes, and support sustainability objectives while meeting stringent quality requirements. Technological advancement in air separation unit efficiency and on-site generation systems began emphasizing the critical importance of maintaining supply reliability and purity standards in challenging operational environments.
Market expansion is being supported by the increasing global demand for semiconductor manufacturing gases driven by electronics industry growth and digitalization trends, alongside the corresponding need for reliable industrial gas supply systems that can enhance process efficiency, enable advanced manufacturing techniques, and maintain operational continuity across manufacturing, chemicals, metallurgy, healthcare, food processing, and electronics applications. Modern manufacturing facilities and chemical processors are increasingly focused on implementing industrial gas solutions that can improve production yields, enhance product quality, and provide consistent performance in demanding production environments.
The growing emphasis on decarbonization and energy transition is driving demand for hydrogen gas that can support clean fuel production, enable low-carbon steel manufacturing, and ensure comprehensive emission reduction targets. Industrial manufacturers' preference for gas supply solutions that combine operational reliability with sustainability credentials and cost-effectiveness is creating opportunities for innovative on-site generation and pipeline distribution implementations. The rising influence of semiconductor industry expansion and healthcare infrastructure development is also contributing to increased adoption of industrial gases that can provide superior purity characteristics without compromising supply reliability or process control capabilities.
The market is segmented by gas type, end use, distribution mode, and region. By gas type, the market is divided into oxygen, nitrogen, hydrogen, carbon dioxide, argon, and others including helium and specialty gas mixtures. Based on end use, the market is categorized into manufacturing, chemicals & energy, metallurgy & glass, healthcare, food & beverages, and electronics. By distribution mode, the market is segmented into on-site supply through pipelines and on-site plants, bulk supply via liquid transport, and cylinder delivery for merchant markets. Regionally, the market is divided into Asia Pacific, Europe, North America, Middle East & Africa, and Latin America.
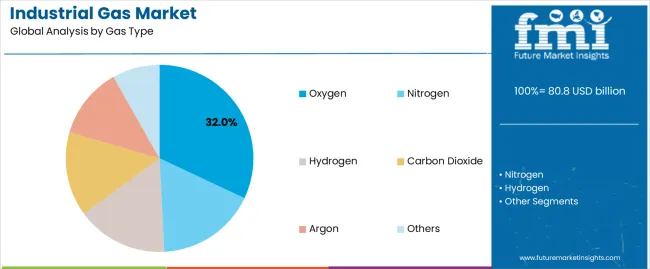
The oxygen segment is projected to maintain its leading position in the industrial gas market in 2025 with a 32% market share, reaffirming its role as the preferred gas type for steel production, chemical processing, and healthcare applications. Steel manufacturers and chemical processors increasingly utilize oxygen for its superior combustion enhancement properties, chemical oxidation capabilities, and proven effectiveness in improving process efficiency while reducing fuel consumption. Oxygen technology's proven effectiveness and application versatility directly address the industry requirements for energy-efficient production methods and environmental compliance across diverse metallurgical operations and chemical synthesis processes.
This gas segment forms the foundation of modern steel manufacturing and wastewater treatment, as it represents the industrial gas with the greatest contribution to process intensification and established performance record across multiple industrial applications and production scenarios. Industrial sector investments in process optimization technologies continue to strengthen adoption among steel producers and chemical manufacturers. With environmental pressures requiring reduced emissions and improved energy efficiency, oxygen supply systems align with both sustainability objectives and operational requirements, making them the central component of comprehensive industrial process strategies.
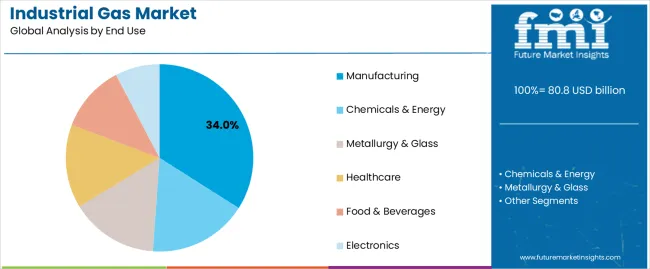
The manufacturing application segment is projected to represent the largest share of industrial gas demand in 2025 with a 34% market share, underscoring its critical role as the primary driver for industrial gas adoption across metal fabrication, welding operations, and general manufacturing processes. Manufacturing facilities prefer industrial gases for production operations due to their exceptional versatility, process enhancement capabilities, and ability to improve product quality while supporting productivity optimization and operational efficiency objectives. Positioned as essential inputs for modern manufacturing operations, industrial gases offer both process advantages and quality benefits.
The segment is supported by continuous innovation in manufacturing technologies and the growing availability of advanced gas supply systems that enable superior production performance with enhanced reliability and reduced operational complexity. Additionally, manufacturing companies are investing in comprehensive gas supply infrastructure programs to support increasingly demanding quality specifications and production efficiency requirements. As manufacturing digitalization accelerates and quality standards increase, the manufacturing application will continue to dominate the market while supporting advanced gas utilization and production optimization strategies.
The on-site distribution mode segment is projected to maintain its leading position in the industrial gas market in 2025 with a 46% market share, reflecting its critical role in serving large-volume industrial customers requiring continuous gas supply. Major industrial facilities prefer on-site gas generation through dedicated air separation units and pipeline connections due to superior supply reliability, optimized logistics costs, and operational integration advantages. On-site supply systems provide strategic benefits for high-volume consumers through guaranteed availability, consistent purity levels, and long-term cost competitiveness compared to alternative distribution methods.
This distribution segment serves the foundation of industrial gas supply for large manufacturing complexes, chemical plants, and integrated steel mills where continuous production operations demand uninterrupted gas availability. Industrial customers requiring substantial gas volumes find on-site solutions economically attractive while ensuring supply chain resilience and operational independence. With industrial facilities expanding production capacity and seeking supply chain optimization, on-site distribution modes align with both operational requirements and strategic supply security objectives.
The industrial gas market is advancing steadily due to increasing demand for semiconductor manufacturing gases driven by global electronics production growth and growing adoption of hydrogen technologies for industrial decarbonization providing enhanced environmental performance and energy transition support across manufacturing, chemicals, metallurgy, healthcare, and electronics applications. However, the market faces challenges, including high capital investment requirements for air separation units and distribution infrastructure, energy-intensive production processes affecting operational economics, and supply chain constraints related to helium availability and cylinder logistics capacity limitations. Innovation in renewable energy-powered gas production and digital supply chain management continues to influence product development and market expansion patterns.
The growing expansion of semiconductor fabrication capacity is driving demand for ultra-high-purity industrial gases that address unique production requirements including contamination-free processing environments, precise gas mixture compositions for plasma etching and chemical vapor deposition, and consistent supply reliability for continuous manufacturing operations. Advanced semiconductor manufacturing requires specialized industrial gas systems that deliver exceptional purity levels across multiple gas types while maintaining strict quality control and supply continuity. Electronics manufacturers are increasingly recognizing the competitive advantages of integrated gas supply partnerships for advanced node technology deployment and production yield optimization, creating opportunities for innovative ultra-pure gas delivery systems specifically designed for next-generation chip manufacturing facilities.
Modern industrial facilities are incorporating hydrogen technologies and low-carbon production methods to enhance environmental performance, reduce carbon emissions, and support comprehensive decarbonization objectives through optimized combustion processes and direct reduction technologies. Leading steel producers and chemical manufacturers are developing green hydrogen supply chains from renewable energy sources, implementing hydrogen direct reduction ironmaking processes, and advancing production technologies that minimize carbon footprint while maintaining product quality. These technologies improve environmental credentials while enabling new market opportunities, including clean fuel production, low-carbon steel manufacturing, and sustainable chemical synthesis. Advanced hydrogen integration also allows industrial facilities to support comprehensive climate commitments and market differentiation beyond traditional efficiency improvements.
The expansion of healthcare facilities, hospital capacity additions, and pharmaceutical manufacturing is driving demand for medical-grade industrial gases with stringent purity requirements and reliable supply systems. Healthcare applications require specialized oxygen, nitrogen, and specialty gas products with pharmaceutical-grade specifications that exceed standard industrial requirements, creating premium market segments with differentiated value propositions. Industrial gas suppliers are investing in healthcare-dedicated production capabilities and distribution networks to serve growing medical oxygen demand while supporting innovation in pharmaceutical processing, cryogenic preservation, and respiratory care applications.
| Country | CAGR (2025-2035) |
|---|---|
| India | 9.8% |
| China | 8.1% |
| Brazil | 6% |
| South Korea | 5.6% |
| United States | 5.2% |
| Germany | 4.4% |
| Japan | 3.9% |
The industrial gas market is experiencing solid growth globally, with India leading at a 9.8% CAGR through 2035, driven by expanding semiconductor fabrication facilities and petroleum refinery upgrades, growing city-gas distribution networks, and increasing steel production capacity additions. China follows at 8.1%, supported by energy transition toward natural gas and LNG consumption, expanding green hydrogen pilot projects, and robust automotive and electronics manufacturing output growth. Brazil shows growth at 6%, emphasizing pulp and paper industry expansion, food processing sector development, and pre-salt offshore oil project requirements alongside industrial park construction. South Korea demonstrates 5.6% growth, supported by advanced semiconductor manufacturing node deployment, electric vehicle battery supply chain expansion, and hospital and biopharmaceutical gas demand increases. The United States records 5.2%, focusing on data center infrastructure expansion and regional hydrogen hub development, refinery and chemical plant reliability improvements, and air separation unit modernization programs. Germany exhibits 4.4% growth, emphasizing industrial process decarbonization through oxy-combustion and hydrogen blending technologies, chemicals sector retrofits, and glass manufacturing upgrades. Japan shows 3.9% growth, supported by aging industrial base modernization initiatives, medical oxygen infrastructure development, and specialty gas applications growth.
The report covers an in-depth analysis of 40+ countries, the top-performing countries are highlighted below.
Revenue from industrial gases in India is projected to exhibit exceptional growth with a CAGR of 9.8% through 2035, driven by expanding semiconductor fabrication facility investments and rapidly growing petroleum refining capacity upgrades supported by government Make in India initiatives and industrial modernization programs. The country's massive infrastructure development and increasing investment in advanced manufacturing technologies are creating substantial demand for industrial gas solutions. Major industrial gas suppliers and multinational corporations are establishing comprehensive production and distribution capabilities to serve both domestic industrial growth and emerging technology sector requirements.
Revenue from industrial gases in China is expanding at a CAGR of 8.1%, supported by the country's strategic shift toward natural gas and liquefied natural gas consumption, expanding green hydrogen pilot projects for industrial applications, and continued robust automotive and electronics manufacturing output growth. The country's comprehensive industrial infrastructure and technological advancement are driving sophisticated industrial gas capabilities throughout diverse manufacturing sectors. Leading industrial gas companies and domestic producers are establishing extensive production facilities and innovation centers to address growing domestic consumption and support industrial upgrading initiatives.
Revenue from industrial gases in Brazil is expanding at a CAGR of 6%, supported by the country's expanding pulp and paper industry, growing food processing sector requiring modified atmosphere packaging and freezing applications, and offshore pre-salt oil field development alongside industrial park construction programs. The nation's resource abundance and manufacturing sector growth are driving demand for industrial gas solutions throughout diverse industrial segments. Regional industrial gas suppliers and international companies are investing in production capacity and distribution networks to serve growing industrial requirements.
Revenue from industrial gases in South Korea is expanding at a CAGR of 5.6%, supported by the country's leadership in advanced semiconductor manufacturing node deployment, expanding electric vehicle battery supply chain investments, and growing hospital and biopharmaceutical gas demand. The nation's technology excellence and advanced manufacturing capabilities are driving sophisticated industrial gas requirements throughout high-technology sectors. Leading electronics manufacturers and battery producers are investing extensively in ultra-pure gas supply systems and specialized applications.
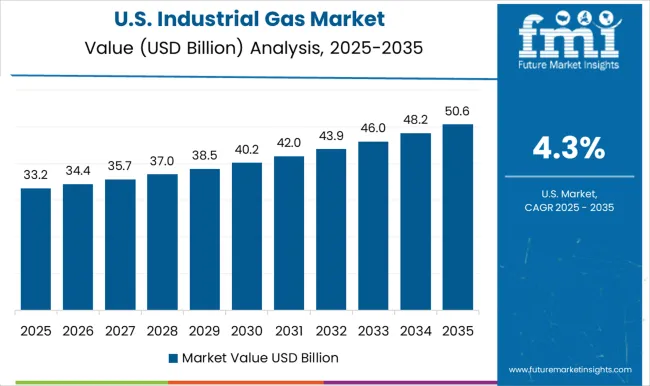
Revenue from industrial gases in the United States is expanding at a CAGR of 5.2%, supported by the country's expanding data center infrastructure requiring nitrogen and specialty gases for equipment protection, developing regional hydrogen hub initiatives for clean energy production, and ongoing refinery and chemical plant reliability improvement programs alongside air separation unit modernization projects. The nation's advanced industrial base and energy sector sophistication are driving demand for reliable industrial gas solutions. Major industrial gas suppliers and petrochemical companies are investing in capacity expansion and technology upgrades to serve both existing industrial customers and emerging hydrogen economy applications.
Revenue from industrial gases in Germany is expanding at a CAGR of 4.4%, driven by the country's industrial process decarbonization initiatives utilizing oxy-combustion technologies and hydrogen blending applications, chemical sector production facility retrofits for improved efficiency, and glass manufacturing industry upgrade programs. Germany's engineering excellence and sustainability commitment are driving sophisticated industrial gas applications throughout industrial sectors. Leading chemical manufacturers and industrial gas suppliers are establishing comprehensive decarbonization programs incorporating advanced gas technologies.
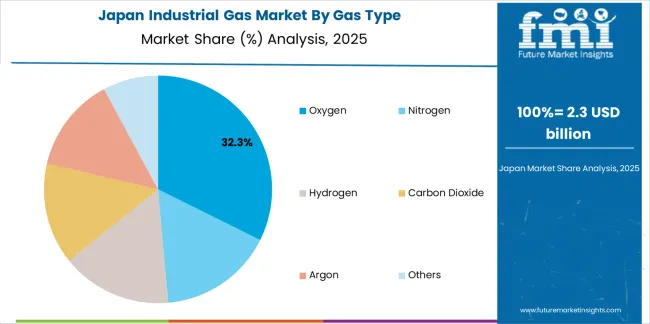
Revenue from industrial gases in Japan is expanding at a CAGR of 3.9%, supported by the country's aging industrial base modernization programs, medical oxygen infrastructure development addressing healthcare system needs, and specialty gas applications growth in advanced manufacturing and research sectors. Japan's technological sophistication and quality standards are driving demand for high-specification industrial gas products. Leading industrial gas companies and healthcare providers are investing in specialized capabilities for advanced gas applications.
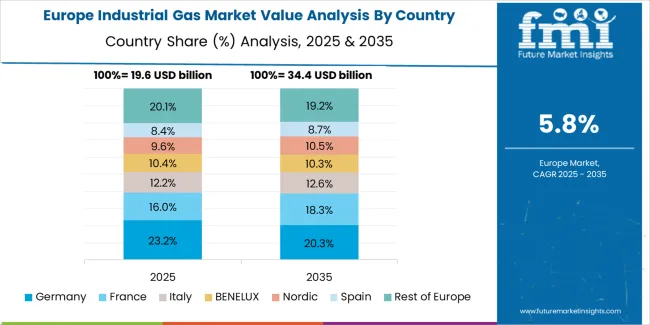
The industrial gas market in Europe is projected to grow from USD 19.4 billion in 2025 to USD 40.3 billion by 2035, registering a CAGR of 7.8% over the forecast period. Germany is expected to maintain leadership with a 26% market share in 2025, moderating to 25.5% by 2035, supported by chemical industry process retrofits and glass and metals sector decarbonization initiatives.
France follows with 19% in 2025, projected at 19.5% by 2035, driven by pharmaceutical and healthcare gas demand expansion and hydrogen mobility pilot programs. The United Kingdom holds 17.5% in 2025, declining to 16.8% by 2035 as electronics manufacturing, data center infrastructure, and healthcare applications offset petroleum refinery rationalization impacts. Italy commands 12.5% in 2025, rising slightly to 12.7% by 2035, supported by metallurgy and glass industry requirements and food sector applications. Spain accounts for 9% in 2025, reaching 9.5% by 2035 aided by green hydrogen corridor development and food processing industry expansion. The Rest of Europe region, including Nordic countries, Central & Eastern Europe, and other markets, is anticipated to hold 16% in both 2025 and 2035, reflecting balanced growth from Nordic clean-process technology initiatives and Eastern European industrial capacity buildout programs.
The Industrial Gas Market is expanding steadily as global manufacturing, healthcare, and energy sectors increase their reliance on high-purity gases for production efficiency, safety, and technological advancement. Industrial gases such as oxygen, nitrogen, hydrogen, carbon dioxide, and specialty gases play a central role in metal fabrication, chemicals, semiconductors, food processing, and medical therapy. As industries migrate toward cleaner energy and automated processes, demand for high-efficiency separation, storage, and distribution systems continues to rise. Growth is also reinforced by the expansion of LNG infrastructure, hydrogen energy initiatives, and the rising need for medical oxygen across emerging and mature economies.
Linde plc, Air Liquide, and Air Products and Chemicals dominate the global landscape with extensive production networks, advanced cryogenic technologies, and integrated gas supply solutions. Their strong presence in heavy industry, petrochemicals, and healthcare allows them to support large-scale industrial clusters with pipeline networks and on-site generation plants. These companies are also at the forefront of green hydrogen and carbon-capture projects, aligning with global decarbonization goals.
In Asia, Nippon Sanso Holdings and Yingde Gases Group are strengthening regional capabilities by expanding merchant gas operations and enhancing specialty gas portfolios for electronics and high-tech manufacturing. Messer Group continues to push growth in Europe and the Americas through tailored supply models for metallurgy, environmental technologies, and food applications.
Industrial gases represent a critical industrial materials segment within manufacturing, healthcare, chemicals, and technology applications, projected to grow from USD 80.7 billion in 2025 to USD 171.0 billion by 2035 at a 7.8% CAGR. These essential industrial products, primarily oxygen, nitrogen, hydrogen, carbon dioxide, and argon configurations, serve as fundamental inputs in steel production, chemical processing, healthcare delivery, food preservation, and electronics manufacturing where reliable supply, consistent purity, and operational efficiency are essential. Market expansion is driven by increasing semiconductor manufacturing capacity, growing hydrogen economy development, expanding healthcare infrastructure requirements, and rising industrial decarbonization initiatives across manufacturing, chemicals, metallurgy, healthcare, and electronics sectors.
How Industrial Regulators Could Strengthen Product Standards and Environmental Performance?
How Industry Associations Could Advance Technology Standards and Market Development?
How Industrial Gas Manufacturers Could Drive Innovation and Market Leadership?
How End-User Industries Could Optimize Gas Utilization and Sustainability?
How Research Institutions Could Enable Technology Advancement?
How Investors and Financial Enablers Could Support Market Growth and Innovation?
| Items | Values |
|---|---|
| Quantitative Units (2025) | USD 80.7 billion |
| Gas Type | Oxygen, Nitrogen, Hydrogen, Carbon Dioxide, Argon, Others |
| End Use | Manufacturing, Chemicals & Energy, Metallurgy & Glass, Healthcare, Food & Beverages, Electronics |
| Distribution Mode | On-site, Bulk, Cylinder |
| Regions Covered | Asia Pacific, Europe, North America, Middle East & Africa, Latin America |
| Countries Covered | India, China, United States, Germany, Japan, South Korea, Brazil, and 40+ countries |
| Key Companies Profiled | Linde plc, Air Liquide, Air Products and Chemicals, Nippon Sanso Holdings, Messer Group, Yingde Gases Group |
| Additional Attributes | Dollar sales by gas type, end use, and distribution mode categories, regional demand trends, competitive landscape, technological advancements in gas production, sustainability development, hydrogen economy integration, and supply chain optimization |
The global industrial gas market is estimated to be valued at USD 80.8 billion in 2025.
The market size for the industrial gas market is projected to reach USD 168.1 billion by 2035.
The industrial gas market is expected to grow at a 7.6% CAGR between 2025 and 2035.
The key product types in industrial gas market are oxygen, nitrogen, hydrogen, carbon dioxide, argon and others.
In terms of end use, manufacturing segment to command 34.0% share in the industrial gas market in 2025.


Our Research Products

The "Full Research Suite" delivers actionable market intel, deep dives on markets or technologies, so clients act faster, cut risk, and unlock growth.

The Leaderboard benchmarks and ranks top vendors, classifying them as Established Leaders, Leading Challengers, or Disruptors & Challengers.

Locates where complements amplify value and substitutes erode it, forecasting net impact by horizon

We deliver granular, decision-grade intel: market sizing, 5-year forecasts, pricing, adoption, usage, revenue, and operational KPIs—plus competitor tracking, regulation, and value chains—across 60 countries broadly.

Spot the shifts before they hit your P&L. We track inflection points, adoption curves, pricing moves, and ecosystem plays to show where demand is heading, why it is changing, and what to do next across high-growth markets and disruptive tech

Real-time reads of user behavior. We track shifting priorities, perceptions of today’s and next-gen services, and provider experience, then pace how fast tech moves from trial to adoption, blending buyer, consumer, and channel inputs with social signals (#WhySwitch, #UX).

Partner with our analyst team to build a custom report designed around your business priorities. From analysing market trends to assessing competitors or crafting bespoke datasets, we tailor insights to your needs.
Supplier Intelligence
Discovery & Profiling
Capacity & Footprint
Performance & Risk
Compliance & Governance
Commercial Readiness
Who Supplies Whom
Scorecards & Shortlists
Playbooks & Docs
Category Intelligence
Definition & Scope
Demand & Use Cases
Cost Drivers
Market Structure
Supply Chain Map
Trade & Policy
Operating Norms
Deliverables
Buyer Intelligence
Account Basics
Spend & Scope
Procurement Model
Vendor Requirements
Terms & Policies
Entry Strategy
Pain Points & Triggers
Outputs
Pricing Analysis
Benchmarks
Trends
Should-Cost
Indexation
Landed Cost
Commercial Terms
Deliverables
Brand Analysis
Positioning & Value Prop
Share & Presence
Customer Evidence
Go-to-Market
Digital & Reputation
Compliance & Trust
KPIs & Gaps
Outputs
Full Research Suite comprises of:
Market outlook & trends analysis
Interviews & case studies
Strategic recommendations
Vendor profiles & capabilities analysis
5-year forecasts
8 regions and 60+ country-level data splits
Market segment data splits
12 months of continuous data updates
DELIVERED AS:
PDF EXCEL ONLINE
Industrial Gas Stove Market Size and Share Forecast Outlook 2025 to 2035
Industrial Gas Turbine Market
Food Grade Industrial Gases Market Size and Share Forecast Outlook 2025 to 2035
Industrial Grade Electrochemical CO Sensor Market Size and Share Forecast Outlook 2025 to 2035
Industrial Bench Scale Market Size and Share Forecast Outlook 2025 to 2035
Gas Insulated Switchgear (GIS) Bushing Market Size and Share Forecast Outlook 2025 to 2035
Industrial Low Profile Floor Scale Market Size and Share Forecast Outlook 2025 to 2035
Gas Discharge Tube (GDT) Arresters Market Size and Share Forecast Outlook 2025 to 2035
Industrial Sand Mill Market Size and Share Forecast Outlook 2025 to 2035
Industrial Control Network Modules Market Size and Share Forecast Outlook 2025 to 2035
Industrial Precision Oven Market Size and Share Forecast Outlook 2025 to 2035
Industrial Water Chiller for PCB Market Size and Share Forecast Outlook 2025 to 2035
Industrial & Commercial HVLS Fans Market Size and Share Forecast Outlook 2025 to 2035
Industrial Robot Controller Market Size and Share Forecast Outlook 2025 to 2035
Industrial Wired Routers Market Size and Share Forecast Outlook 2025 to 2035
Industrial Evaporative Condensers Market Size and Share Forecast Outlook 2025 to 2035
Industrial Energy Management System Market Size and Share Forecast Outlook 2025 to 2035
Industrial Insulation Market Size and Share Forecast Outlook 2025 to 2035
Industrial Safety Gloves Market Size and Share Forecast Outlook 2025 to 2035
Industrial Cleaner Market Size and Share Forecast Outlook 2025 to 2035

Thank you!
You will receive an email from our Business Development Manager. Please be sure to check your SPAM/JUNK folder too.
Chat With
MaRIA