Industrial Food Slicers Market
Market Insights on Industrial Food Slicers covering sales outlook, demand forecast & up-to-date key trends
Industrial Food Slicers Market by Product, Application, Type & Region - Forecast 2022 – 2032
Industrial Food Slicers Market Snapshot (2022 to 2032)
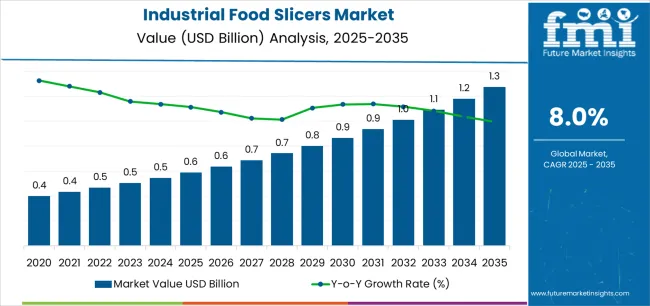
[350 Pages Report] According to Future Market Insights research, during the projected period, the Global Industrial Food Slicers market is expected to grow at a CAGR of 8%. The market value is projected to increase from US$ 555 Mn in 2022 to US$ 780 Mn by 2032. The Industrial Food Slicers Market was valued at US$ 450 Mn at the end of 2021 and is anticipated to exhibit Y-o-Y growth of 3.5% in 2022.
Market Size Value in 2022 |
US$ 555 Mn |
Market Forecast Value in 2032 |
US$ 780 Mn |
Global Growth Rate (2022 to 2032) |
8.0% CAGR |
Forecast Period |
2022-2032 |
Market Share of India in South Asia |
31% |
The global demand for packaged products is growing in tandem with food safety regulations. Frozen processed food products are available, which protects the food from spoiling. Foods that are frozen are free of enzymes that promote decomposition. Toxic substances are removed from food during processing and slicing, while nutritious value is preserved. Because of their longer shelf life, processed and packaged foods are becoming more popular.
Let us know your requirement to get
100% FREE customization
Historical Outlook vs Future Projections for Global Industrial Food Slicers Market
As per FMI – market research and competitive intelligence provider, over the past half-decade, the global market value for Industrial Food Slicers has boosted owing to increased application of the product in various areas including food, beverages etc.
One of the important factors driving the growth of the industrial food slicers market is the growing desire for automated industrial food slicers. The automated slicer machine is widely utilised in a variety of end-user applications because it reduces downtime and improves product presentation by cutting quicker. For example, a leading vendor offers the ECD-702, an automated industrial food slicer that uses a digital food cutter to slice a variety of vegetables into various shapes. The market's expansion is being fuelled by recent technological advancements and modernizations.
Country-wise Insights-
How is the U.S Industrial Food Slicers Market Shaping?
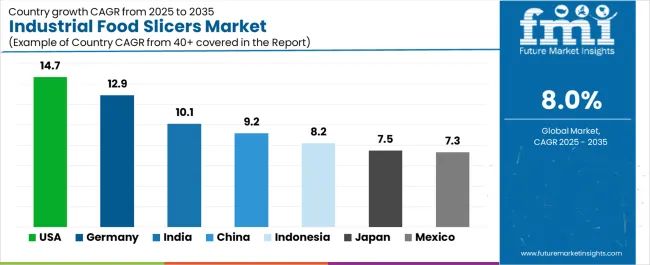
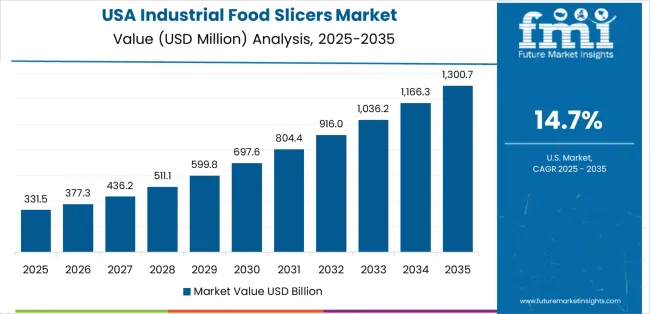
According to FMI, the Industrial Food Slicers market in the U.S. is rising at a CAGR of 14.66%. Due to increased demand from countries such as the United States and Canada, North America is likely to be the leading market for industrial food slicers throughout the forecast period. This is due to an increase in the number of commercial.
What is the Performance of the Indian Industrial Food Slicers Market?
Due to the existence of a large number of local companies, the Industrial food slicer is quite fragmented. Local players offer the same service at a significantly lower cost. In the short term, this may have an influence on the sales of the market's larger competitors. Local players may not be able to compete with big food slicer producers in terms of product quality. This aspect may operate as a stifling factor for the food slicer's expansion. Food slicer producers, on the other hand, may be able to increase the quality of their goods in the near future by adhering to standards and certifications. This scenario estimates the industrial food slicers market will expand by 10.1% CAGR in India by 2032.
How Will Market Players Target the Emerging Market of China for the Industrial Food Slicers Market?
According to FMI, the Industrial Food Slicers market in the China is rising at a CAGR of 9.19%. During the projected period, the market for industrial food slicers is expected to develop at a healthy rate. The food and beverage industry are predicted to account for around 32% of total market growth, and expanding government support efforts will be critical in propelling the industrial food cutting machines market forward. The primary markets for industrial food cutting machines are China and Japan.
How Japan and Indonesia are growing as a fastest market?
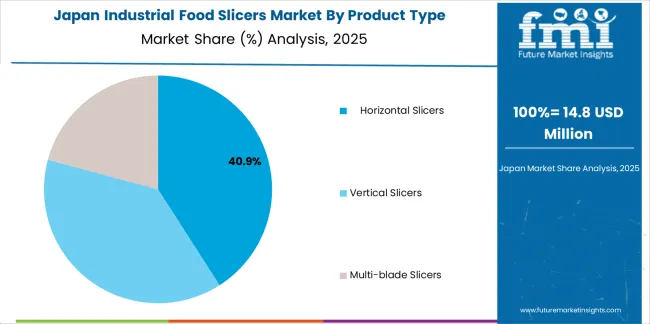
During the projected period, the Asia Pacific region is predicted to be the fastest-growing market. The key reasons driving expansion in this region include rising consumer demand for convenience meals and rising health consciousness among customers across a variety of end-user businesses, such as food processors, meat and poultry stores, and so on, leading to increased usage of industrial food slicers. This scenario estimates the industrial food slicers market will expand at a CAGR of 7.49% in Japan and 8.2% in Indonesia by 2032.
Find your sweet spots for generating winning opportunities in this market.
Talk to AnalystCategory-wise Insights-
Will Meat & Poultry Remain Top-selling Application?
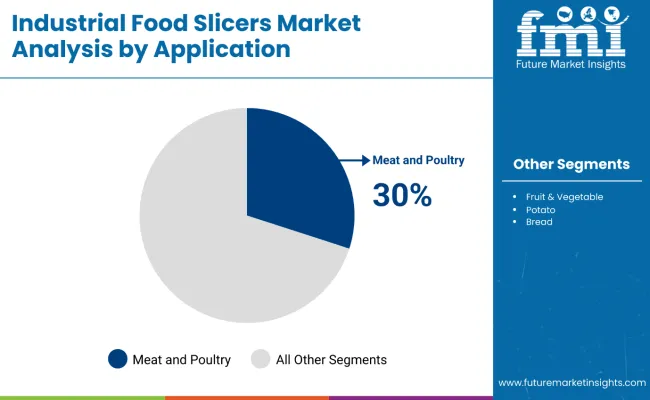
According to FMI, the Industrial Food Slicers market in the Meat & Poultry is having a share of 30%. To keep up with the growing demand for meat in Australia, many businesses will need more equipment. In Australia, meat consumption is on the rise, with chicken proving to be the most popular option. Keeping up with the processing of poultry in Australia can be difficult, particularly when it comes to finding qualified and dependable employees.
Is Horizontal Slicer easy to use Product?
The slicer is designed to slice fresh, cold smoked salmon and other fish species horizontally. From the overall length of the product, the slicer creates long and regular thin slices. Ideal for adding value to products. A vertical drive controls and adjusts slice thickness on the horizontal slicer. The control panel is simple to use, allowing to modify slice thicknesses and knife blade speed. A great option for a low-cost slicer that is both efficient and reliable.
Does Fruits & Vegetable, Cheese, Potatoes slicers allow even inexperienced person to work with consistency?
All-purpose machines, which aren't built for any one fruit or vegetable, may process a wide range of foods equally well. Slicing, dicing, shredding, wedging, and coring are all popular cuts that come in a range of sizes. Blade and compatible pusher blocks are often used, and sets may be interchanged for further versatility.
What is the use of Vertical Slicers?
The plate in vertical slicer machines is perpendicular to the blade. As a result, the object must be pressed against the blade by hand, but the slicing results, especially with meat, are exceptional in terms of precision and consistency. Vertical slicers also take up less space than gravity slicers. For chopping fresh meat, vertical slicers are recommended.
Supermarket Are Propelling the Growth in Industrial Food Slicers Market-
The use of industrial food slicers in a variety of end-user sectors, such as supermarkets, restaurants, and hotels, is propelling the market forward. The industrial food slicer manufacturers market would be driven by increased demand for convenience meals among a vast population base across different geographies due to increasing working women and families, as well as technology advances, during the projected period. The worldwide industrial food slicers market is being propelled by the widespread use of these equipment in commercial kitchens and restaurants at home. Furthermore, rising disposable income has prompted customers to adopt healthier eating habits, which has affected product mix selections at many firms, resulting in increasing adoption rates of these items throughout the world.
Competitive Landscape
To increase position and distribution channel in the worldwide company, key players are pursuing a variety of methods, including mergers and acquisitions. Furthermore, numerous significant firms are working on new product launches and development to expand their capacity and get a foothold in the business.
For example,
- Nemco Makes a Food-Prep ‘Power’ Move-Launches New Line of Electric Food Processors
- Edlund- New ARC XL Manual fruit & Vegetable slicer
FMI has provided detailed information about price points of Industrial Food Slicers Market of manufacturers positioned across regions, sales growth, production capacity, and speculative production expansion in the recently published report.
Similar, recent developments related to companies offering in Industrial Food Slicers Market business have been tracked by the team at FMI, which are available in the full report.

An unified Market Research Subscription Platform, built for today’s disparate research needs.
Industrial Food Slicers Market Report Scope
Attribute |
Details |
Forecast Period |
2022-2032 |
Historical Data Available for |
2017-2022 |
Market Analysis |
USD Mn for Value and Units for Volume |
Key Regions Covered |
|
Key Countries Covered |
|
Key Segments Covered |
|
Key Companies Profiled |
|
Report Coverage |
Market Forecast, Company Share Analysis, Competitive Landscape, DROT Analysis, Market Dynamics and Challenges, and Strategic Growth Initiatives |
Customization & Pricing |
Available upon Request |
Industrial Food Slicers Market by Category-
By Product:
- Horizontal Slicers
- Vertical Slicers
- Centrifugal Slicers
- Others
By Application :
- Meat & Poultry
- Fruit & Vegetables
- Potatoes
- Bread
- Cheese
- Fish & Seafood
- Others
By Type :
- U-Shaped Horizontal Trough
- Ribbon Agitator
By Region :
- North America
- Latin America
- Europe
- East Asia
- South Asia
- Oceania
- MEA
Frequently Asked Questions
The Industrial Food Slicers Market size is assessed to be USD 555 Mn currently.
The Industrial Food Slicers Market is expected to rise at a CAGR of 8%.
The North American Industrial Food Slicers market is expected to register a 12% CAGR between 2022 and 2032.
US, China, Canada, Germany, Mexico are the major countries driving demand for Industrial Food Slicers Market.
China Industrial Food Slicers market is projected to grow at a CAGR of around 9.19% over the next ten years.
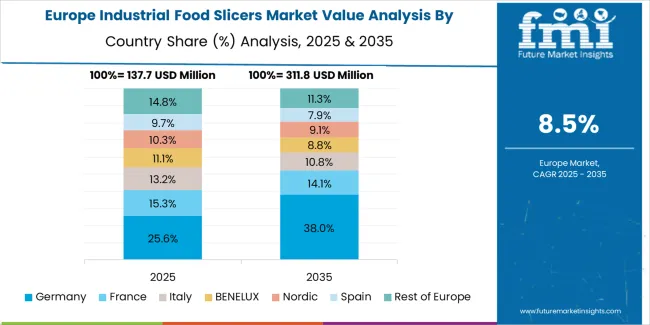
Germany Industrial Food Slicers market is projected to grow at a CAGR of around 12.90% over the next ten years.
The demand for Industrial Food Slicers market in Europe is expected to grow at 9.5% CAGR between 2022 and 2032.
Grote company, Hobart, Berkel, Vollrath, Bizerba are expected to be the top players driving the market growth.
Mexico Industrial Food Slicers market is projected to grow at a CAGR of around 7.32% over the next ten years.
The global Industrial Food Slicers market is forecasted to surpass US$ 780 Mn by the end of 2032.
1. Executive Summary
1.1. Global Market Outlook
1.2. Demand-side Trends
1.3. Supply-side Trends
1.4. Technology Roadmap Analysis
1.5. Analysis and Recommendations
2. Market Overview
2.1. Market Coverage / Taxonomy
2.2. Market Definition / Scope / Limitations
3. Market Background
3.1. Market Dynamics
3.1.1. Drivers
3.1.2. Restraints
3.1.3. Opportunity
3.1.4. Trends
3.2. Scenario Forecast
3.2.1. Demand in Optimistic Scenario
3.2.2. Demand in Likely Scenario
3.2.3. Demand in Conservative Scenario
3.3. Opportunity Map Analysis
3.4. Product Life Cycle Analysis
3.5. Supply Chain Analysis
3.5.1. Supply Side Participants and their Roles
3.5.1.1. Producers
3.5.1.2. Mid-Level Participants (Traders/ Agents/ Brokers)
3.5.1.3. Wholesalers and Distributors
3.5.2. Value Added and Value Created at Node in the Supply Chain
3.5.3. List of Raw Material Suppliers
3.5.4. List of Existing and Potential Buyer’s
3.6. Industrial Food Slicers - Pricing Analysis
3.6.1. Price Point Assessment by Region
3.6.2. Price Point Assessment by Product Type
3.6.3. Price Forecast till 2032
3.6.4. Factors affecting Pricing
3.7. Value Chain Analysis
3.7.1. Profit Margin Analysis
3.7.2. Wholesalers and Distributors
3.7.3. Retailers
3.8. PESTLE and Porter’s Analysis
3.9. Regulatory Landscape
3.9.1. By Key Regions
3.9.2. By Key Countries
3.10. Regional Parent Market Outlook
4. Global Industrial Food Slicers Analysis 2017-2021 and Forecast, 2022-2032
4.1. Historical Market Size Value (US$ Mn) & Volume (Units) Analysis, 2017-2021
4.2. Current and Future Market Size Value (US$ Mn) & Volume (Units) Projections, 2022-2032
4.2.1. Y-o-Y Growth Trend Analysis
4.2.2. Absolute $ Opportunity Analysis
5. Global Industrial Food Slicers Analysis 2017-2021 and Forecast 2022-2032, By Product Type
5.1. Introduction / Key Findings
5.2. Historical Market Size Value (US$ Mn) & Volume (Units) Analysis By Product Type, 2017-2021
5.3. Current and Future Market Size Value (US$ Mn) & Volume (Units) Analysis and Forecast By Product Type, 2022-2032
5.3.1. Horizontal Slicers
5.3.2. Vertical Slicers
5.3.3. Centrifugal Slicers
5.3.4. Others
5.4. Y-o-Y Growth Trend Analysis By Product Type, 2017-2021
5.5. Absolute $ Opportunity Analysis By Product Type, 2022-2032
6. Global Industrial Food Slicers Analysis 2017-2021 and Forecast 2022-2032, By Type
6.1. Introduction / Key Findings
6.2. Historical Market Size Value (US$ Mn) & Volume (Units) Analysis By Type, 2017-2021
6.3. Current and Future Market Size Value (US$ Mn) & Volume (Units) Analysis and Forecast By Type, 2022-2032
6.3.1. U-Shaped Horizontal Trough
6.3.2. Ribbon Agitator
6.3.3. Potatoes
6.4. Y-o-Y Growth Trend Analysis By Type, 2017-2021
6.5. Absolute $ Opportunity Analysis By Type, 2022-2032
7. Global Industrial Food Slicers Analysis 2017-2021 and Forecast 2022-2032, By Application
7.1. Introduction / Key Findings
7.2. Historical Market Size Value (US$ Mn) & Volume (Units) Analysis By Application, 2017-2021
7.3. Current and Future Market Size Value (US$ Mn) & Volume (Units) Analysis and Forecast By Application, 2022-2032
7.3.1. Meat & Poultry
7.3.2. Fruit & Vegetables
7.3.3. Bread
7.3.4. Cheese
7.3.5. Fish & Seafood
7.3.6. Others
7.4. Y-o-Y Growth Trend Analysis By Application, 2017-2021
7.5. Absolute $ Opportunity Analysis By Application, 2022-2032
8. Global Industrial Food Slicers Analysis 2017-2021 and Forecast 2022-2032, By Region
8.1. Introduction
8.2. Historical Market Size Value (US$ Mn) & Volume (Units) Analysis By Region, 2017-2021
8.3. Current Market Size Value (US$ Mn) & Volume (Units) Analysis and Forecast By Region, 2022-2032
8.3.1. North America
8.3.2. Latin America
8.3.3. Europe
8.3.4. East Asia
8.3.5. South Asia
8.3.6. Oceania
8.3.7. MEA
8.4. Market Attractiveness Analysis By Region
9. North America Industrial Food Slicers Analysis 2017-2021 and Forecast 2022-2032, By Country
9.1. Historical Market Size Value (US$ Mn) & Volume (Units) Trend Analysis By Market Taxonomy, 2017-2021
9.2. Market Size Value (US$ Mn) & Volume (Units) Forecast By Market Taxonomy, 2022-2032
9.2.1. By Country
9.2.1.1. U.S.
9.2.1.2. Canada
9.2.2. By Product Type
9.2.3. By Type
9.2.4. By Application
9.3. Market Attractiveness Analysis
9.3.1. By Country
9.3.2. By Product Type
9.3.3. By Type
9.3.4. By Application
9.4. Key Takeaways
10. Latin America Industrial Food Slicers Analysis 2017-2021 and Forecast 2022-2032, By Country
10.1. Historical Market Size Value (US$ Mn) & Volume (Units) Trend Analysis By Market Taxonomy, 2017-2021
10.2. Market Size Value (US$ Mn) & Volume (Units) Forecast By Market Taxonomy, 2022-2032
10.2.1. By Country
10.2.1.1. Brazil
10.2.1.2. Mexico
10.2.1.3. Argentina
10.2.1.4. Chile
10.2.1.5. Peru
10.2.1.6. Rest of Latin America
10.2.2. By Product Type
10.2.3. By Type
10.2.4. By Application
10.3. Market Attractiveness Analysis
10.3.1. By Country
10.3.2. By Product Type
10.3.3. By Type
10.3.4. By Application
10.4. Key Takeaways
11. Europe Industrial Food Slicers Analysis 2017-2021 and Forecast 2022-2032, By Country
11.1. Historical Market Size Value (US$ Mn) & Volume (Units) Trend Analysis By Market Taxonomy, 2017-2021
11.2. Market Size Value (US$ Mn) & Volume (Units) Forecast By Market Taxonomy, 2022-2032
11.2.1. By Country
11.2.1.1. Germany
11.2.1.2. Italy
11.2.1.3. France
11.2.1.4. U.K.
11.2.1.5. Spain
11.2.1.6. Russia
11.2.1.7. BENELUX
11.2.1.8. Rest of Europe
11.2.2. By Product Type
11.2.3. By Type
11.2.4. By Application
11.3. Market Attractiveness Analysis
11.3.1. By Country
11.3.2. By Product Type
11.3.3. By Type
11.3.4. By Application
11.4. Key Takeaways
12. East Asia Industrial Food Slicers Analysis 2017-2021 and Forecast 2022-2032, By Country
12.1. Historical Market Size Value (US$ Mn) & Volume (Units) Trend Analysis By Market Taxonomy, 2017-2021
12.2. Market Size Value (US$ Mn) & Volume (Units) Forecast By Market Taxonomy, 2022-2032
12.2.1. By Country
12.2.1.1. China
12.2.1.2. Japan
12.2.1.3. South Korea
12.2.2. By Product Type
12.2.3. By Type
12.2.4. By Application
12.3. Market Attractiveness Analysis
12.3.1. By Country
12.3.2. By Product Type
12.3.3. By Type
12.3.4. By Application
12.4. Key Takeaways
13. South Asia Industrial Food Slicers Analysis 2017-2021 and Forecast 2022-2032, By Country
13.1. Historical Market Size Value (US$ Mn) & Volume (Units) Trend Analysis By Market Taxonomy, 2017-2021
13.2. Market Size Value (US$ Mn) & Volume (Units) Forecast By Market Taxonomy, 2022-2032
13.2.1. By Country
13.2.1.1. India
13.2.1.2. Thailand
13.2.1.3. Malaysia
13.2.1.4. Indonesia
13.2.1.5. Rest of South Asia
13.2.2. By Product Type
13.2.3. By Type
13.2.4. By Application
13.3. Market Attractiveness Analysis
13.3.1. By Country
13.3.2. By Product Type
13.3.3. By Type
13.3.4. By Application
13.4. Key Takeaways
14. Oceania Industrial Food Slicers Analysis 2017-2021 and Forecast 2022-2032, By Country
14.1. Historical Market Size Value (US$ Mn) & Volume (Units) Trend Analysis By Market Taxonomy, 2017-2021
14.2. Market Size Value (US$ Mn) & Volume (Units) Forecast By Market Taxonomy, 2022-2032
14.2.1. By Country
14.2.1.1. Australia
14.2.1.2. New Zealand
14.2.2. By Product Type
14.2.3. By Type
14.2.4. By Application
14.3. Market Attractiveness Analysis
14.3.1. By Country
14.3.2. By Product Type
14.3.3. By Type
14.3.4. By Application
14.4. Key Takeaways
15. MEA Industrial Food Slicers Analysis 2017-2021 and Forecast 2022-2032, By Country
15.1. Historical Market Size Value (US$ Mn) & Volume (Units) Trend Analysis By Market Taxonomy, 2017-2021
15.2. Market Size Value (US$ Mn) & Volume (Units) Forecast By Market Taxonomy, 2022-2032
15.2.1. By Country
15.2.1.1. GCC
15.2.1.2. Rest of MEA
15.2.2. By Product Type
15.2.3. By Type
15.2.4. By Application
15.3. Market Attractiveness Analysis
15.3.1. By Country
15.3.2. By Product Type
15.3.3. By Type
15.3.4. By Application
15.4. Key Takeaways
16. Key Countries Industrial Food Slicers Analysis
16.1. U.S.
16.1.1. Pricing Analysis
16.1.2. Market Share Analysis, 2022
16.1.2.1. By Product Type
16.1.2.2. By Type
16.1.2.3. By Application
16.2. Canada
16.2.1. Pricing Analysis
16.2.2. Market Share Analysis, 2022
16.2.2.1. By Product Type
16.2.2.2. By Type
16.2.2.3. By Application
16.3. Brazil
16.3.1. Pricing Analysis
16.3.2. Market Share Analysis, 2022
16.3.2.1. By Product Type
16.3.2.2. By Type
16.3.2.3. By Application
16.4. Mexico
16.4.1. Pricing Analysis
16.4.2. Market Share Analysis, 2022
16.4.2.1. By Product Type
16.4.2.2. By Type
16.4.2.3. By Application
16.5. Argentina
16.5.1. Pricing Analysis
16.5.2. Market Share Analysis, 2022
16.5.2.1. By Product Type
16.5.2.2. By Type
16.5.2.3. By Application
16.6. Chile
16.6.1. Pricing Analysis
16.6.2. Market Share Analysis, 2022
16.6.2.1. By Product Type
16.6.2.2. By Type
16.6.2.3. By Application
16.7. Peru
16.7.1. Pricing Analysis
16.7.2. Market Share Analysis, 2022
16.7.2.1. By Product Type
16.7.2.2. By Type
16.7.2.3. By Application
16.8. Rest of Latin America
16.8.1. Pricing Analysis
16.8.2. Market Share Analysis, 2022
16.8.2.1. By Product Type
16.8.2.2. By Type
16.8.2.3. By Application
16.9. Germany
16.9.1. Pricing Analysis
16.9.2. Market Share Analysis, 2022
16.9.2.1. By Product Type
16.9.2.2. By Type
16.9.2.3. By Application
16.10. Italy
16.10.1. Pricing Analysis
16.10.2. Market Share Analysis, 2022
16.10.2.1. By Product Type
16.10.2.2. By Type
16.10.2.3. By Application
16.11. France
16.11.1. Pricing Analysis
16.11.2. Market Share Analysis, 2022
16.11.2.1. By Product Type
16.11.2.2. By Type
16.11.2.3. By Application
16.12. U.K.
16.12.1. Pricing Analysis
16.12.2. Market Share Analysis, 2022
16.12.2.1. By Product Type
16.12.2.2. By Type
16.12.2.3. By Application
16.13. Spain
16.13.1. Pricing Analysis
16.13.2. Market Share Analysis, 2022
16.13.2.1. By Product Type
16.13.2.2. By Type
16.13.2.3. By Application
16.14. Russia
16.14.1. Pricing Analysis
16.14.2. Market Share Analysis, 2022
16.14.2.1. By Product Type
16.14.2.2. By Type
16.14.2.3. By Application
16.15. BENELUX
16.15.1. Pricing Analysis
16.15.2. Market Share Analysis, 2022
16.15.2.1. By Product Type
16.15.2.2. By Type
16.15.2.3. By Application
16.16. Rest of Europe
16.16.1. Pricing Analysis
16.16.2. Market Share Analysis, 2022
16.16.2.1. By Product Type
16.16.2.2. By Type
16.16.2.3. By Application
16.17. China
16.17.1. Pricing Analysis
16.17.2. Market Share Analysis, 2022
16.17.2.1. By Product Type
16.17.2.2. By Type
16.17.2.3. By Application
16.18. Japan
16.18.1. Pricing Analysis
16.18.2. Market Share Analysis, 2022
16.18.2.1. By Product Type
16.18.2.2. By Type
16.18.2.3. By Application
16.19. South Korea
16.19.1. Pricing Analysis
16.19.2. Market Share Analysis, 2022
16.19.2.1. By Product Type
16.19.2.2. By Type
16.19.2.3. By Application
16.20. India
16.20.1. Pricing Analysis
16.20.2. Market Share Analysis, 2022
16.20.2.1. By Product Type
16.20.2.2. By Type
16.20.2.3. By Application
16.21. Thailand
16.21.1. Pricing Analysis
16.21.2. Market Share Analysis, 2022
16.21.2.1. By Product Type
16.21.2.2. By Type
16.21.2.3. By Application
16.22. Malaysia
16.22.1. Pricing Analysis
16.22.2. Market Share Analysis, 2022
16.22.2.1. By Product Type
16.22.2.2. By Type
16.22.2.3. By Application
16.23. Indonesia
16.23.1. Pricing Analysis
16.23.2. Market Share Analysis, 2022
16.23.2.1. By Product Type
16.23.2.2. By Type
16.23.2.3. By Application
16.24. Rest of South Asia
16.24.1. Pricing Analysis
16.24.2. Market Share Analysis, 2022
16.24.2.1. By Product Type
16.24.2.2. By Type
16.24.2.3. By Application
16.25. Australia
16.25.1. Pricing Analysis
16.25.2. Market Share Analysis, 2022
16.25.2.1. By Product Type
16.25.2.2. By Type
16.25.2.3. By Application
16.26. New Zealand
16.26.1. Pricing Analysis
16.26.2. Market Share Analysis, 2022
16.26.2.1. By Product Type
16.26.2.2. By Type
16.26.2.3. By Application
16.27. GCC
16.27.1. Pricing Analysis
16.27.2. Market Share Analysis, 2022
16.27.2.1. By Product Type
16.27.2.2. By Type
16.27.2.3. By Application
16.28. Rest of MEA
16.28.1. Pricing Analysis
16.28.2. Market Share Analysis, 2022
16.28.2.1. By Product Type
16.28.2.2. By Type
16.28.2.3. By Application
17. Market Structure Analysis
17.1. Competition Dashboard
17.2. Competition Benchmarking
17.3. Market Share Analysis of Top Players
17.3.1. By Regional
17.3.2. By Product Type
17.3.3. By Type
17.3.4. By Application
18. Competition Analysis
18.1. Competition Deep Dive
18.1.1. Hobart
18.1.1.1. Overview
18.1.1.2. Product Portfolio
18.1.1.3. Profitability by Market Segments (Product/Age /Sales Channel/Region)
18.1.1.4. Sales Footprint
18.1.1.5. Strategy Overview
18.1.1.5.1. Marketing Strategy
18.1.1.5.2. Product Strategy
18.1.1.5.3. Channel Strategy
18.1.2. Berkel
18.1.2.1. Overview
18.1.2.2. Product Portfolio
18.1.2.3. Profitability by Market Segments (Product/Age /Sales Channel/Region)
18.1.2.4. Sales Footprint
18.1.2.5. Strategy Overview
18.1.2.5.1. Marketing Strategy
18.1.2.5.2. Product Strategy
18.1.2.5.3. Channel Strategy
18.1.3. Vollrath
18.1.3.1. Overview
18.1.3.2. Product Portfolio
18.1.3.3. Profitability by Market Segments (Product/Age /Sales Channel/Region)
18.1.3.4. Sales Footprint
18.1.3.5. Strategy Overview
18.1.3.5.1. Marketing Strategy
18.1.3.5.2. Product Strategy
18.1.3.5.3. Channel Strategy
18.1.4. Bizerba
18.1.4.1. Overview
18.1.4.2. Product Portfolio
18.1.4.3. Profitability by Market Segments (Product/Age /Sales Channel/Region)
18.1.4.4. Sales Footprint
18.1.4.5. Strategy Overview
18.1.4.5.1. Marketing Strategy
18.1.4.5.2. Product Strategy
18.1.4.5.3. Channel Strategy
18.1.5. KWS
18.1.5.1. Overview
18.1.5.2. Product Portfolio
18.1.5.3. Profitability by Market Segments (Product/Age /Sales Channel/Region)
18.1.5.4. Sales Footprint
18.1.5.5. Strategy Overview
18.1.5.5.1. Marketing Strategy
18.1.5.5.2. Product Strategy
18.1.5.5.3. Channel Strategy
18.1.6. Nemco Food Equipment Ltd.
18.1.6.1. Overview
18.1.6.2. Product Portfolio
18.1.6.3. Profitability by Market Segments (Product/Age /Sales Channel/Region)
18.1.6.4. Sales Footprint
18.1.6.5. Strategy Overview
18.1.6.5.1. Marketing Strategy
18.1.6.5.2. Product Strategy
18.1.6.5.3. Channel Strategy
18.1.7. Beswood
18.1.7.1. Overview
18.1.7.2. Product Portfolio
18.1.7.3. Profitability by Market Segments (Product/Age /Sales Channel/Region)
18.1.7.4. Sales Footprint
18.1.7.5. Strategy Overview
18.1.7.5.1. Marketing Strategy
18.1.7.5.2. Product Strategy
18.1.7.5.3. Channel Strategy
18.1.8. Estella
18.1.8.1. Overview
18.1.8.2. Product Portfolio
18.1.8.3. Profitability by Market Segments (Product/Age /Sales Channel/Region)
18.1.8.4. Sales Footprint
18.1.8.5. Strategy Overview
18.1.8.5.1. Marketing Strategy
18.1.8.5.2. Product Strategy
18.1.8.5.3. Channel Strategy
18.1.9. Doyon Equipment Inc
18.1.9.1. Overview
18.1.9.2. Product Portfolio
18.1.9.3. Profitability by Market Segments (Product/Age /Sales Channel/Region)
18.1.9.4. Sales Footprint
18.1.9.5. Strategy Overview
18.1.9.5.1. Marketing Strategy
18.1.9.5.2. Product Strategy
18.1.9.5.3. Channel Strategy
18.1.10. Edlund
18.1.10.1. Overview
18.1.10.2. Product Portfolio
18.1.10.3. Profitability by Market Segments (Product/Age /Sales Channel/Region)
18.1.10.4. Sales Footprint
18.1.10.5. Strategy Overview
18.1.10.5.1. Marketing Strategy
18.1.10.5.2. Product Strategy
18.1.10.5.3. Channel Strategy
18.1.11. Vevor
18.1.11.1. Overview
18.1.11.2. Product Portfolio
18.1.11.3. Profitability by Market Segments (Product/Age /Sales Channel/Region)
18.1.11.4. Sales Footprint
18.1.11.5. Strategy Overview
18.1.11.5.1. Marketing Strategy
18.1.11.5.2. Product Strategy
18.1.11.5.3. Channel Strategy
18.1.12. Garde
18.1.12.1. Overview
18.1.12.2. Product Portfolio
18.1.12.3. Profitability by Market Segments (Product/Age /Sales Channel/Region)
18.1.12.4. Sales Footprint
18.1.12.5. Strategy Overview
18.1.12.5.1. Marketing Strategy
18.1.12.5.2. Product Strategy
18.1.12.5.3. Channel Strategy
18.1.13. Omcan
18.1.13.1. Overview
18.1.13.2. Product Portfolio
18.1.13.3. Profitability by Market Segments (Product/Age /Sales Channel/Region)
18.1.13.4. Sales Footprint
18.1.13.5. Strategy Overview
18.1.13.5.1. Marketing Strategy
18.1.13.5.2. Product Strategy
18.1.13.5.3. Channel Strategy
18.1.14. LEM Products
18.1.14.1. Overview
18.1.14.2. Product Portfolio
18.1.14.3. Profitability by Market Segments (Product/Age /Sales Channel/Region)
18.1.14.4. Sales Footprint
18.1.14.5. Strategy Overview
18.1.14.5.1. Marketing Strategy
18.1.14.5.2. Product Strategy
18.1.14.5.3. Channel Strategy
19. Assumptions & Acronyms Used
20. Research Methodology
Let us know your requirement to get
100% FREE customization
Table 1: Global Industrial Food Slicers Value (US$ Mn) Forecast by Region, 2017-2032
Table 2: Global Industrial Food Slicers Volume (Units) Forecast by Region, 2017-2032
Table 3: Global Industrial Food Slicers Value (US$ Mn) Forecast by Product Type, 2017-2032
Table 4: Global Industrial Food Slicers Volume (Units) Forecast by Product Type, 2017-2032
Table 5: Global Industrial Food Slicers Value (US$ Mn) Forecast by Type, 2017-2032
Table 6: Global Industrial Food Slicers Volume (Units) Forecast by Type, 2017-2032
Table 7: Global Industrial Food Slicers Value (US$ Mn) Forecast by Application, 2017-2032
Table 8: Global Industrial Food Slicers Volume (Units) Forecast by Application, 2017-2032
Table 9: North America Industrial Food Slicers Value (US$ Mn) Forecast by Country, 2017-2032
Table 10: North America Industrial Food Slicers Volume (Units) Forecast by Country, 2017-2032
Table 11: North America Industrial Food Slicers Value (US$ Mn) Forecast by Product Type, 2017-2032
Table 12: North America Industrial Food Slicers Volume (Units) Forecast by Product Type, 2017-2032
Table 13: North America Industrial Food Slicers Value (US$ Mn) Forecast by Type, 2017-2032
Table 14: North America Industrial Food Slicers Volume (Units) Forecast by Type, 2017-2032
Table 15: North America Industrial Food Slicers Value (US$ Mn) Forecast by Application, 2017-2032
Table 16: North America Industrial Food Slicers Volume (Units) Forecast by Application, 2017-2032
Table 17: Latin America Industrial Food Slicers Value (US$ Mn) Forecast by Country, 2017-2032
Table 18: Latin America Industrial Food Slicers Volume (Units) Forecast by Country, 2017-2032
Table 19: Latin America Industrial Food Slicers Value (US$ Mn) Forecast by Product Type, 2017-2032
Table 20: Latin America Industrial Food Slicers Volume (Units) Forecast by Product Type, 2017-2032
Table 21: Latin America Industrial Food Slicers Value (US$ Mn) Forecast by Type, 2017-2032
Table 22: Latin America Industrial Food Slicers Volume (Units) Forecast by Type, 2017-2032
Table 23: Latin America Industrial Food Slicers Value (US$ Mn) Forecast by Application, 2017-2032
Table 24: Latin America Industrial Food Slicers Volume (Units) Forecast by Application, 2017-2032
Table 25: Europe Industrial Food Slicers Value (US$ Mn) Forecast by Country, 2017-2032
Table 26: Europe Industrial Food Slicers Volume (Units) Forecast by Country, 2017-2032
Table 27: Europe Industrial Food Slicers Value (US$ Mn) Forecast by Product Type, 2017-2032
Table 28: Europe Industrial Food Slicers Volume (Units) Forecast by Product Type, 2017-2032
Table 29: Europe Industrial Food Slicers Value (US$ Mn) Forecast by Type, 2017-2032
Table 30: Europe Industrial Food Slicers Volume (Units) Forecast by Type, 2017-2032
Table 31: Europe Industrial Food Slicers Value (US$ Mn) Forecast by Application, 2017-2032
Table 32: Europe Industrial Food Slicers Volume (Units) Forecast by Application, 2017-2032
Table 33: East Asia Industrial Food Slicers Value (US$ Mn) Forecast by Country, 2017-2032
Table 34: East Asia Industrial Food Slicers Volume (Units) Forecast by Country, 2017-2032
Table 35: East Asia Industrial Food Slicers Value (US$ Mn) Forecast by Product Type, 2017-2032
Table 36: East Asia Industrial Food Slicers Volume (Units) Forecast by Product Type, 2017-2032
Table 37: East Asia Industrial Food Slicers Value (US$ Mn) Forecast by Type, 2017-2032
Table 38: East Asia Industrial Food Slicers Volume (Units) Forecast by Type, 2017-2032
Table 39: East Asia Industrial Food Slicers Value (US$ Mn) Forecast by Application, 2017-2032
Table 40: East Asia Industrial Food Slicers Volume (Units) Forecast by Application, 2017-2032
Table 41: South Asia Industrial Food Slicers Value (US$ Mn) Forecast by Country, 2017-2032
Table 42: South Asia Industrial Food Slicers Volume (Units) Forecast by Country, 2017-2032
Table 43: South Asia Industrial Food Slicers Value (US$ Mn) Forecast by Product Type, 2017-2032
Table 44: South Asia Industrial Food Slicers Volume (Units) Forecast by Product Type, 2017-2032
Table 45: South Asia Industrial Food Slicers Value (US$ Mn) Forecast by Type, 2017-2032
Table 46: South Asia Industrial Food Slicers Volume (Units) Forecast by Type, 2017-2032
Table 47: South Asia Industrial Food Slicers Value (US$ Mn) Forecast by Application, 2017-2032
Table 48: South Asia Industrial Food Slicers Volume (Units) Forecast by Application, 2017-2032
Table 49: Oceania Industrial Food Slicers Value (US$ Mn) Forecast by Country, 2017-2032
Table 50: Oceania Industrial Food Slicers Volume (Units) Forecast by Country, 2017-2032
Table 51: Oceania Industrial Food Slicers Value (US$ Mn) Forecast by Product Type, 2017-2032
Table 52: Oceania Industrial Food Slicers Volume (Units) Forecast by Product Type, 2017-2032
Table 53: Oceania Industrial Food Slicers Value (US$ Mn) Forecast by Type, 2017-2032
Table 54: Oceania Industrial Food Slicers Volume (Units) Forecast by Type, 2017-2032
Table 55: Oceania Industrial Food Slicers Value (US$ Mn) Forecast by Application, 2017-2032
Table 56: Oceania Industrial Food Slicers Volume (Units) Forecast by Application, 2017-2032
Table 57: MEA Industrial Food Slicers Value (US$ Mn) Forecast by Country, 2017-2032
Table 58: MEA Industrial Food Slicers Volume (Units) Forecast by Country, 2017-2032
Table 59: MEA Industrial Food Slicers Value (US$ Mn) Forecast by Product Type, 2017-2032
Table 60: MEA Industrial Food Slicers Volume (Units) Forecast by Product Type, 2017-2032
Table 61: MEA Industrial Food Slicers Value (US$ Mn) Forecast by Type, 2017-2032
Table 62: MEA Industrial Food Slicers Volume (Units) Forecast by Type, 2017-2032
Table 63: MEA Industrial Food Slicers Value (US$ Mn) Forecast by Application, 2017-2032
Table 64: MEA Industrial Food Slicers Volume (Units) Forecast by Application, 2017-2032
Find your sweet spots for generating winning opportunities in this market.
Talk to AnalystFigure 1: Global Industrial Food Slicers Value (US$ Mn) by Product Type, 2022-2032
Figure 2: Global Industrial Food Slicers Value (US$ Mn) by Type, 2022-2032
Figure 3: Global Industrial Food Slicers Value (US$ Mn) by Application, 2022-2032
Figure 4: Global Industrial Food Slicers Value (US$ Mn) by Region, 2022-2032
Figure 5: Global Industrial Food Slicers Value (US$ Mn) Analysis by Region, 2017-2032
Figure 6: Global Industrial Food Slicers Volume (Units) Analysis by Region, 2017-2032
Figure 7: Global Industrial Food Slicers Value Share (%) and BPS Analysis by Region, 2022-2032
Figure 8: Global Industrial Food Slicers Y-o-Y Growth (%) Projections by Region, 2022-2032
Figure 9: Global Industrial Food Slicers Value (US$ Mn) Analysis by Product Type, 2017-2032
Figure 10: Global Industrial Food Slicers Volume (Units) Analysis by Product Type, 2017-2032
Figure 11: Global Industrial Food Slicers Value Share (%) and BPS Analysis by Product Type, 2022-2032
Figure 12: Global Industrial Food Slicers Y-o-Y Growth (%) Projections by Product Type, 2022-2032
Figure 13: Global Industrial Food Slicers Value (US$ Mn) Analysis by Type, 2017-2032
Figure 14: Global Industrial Food Slicers Volume (Units) Analysis by Type, 2017-2032
Figure 15: Global Industrial Food Slicers Value Share (%) and BPS Analysis by Type, 2022-2032
Figure 16: Global Industrial Food Slicers Y-o-Y Growth (%) Projections by Type, 2022-2032
Figure 17: Global Industrial Food Slicers Value (US$ Mn) Analysis by Application, 2017-2032
Figure 18: Global Industrial Food Slicers Volume (Units) Analysis by Application, 2017-2032
Figure 19: Global Industrial Food Slicers Value Share (%) and BPS Analysis by Application, 2022-2032
Figure 20: Global Industrial Food Slicers Y-o-Y Growth (%) Projections by Application, 2022-2032
Figure 21: Global Industrial Food Slicers Attractiveness by Product Type, 2022-2032
Figure 22: Global Industrial Food Slicers Attractiveness by Type, 2022-2032
Figure 23: Global Industrial Food Slicers Attractiveness by Application, 2022-2032
Figure 24: Global Industrial Food Slicers Attractiveness by Region, 2022-2032
Figure 25: North America Industrial Food Slicers Value (US$ Mn) by Product Type, 2022-2032
Figure 26: North America Industrial Food Slicers Value (US$ Mn) by Type, 2022-2032
Figure 27: North America Industrial Food Slicers Value (US$ Mn) by Application, 2022-2032
Figure 28: North America Industrial Food Slicers Value (US$ Mn) by Country, 2022-2032
Figure 29: North America Industrial Food Slicers Value (US$ Mn) Analysis by Country, 2017-2032
Figure 30: North America Industrial Food Slicers Volume (Units) Analysis by Country, 2017-2032
Figure 31: North America Industrial Food Slicers Value Share (%) and BPS Analysis by Country, 2022-2032
Figure 32: North America Industrial Food Slicers Y-o-Y Growth (%) Projections by Country, 2022-2032
Figure 33: North America Industrial Food Slicers Value (US$ Mn) Analysis by Product Type, 2017-2032
Figure 34: North America Industrial Food Slicers Volume (Units) Analysis by Product Type, 2017-2032
Figure 35: North America Industrial Food Slicers Value Share (%) and BPS Analysis by Product Type, 2022-2032
Figure 36: North America Industrial Food Slicers Y-o-Y Growth (%) Projections by Product Type, 2022-2032
Figure 37: North America Industrial Food Slicers Value (US$ Mn) Analysis by Type, 2017-2032
Figure 38: North America Industrial Food Slicers Volume (Units) Analysis by Type, 2017-2032
Figure 39: North America Industrial Food Slicers Value Share (%) and BPS Analysis by Type, 2022-2032
Figure 40: North America Industrial Food Slicers Y-o-Y Growth (%) Projections by Type, 2022-2032
Figure 41: North America Industrial Food Slicers Value (US$ Mn) Analysis by Application, 2017-2032
Figure 42: North America Industrial Food Slicers Volume (Units) Analysis by Application, 2017-2032
Figure 43: North America Industrial Food Slicers Value Share (%) and BPS Analysis by Application, 2022-2032
Figure 44: North America Industrial Food Slicers Y-o-Y Growth (%) Projections by Application, 2022-2032
Figure 45: North America Industrial Food Slicers Attractiveness by Product Type, 2022-2032
Figure 46: North America Industrial Food Slicers Attractiveness by Type, 2022-2032
Figure 47: North America Industrial Food Slicers Attractiveness by Application, 2022-2032
Figure 48: North America Industrial Food Slicers Attractiveness by Country, 2022-2032
Figure 49: Latin America Industrial Food Slicers Value (US$ Mn) by Product Type, 2022-2032
Figure 50: Latin America Industrial Food Slicers Value (US$ Mn) by Type, 2022-2032
Figure 51: Latin America Industrial Food Slicers Value (US$ Mn) by Application, 2022-2032
Figure 52: Latin America Industrial Food Slicers Value (US$ Mn) by Country, 2022-2032
Figure 53: Latin America Industrial Food Slicers Value (US$ Mn) Analysis by Country, 2017-2032
Figure 54: Latin America Industrial Food Slicers Volume (Units) Analysis by Country, 2017-2032
Figure 55: Latin America Industrial Food Slicers Value Share (%) and BPS Analysis by Country, 2022-2032
Figure 56: Latin America Industrial Food Slicers Y-o-Y Growth (%) Projections by Country, 2022-2032
Figure 57: Latin America Industrial Food Slicers Value (US$ Mn) Analysis by Product Type, 2017-2032
Figure 58: Latin America Industrial Food Slicers Volume (Units) Analysis by Product Type, 2017-2032
Figure 59: Latin America Industrial Food Slicers Value Share (%) and BPS Analysis by Product Type, 2022-2032
Figure 60: Latin America Industrial Food Slicers Y-o-Y Growth (%) Projections by Product Type, 2022-2032
Figure 61: Latin America Industrial Food Slicers Value (US$ Mn) Analysis by Type, 2017-2032
Figure 62: Latin America Industrial Food Slicers Volume (Units) Analysis by Type, 2017-2032
Figure 63: Latin America Industrial Food Slicers Value Share (%) and BPS Analysis by Type, 2022-2032
Figure 64: Latin America Industrial Food Slicers Y-o-Y Growth (%) Projections by Type, 2022-2032
Figure 65: Latin America Industrial Food Slicers Value (US$ Mn) Analysis by Application, 2017-2032
Figure 66: Latin America Industrial Food Slicers Volume (Units) Analysis by Application, 2017-2032
Figure 67: Latin America Industrial Food Slicers Value Share (%) and BPS Analysis by Application, 2022-2032
Figure 68: Latin America Industrial Food Slicers Y-o-Y Growth (%) Projections by Application, 2022-2032
Figure 69: Latin America Industrial Food Slicers Attractiveness by Product Type, 2022-2032
Figure 70: Latin America Industrial Food Slicers Attractiveness by Type, 2022-2032
Figure 71: Latin America Industrial Food Slicers Attractiveness by Application, 2022-2032
Figure 72: Latin America Industrial Food Slicers Attractiveness by Country, 2022-2032
Figure 73: Europe Industrial Food Slicers Value (US$ Mn) by Product Type, 2022-2032
Figure 74: Europe Industrial Food Slicers Value (US$ Mn) by Type, 2022-2032
Figure 75: Europe Industrial Food Slicers Value (US$ Mn) by Application, 2022-2032
Figure 76: Europe Industrial Food Slicers Value (US$ Mn) by Country, 2022-2032
Figure 77: Europe Industrial Food Slicers Value (US$ Mn) Analysis by Country, 2017-2032
Figure 78: Europe Industrial Food Slicers Volume (Units) Analysis by Country, 2017-2032
Figure 79: Europe Industrial Food Slicers Value Share (%) and BPS Analysis by Country, 2022-2032
Figure 80: Europe Industrial Food Slicers Y-o-Y Growth (%) Projections by Country, 2022-2032
Figure 81: Europe Industrial Food Slicers Value (US$ Mn) Analysis by Product Type, 2017-2032
Figure 82: Europe Industrial Food Slicers Volume (Units) Analysis by Product Type, 2017-2032
Figure 83: Europe Industrial Food Slicers Value Share (%) and BPS Analysis by Product Type, 2022-2032
Figure 84: Europe Industrial Food Slicers Y-o-Y Growth (%) Projections by Product Type, 2022-2032
Figure 85: Europe Industrial Food Slicers Value (US$ Mn) Analysis by Type, 2017-2032
Figure 86: Europe Industrial Food Slicers Volume (Units) Analysis by Type, 2017-2032
Figure 87: Europe Industrial Food Slicers Value Share (%) and BPS Analysis by Type, 2022-2032
Figure 88: Europe Industrial Food Slicers Y-o-Y Growth (%) Projections by Type, 2022-2032
Figure 89: Europe Industrial Food Slicers Value (US$ Mn) Analysis by Application, 2017-2032
Figure 90: Europe Industrial Food Slicers Volume (Units) Analysis by Application, 2017-2032
Figure 91: Europe Industrial Food Slicers Value Share (%) and BPS Analysis by Application, 2022-2032
Figure 92: Europe Industrial Food Slicers Y-o-Y Growth (%) Projections by Application, 2022-2032
Figure 93: Europe Industrial Food Slicers Attractiveness by Product Type, 2022-2032
Figure 94: Europe Industrial Food Slicers Attractiveness by Type, 2022-2032
Figure 95: Europe Industrial Food Slicers Attractiveness by Application, 2022-2032
Figure 96: Europe Industrial Food Slicers Attractiveness by Country, 2022-2032
Figure 97: East Asia Industrial Food Slicers Value (US$ Mn) by Product Type, 2022-2032
Figure 98: East Asia Industrial Food Slicers Value (US$ Mn) by Type, 2022-2032
Figure 99: East Asia Industrial Food Slicers Value (US$ Mn) by Application, 2022-2032
Figure 100: East Asia Industrial Food Slicers Value (US$ Mn) by Country, 2022-2032
Figure 101: East Asia Industrial Food Slicers Value (US$ Mn) Analysis by Country, 2017-2032
Figure 102: East Asia Industrial Food Slicers Volume (Units) Analysis by Country, 2017-2032
Figure 103: East Asia Industrial Food Slicers Value Share (%) and BPS Analysis by Country, 2022-2032
Figure 104: East Asia Industrial Food Slicers Y-o-Y Growth (%) Projections by Country, 2022-2032
Figure 105: East Asia Industrial Food Slicers Value (US$ Mn) Analysis by Product Type, 2017-2032
Figure 106: East Asia Industrial Food Slicers Volume (Units) Analysis by Product Type, 2017-2032
Figure 107: East Asia Industrial Food Slicers Value Share (%) and BPS Analysis by Product Type, 2022-2032
Figure 108: East Asia Industrial Food Slicers Y-o-Y Growth (%) Projections by Product Type, 2022-2032
Figure 109: East Asia Industrial Food Slicers Value (US$ Mn) Analysis by Type, 2017-2032
Figure 110: East Asia Industrial Food Slicers Volume (Units) Analysis by Type, 2017-2032
Figure 111: East Asia Industrial Food Slicers Value Share (%) and BPS Analysis by Type, 2022-2032
Figure 112: East Asia Industrial Food Slicers Y-o-Y Growth (%) Projections by Type, 2022-2032
Figure 113: East Asia Industrial Food Slicers Value (US$ Mn) Analysis by Application, 2017-2032
Figure 114: East Asia Industrial Food Slicers Volume (Units) Analysis by Application, 2017-2032
Figure 115: East Asia Industrial Food Slicers Value Share (%) and BPS Analysis by Application, 2022-2032
Figure 116: East Asia Industrial Food Slicers Y-o-Y Growth (%) Projections by Application, 2022-2032
Figure 117: East Asia Industrial Food Slicers Attractiveness by Product Type, 2022-2032
Figure 118: East Asia Industrial Food Slicers Attractiveness by Type, 2022-2032
Figure 119: East Asia Industrial Food Slicers Attractiveness by Application, 2022-2032
Figure 120: East Asia Industrial Food Slicers Attractiveness by Country, 2022-2032
Figure 121: South Asia Industrial Food Slicers Value (US$ Mn) by Product Type, 2022-2032
Figure 122: South Asia Industrial Food Slicers Value (US$ Mn) by Type, 2022-2032
Figure 123: South Asia Industrial Food Slicers Value (US$ Mn) by Application, 2022-2032
Figure 124: South Asia Industrial Food Slicers Value (US$ Mn) by Country, 2022-2032
Figure 125: South Asia Industrial Food Slicers Value (US$ Mn) Analysis by Country, 2017-2032
Figure 126: South Asia Industrial Food Slicers Volume (Units) Analysis by Country, 2017-2032
Figure 127: South Asia Industrial Food Slicers Value Share (%) and BPS Analysis by Country, 2022-2032
Figure 128: South Asia Industrial Food Slicers Y-o-Y Growth (%) Projections by Country, 2022-2032
Figure 129: South Asia Industrial Food Slicers Value (US$ Mn) Analysis by Product Type, 2017-2032
Figure 130: South Asia Industrial Food Slicers Volume (Units) Analysis by Product Type, 2017-2032
Figure 131: South Asia Industrial Food Slicers Value Share (%) and BPS Analysis by Product Type, 2022-2032
Figure 132: South Asia Industrial Food Slicers Y-o-Y Growth (%) Projections by Product Type, 2022-2032
Figure 133: South Asia Industrial Food Slicers Value (US$ Mn) Analysis by Type, 2017-2032
Figure 134: South Asia Industrial Food Slicers Volume (Units) Analysis by Type, 2017-2032
Figure 135: South Asia Industrial Food Slicers Value Share (%) and BPS Analysis by Type, 2022-2032
Figure 136: South Asia Industrial Food Slicers Y-o-Y Growth (%) Projections by Type, 2022-2032
Figure 137: South Asia Industrial Food Slicers Value (US$ Mn) Analysis by Application, 2017-2032
Figure 138: South Asia Industrial Food Slicers Volume (Units) Analysis by Application, 2017-2032
Figure 139: South Asia Industrial Food Slicers Value Share (%) and BPS Analysis by Application, 2022-2032
Figure 140: South Asia Industrial Food Slicers Y-o-Y Growth (%) Projections by Application, 2022-2032
Figure 141: South Asia Industrial Food Slicers Attractiveness by Product Type, 2022-2032
Figure 142: South Asia Industrial Food Slicers Attractiveness by Type, 2022-2032
Figure 143: South Asia Industrial Food Slicers Attractiveness by Application, 2022-2032
Figure 144: South Asia Industrial Food Slicers Attractiveness by Country, 2022-2032
Figure 145: Oceania Industrial Food Slicers Value (US$ Mn) by Product Type, 2022-2032
Figure 146: Oceania Industrial Food Slicers Value (US$ Mn) by Type, 2022-2032
Figure 147: Oceania Industrial Food Slicers Value (US$ Mn) by Application, 2022-2032
Figure 148: Oceania Industrial Food Slicers Value (US$ Mn) by Country, 2022-2032
Figure 149: Oceania Industrial Food Slicers Value (US$ Mn) Analysis by Country, 2017-2032
Figure 150: Oceania Industrial Food Slicers Volume (Units) Analysis by Country, 2017-2032
Figure 151: Oceania Industrial Food Slicers Value Share (%) and BPS Analysis by Country, 2022-2032
Figure 152: Oceania Industrial Food Slicers Y-o-Y Growth (%) Projections by Country, 2022-2032
Figure 153: Oceania Industrial Food Slicers Value (US$ Mn) Analysis by Product Type, 2017-2032
Figure 154: Oceania Industrial Food Slicers Volume (Units) Analysis by Product Type, 2017-2032
Figure 155: Oceania Industrial Food Slicers Value Share (%) and BPS Analysis by Product Type, 2022-2032
Figure 156: Oceania Industrial Food Slicers Y-o-Y Growth (%) Projections by Product Type, 2022-2032
Figure 157: Oceania Industrial Food Slicers Value (US$ Mn) Analysis by Type, 2017-2032
Figure 158: Oceania Industrial Food Slicers Volume (Units) Analysis by Type, 2017-2032
Figure 159: Oceania Industrial Food Slicers Value Share (%) and BPS Analysis by Type, 2022-2032
Figure 160: Oceania Industrial Food Slicers Y-o-Y Growth (%) Projections by Type, 2022-2032
Figure 161: Oceania Industrial Food Slicers Value (US$ Mn) Analysis by Application, 2017-2032
Figure 162: Oceania Industrial Food Slicers Volume (Units) Analysis by Application, 2017-2032
Figure 163: Oceania Industrial Food Slicers Value Share (%) and BPS Analysis by Application, 2022-2032
Figure 164: Oceania Industrial Food Slicers Y-o-Y Growth (%) Projections by Application, 2022-2032
Figure 165: Oceania Industrial Food Slicers Attractiveness by Product Type, 2022-2032
Figure 166: Oceania Industrial Food Slicers Attractiveness by Type, 2022-2032
Figure 167: Oceania Industrial Food Slicers Attractiveness by Application, 2022-2032
Figure 168: Oceania Industrial Food Slicers Attractiveness by Country, 2022-2032
Figure 169: MEA Industrial Food Slicers Value (US$ Mn) by Product Type, 2022-2032
Figure 170: MEA Industrial Food Slicers Value (US$ Mn) by Type, 2022-2032
Figure 171: MEA Industrial Food Slicers Value (US$ Mn) by Application, 2022-2032
Figure 172: MEA Industrial Food Slicers Value (US$ Mn) by Country, 2022-2032
Figure 173: MEA Industrial Food Slicers Value (US$ Mn) Analysis by Country, 2017-2032
Figure 174: MEA Industrial Food Slicers Volume (Units) Analysis by Country, 2017-2032
Figure 175: MEA Industrial Food Slicers Value Share (%) and BPS Analysis by Country, 2022-2032
Figure 176: MEA Industrial Food Slicers Y-o-Y Growth (%) Projections by Country, 2022-2032
Figure 177: MEA Industrial Food Slicers Value (US$ Mn) Analysis by Product Type, 2017-2032
Figure 178: MEA Industrial Food Slicers Volume (Units) Analysis by Product Type, 2017-2032
Figure 179: MEA Industrial Food Slicers Value Share (%) and BPS Analysis by Product Type, 2022-2032
Figure 180: MEA Industrial Food Slicers Y-o-Y Growth (%) Projections by Product Type, 2022-2032
Figure 181: MEA Industrial Food Slicers Value (US$ Mn) Analysis by Type, 2017-2032
Figure 182: MEA Industrial Food Slicers Volume (Units) Analysis by Type, 2017-2032
Figure 183: MEA Industrial Food Slicers Value Share (%) and BPS Analysis by Type, 2022-2032
Figure 184: MEA Industrial Food Slicers Y-o-Y Growth (%) Projections by Type, 2022-2032
Figure 185: MEA Industrial Food Slicers Value (US$ Mn) Analysis by Application, 2017-2032
Figure 186: MEA Industrial Food Slicers Volume (Units) Analysis by Application, 2017-2032
Figure 187: MEA Industrial Food Slicers Value Share (%) and BPS Analysis by Application, 2022-2032
Figure 188: MEA Industrial Food Slicers Y-o-Y Growth (%) Projections by Application, 2022-2032
Figure 189: MEA Industrial Food Slicers Attractiveness by Product Type, 2022-2032
Figure 190: MEA Industrial Food Slicers Attractiveness by Type, 2022-2032
Figure 191: MEA Industrial Food Slicers Attractiveness by Application, 2022-2032
Figure 192: MEA Industrial Food Slicers Attractiveness by Country, 2022-2032
Need specific information?
Request CustomizationExplore Food and Beverage Insights
View Reports