The India industrial lubricants market is projected to expand from USD 59.4 billion in 2025 to USD 86.8 billion by 2035, reflecting a compound annual growth rate (CAGR) of 3.8%. Growth is expected to be driven by increased domestic manufacturing, infrastructure investment, and rising awareness of predictive maintenance practices across key industries such as steel, cement, textiles, and chemicals.
| Metrics | Values |
|---|---|
| Industry Size (2025E) | USD 59.4 billion |
| Industry Value (2035F) | USD 86.8 billion |
| CAGR | 3.8% |
Government initiatives aimed at strengthening the industrial base, including the Make in India program and the Production Linked Incentive (PLI) schemes, have encouraged capacity expansion in sectors such as mining, transportation, construction, and general engineering. This expansion is increasing the operational intensity of machinery and equipment, thereby supporting consistent demand for industrial-grade lubricants.
Regulatory developments have also influenced market dynamics. The introduction of Extended Producer Responsibility (EPR) for used oils, which came into effect from April 2024, mandates that lubricant manufacturers and importers facilitate responsible collection and recycling of spent oils. This framework is aligning the lubricant value chain with circular economy principles and is prompting investments in used oil collection and re-refining infrastructure.
Crude oil price volatility observed between 2020 and 2022, primarily due to pandemic-related disruptions, had affected the input cost structure for mineral-based lubricants. Stabilization in 2023 enabled lubricant producers to secure long-term feedstock contracts and refine procurement strategies. This period also marked the beginning of a gradual transition toward synthetic and bio-based lubricants, particularly in high-temperature and heavy-duty applications.
Manufacturers have invested in research and development to meet evolving industrial performance specifications. Formulations optimized for energy efficiency, thermal stability, and extended drain intervals have gained traction. Lubricants tailored for wind turbines, automated production lines, and electric vehicle components have been introduced to address sector-specific needs. For example, synthetic gear oils formulated by Castrol and thermal-resistant turbine oils by IOCL have been developed to support newer technologies in manufacturing and power generation.
Geographically, demand has remained concentrated in South and West India due to the presence of large-scale industrial operations and port-based trade activity. Gujarat’s petrochemical hub and Maharashtra’s automotive and machinery clusters have emerged as major consumption centers, with infrastructure readiness supporting both lubricant storage and distribution.
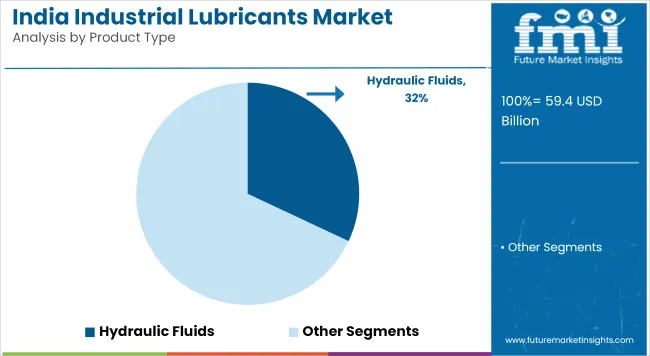
Hydraulic fluids are estimated to account for the largest share of the India industrial lubricants market in 2025, holding approximately 32% of total market revenue. The segment is projected to grow at a CAGR of 4.0% through 2035. These fluids play a vital role in enabling equipment functionality across sectors such as construction, mining, material handling, and general manufacturing.
Rising infrastructure investment and expanding usage of earthmoving and road-building machinery are key contributors to segment growth. Government-led initiatives like “Make in India” and increased capital spending on industrial modernization support sustained lubricant demand.
Hydraulic fluids are widely applied in injection molding units, presses, lift systems, and mobile cranes. Market offerings now include zinc-free and biodegradable variants to comply with emerging environmental standards. Demand is also supported by usage in machine tools and high-pressure hydraulic systems. Growth is tied to maintenance reliability, equipment longevity, and efficiency gains under demanding operational conditions.

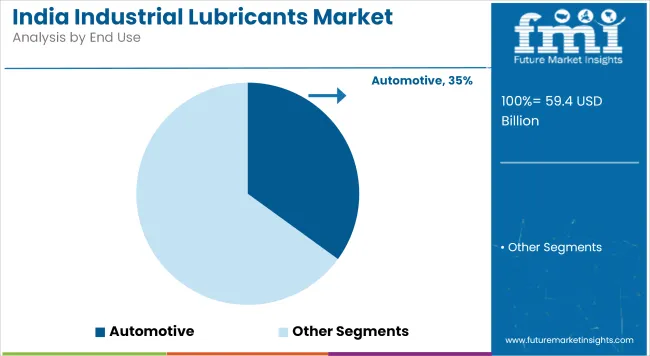
The automotive sector is projected to contribute around 35% of the industrial lubricants market value in 2025. It is expected to grow at a CAGR of 5.0% through 2035. The sector includes passenger vehicles, commercial vehicles, and two-wheelers. Key lubricants consumed include engine oils, gear oils, transmission fluids, and greases. Vehicle manufacturing growth in India and increased fleet maintenance are expanding lubricant requirements.
OEMs and suppliers are supporting transitions toward fuel-efficient vehicles through lubricant product changes. BS-VI emission norms have resulted in the adoption of lower-viscosity and synthetic-based lubricants. Demand from electric vehicle applications is also emerging, including cooling lubricants and driveline fluids.
Distribution strategies include dealership tie-ups and service center partnerships. Lubricant change intervals are shifting in response to improved formulations. Companies are aligning with aftermarket trends by offering products for high-mileage and commercial-use vehicles. Market expansion is linked to transport activity, logistics growth, and fleet replacement cycles.

Future Market Insights conducted a recent survey of key players in the Indian industrial lubricants market, including manufacturers, suppliers, and end-users. The survey revealed that more than 60% of respondents identified cost-effectiveness and performance efficiency as the primary drivers for selecting lubricants.
Industrial players were quick to highlight the increasing demand for high-performance lubricants that maximize the longevity of machinery and lower maintenance expenses. In addition, stakeholders observed an increasing trend toward synthetic and bio-based lubricants, fuelled by environmental regulations and corporate sustainability efforts.
The survey also brought to light the growing importance of digitalization and predictive maintenance in lubricant management. Approximately 45% of the respondents stated that data-driven solutions and IoT-based monitoring systems are becoming essential for optimizing lubricant usage.
Automotive, manufacturing, and energy industries are quickly embracing smart lubrication practices to reduce downtime and enhance operational efficiency. Additionally, stakeholders recognized the pain of volatile raw material prices, which ongoingly affect cost structures and profit margins.
| Regulation/Certification | Description and Impact |
|---|---|
| Lubricating Oils and Greases (Processing, Supply, and Distribution Regulation) Order, 1987 | This regulation mandates that businesses involved in the processing, manufacturing, blending, packaging, refining, or sale of lubricating oils and greases obtain a LUBE License. The license ensures adherence to quality and safety standards, and compliance is enforced by the Ministry of Petroleum and Natural Gas. |
| Bureau of Indian Standards (BIS) Certification | The BIS, established under the BIS Act, 2016, is the National Standards Body of India responsible for developing and implementing standards for various products, including industrial lubricants. Compliance with BIS standards ensures product quality and safety, facilitating consumer trust and market access. |
| ISO Certifications | While not mandatory, obtaining ISO certifications such as ISO 9001:2015 (Quality Management System) and ISO 14001:2015 (Environmental Management System) can enhance a company's credibility and demonstrate commitment to quality and environmental sustainability. These certifications are often pursued by lubricant manufacturers to meet international standards and improve market competitiveness. |
| Extended Producer Responsibility (EPR) for Used Oils | Effective from April 1, 2024, India has expanded the scope of Extended Producer Responsibility to include used oils. This policy holds producers accountable for the collection and environmentally sound disposal of used lubricants, promoting recycling and reducing environmental pollution. Compliance with EPR regulations is mandatory for lubricant manufacturers and importers. |
The industrial lubricants industry in North India is estimated to grow at a Compound Annual Growth Rate (CAGR) of about 3.6% from 2025 to 2035, matching the national average. This development is mainly attributed to the strong industrial base of the region, including automotive production, heavy machinery, and construction. The other states, including Haryana, Uttar Pradesh, and Punjab, have experienced rapid industrialization over the years.
This results in increasing demand for high-performance lubricants in order to enhance the operational efficiency and durability of machines. The expansion of industry is also on surge due to the presence of some major industrial corridors and national capital.
Furthermore, the government's initiatives for infrastructure development and the advent of new industrial zones are anticipated to create profitable opportunities for lubricant manufacturers & suppliers in the region.
FMI opines that North India industrial lubricant sales will grow at nearly 3.6% CAGR through 2025 to 2035.
The South India industrial lubricants sector is anticipated to expand at a CAGR of 4.0% during the forecast period between 2025 and 2035. The growth of the sector is driven by several factors, such as the region’s industrial landscape, information technology, automotive textiles, and petrochemicals, among others.
Some states including Tamil Nadu, Karnataka, and Andhra Pradesh, have transformed into manufacturing and technology capitals, attracting large amounts of investment in such sectors. Tamil Nadu has witnessed a tremendous growth in the automotive industry, leading to an improved demand for specialty lubricants.
Additionally, the increasing number of renewable energy projects planned or underway in the region (including wind and solar farms) will require specialized lubricants for maintenance, which will, in turn, drive the industry for lubricants.
FMI opines that South India industrial lubricant sales will grow at nearly 4.0% CAGR through 2025 to 2035.
The East India industrial lubricants industry is expected to grow at a CAGR of over 3.5% during the period 2025 to 2035. States such as West Bengal, Odisha, and Jharkhand are key players in the industrial activities of the region, which are mostly dominated by mining, steel, and heavy engineering. The availability of natural resources has led to the establishment of mining and metal processing industries that require major quantities of industrial lubricants for equipment maintenance.
Further, governmental actions to support industrialization infrastructure development across the eastern states are also expected to drive lubricant consumption. However, challenges such as poor infrastructure and logistical constraints in this region can hinder the industry's growth potential.
FMI opines that East India industrial lubricant sales will grow at nearly 3.5% CAGR through 2025 to 2035.
The industrial lubricants sector in the Western India is poised to surge substantially at a CAGR of approx. 4.2% over the next decade. The economic portfolio in the region comprises potently strong industries like petrochemicals, textiles, pharmaceuticals, and automotive manufacturing. States such as Gujarat and Maharashtra are leading the way, with Gujarat becoming a petrochemical powerhouse and Maharashtra being home to a large number of automotive and manufacturing units.
The establishment of dedicated industrial zones and special economic zones (SEZs) has attracted both domestic and foreign investments, thus driving the demand for industrial lubricants. The e-commerce sector has benefited from the industry growth due to the well-established infrastructure in these states, as well as their geographical advantages with their ports.
FMI opines that West India industrial lubricant sales will grow at nearly 4.2% CAGR through 2025 to 2035.
The Indian industrial lubricants industry belongs to the specialty chemicals sector, closely related to manufacturing, infrastructure growth, and industrial automation. It is a cyclical industry, driven by macroeconomic trends, including GDP growth, industrial production, energy consumption, and regulatory policy.
During 2020 to 2024, India's economic rebound from the COVID-19 pandemic contributed immensely to driving industrial activity, leading to the demand for lubricants in major sectors such as construction, mining, power generation, and automobile manufacturing. Policies such as "Make in India" and the Production-Linked Incentive (PLI) scheme supported domestic production, which had a positive effect on lubricant consumption.
Between 2025 and 2035, urbanization, infrastructure development, and industrial automation will drive industry expansion. The growth of electric vehicles could hamper the requirement for traditional lubrication, but it will also bring in new niches for specialty greases and refrigeration fluids. More stringent eco-regulations will encourage manufacturers to go for bio-based and synthetic lubricants, whereas volatile crude oil prices could affect raw material prices.
The sector will also be boosted by India's high foreign direct investment (FDI) inflows in manufacturing and energy, causing higher lubricant consumption. But supply chain shocks, trade tensions, and geopolitics may add industry volatility. Firms with investments in R&D, sustainable formulations, and cutting-edge manufacturing will have a competitive advantage.
The Indian industrial lubricant industry offers high growth prospects, especially in synthetic and bio-based lubricants, with increased emphasis on environmental regulations and high-performance product demand. Low-emission lubricants designed for sectors such as power generation, EV production, and heavy equipment should be developed by stakeholders to gain industry share.
Adding regional production clusters will dampen supply chain vulnerabilities, while local procurement of raw materials can minimize cost instability associated with crude oil prices. Joint ventures with OEMs in cars and industrial machinery will guarantee direct product integration, guaranteeing long-term contracts.
R&D investment in sector-specific lubricants, like electric vehicle thermal management fluids or transformer fire-resistant oils, will address new industrial requirements. Digital lubricant distribution, with IoT-based monitoring for predictive maintenance, can become an industrial value-add.
Firms must also synchronize with the government incentives of the Make in India and the PLI schemes to become the prime vendors in India's emerging industrial setup.
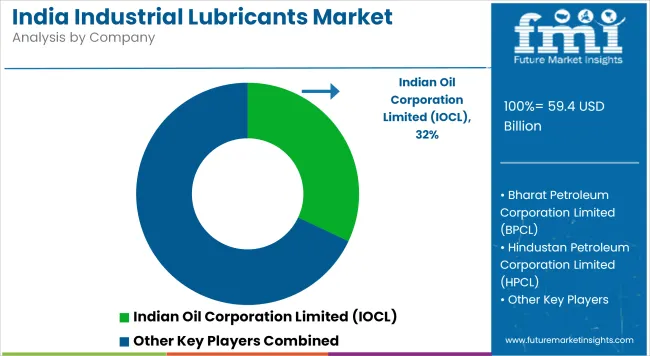
The industrial lubricants market is witnessing increased focus on supply chain realignment and localization of production. Major players are diversifying product lines to meet evolving demands across sectors such as manufacturing, construction, and power generation. Companies are investing in synthetic and bio-based formulations to comply with regional environmental regulations.
Strategic collaborations with OEMs and equipment service providers are enabling lubricant firms to offer value-added services and enhance customer retention. Price volatility in base oils is prompting firms to optimize procurement and inventory strategies. Regional competitors are expanding their footprint by leveraging local distribution networks and targeting small-to-medium enterprises. Market activity is shaped by cost-efficiency, formulation innovation, and adherence to industry-specific performance standards.

Hydraulic fluids, Metalworking fluids, Gear Oils, Compressor Oil, Grease, Turbine Oil, Transformer Oil, Refrigeration Oil, Textile Machinery Lubricants, and Others
Mineral Oil, Synthetic Oil, and Bio-based Oil
Construction, Metal and Mining, Cement Production, Power Generation, Automotive, Chemical Production, Oil and Gas, Textile Manufacturing, Food Processing, Agriculture, Pulp and Paper, Marine Application, and others
North India, South India, East India, and West India
Rising industrialization, infrastructure projects, and demand for high-performance lubricants.
Construction, power generation, metalworking, automotive, and manufacturing sectors.
Stricter environmental norms are pushing companies toward bio-based and low-emission lubricants.
Advancements in synthetic formulations, energy-efficient solutions, and predictive maintenance technologies.
Traditional lubricant demand is declining, but specialty greases and thermal management fluids are gaining traction.


Our Research Products

The "Full Research Suite" delivers actionable market intel, deep dives on markets or technologies, so clients act faster, cut risk, and unlock growth.

The Leaderboard benchmarks and ranks top vendors, classifying them as Established Leaders, Leading Challengers, or Disruptors & Challengers.

Locates where complements amplify value and substitutes erode it, forecasting net impact by horizon

We deliver granular, decision-grade intel: market sizing, 5-year forecasts, pricing, adoption, usage, revenue, and operational KPIs—plus competitor tracking, regulation, and value chains—across 60 countries broadly.

Spot the shifts before they hit your P&L. We track inflection points, adoption curves, pricing moves, and ecosystem plays to show where demand is heading, why it is changing, and what to do next across high-growth markets and disruptive tech

Real-time reads of user behavior. We track shifting priorities, perceptions of today’s and next-gen services, and provider experience, then pace how fast tech moves from trial to adoption, blending buyer, consumer, and channel inputs with social signals (#WhySwitch, #UX).

Partner with our analyst team to build a custom report designed around your business priorities. From analysing market trends to assessing competitors or crafting bespoke datasets, we tailor insights to your needs.
Supplier Intelligence
Discovery & Profiling
Capacity & Footprint
Performance & Risk
Compliance & Governance
Commercial Readiness
Who Supplies Whom
Scorecards & Shortlists
Playbooks & Docs
Category Intelligence
Definition & Scope
Demand & Use Cases
Cost Drivers
Market Structure
Supply Chain Map
Trade & Policy
Operating Norms
Deliverables
Buyer Intelligence
Account Basics
Spend & Scope
Procurement Model
Vendor Requirements
Terms & Policies
Entry Strategy
Pain Points & Triggers
Outputs
Pricing Analysis
Benchmarks
Trends
Should-Cost
Indexation
Landed Cost
Commercial Terms
Deliverables
Brand Analysis
Positioning & Value Prop
Share & Presence
Customer Evidence
Go-to-Market
Digital & Reputation
Compliance & Trust
KPIs & Gaps
Outputs
Full Research Suite comprises of:
Market outlook & trends analysis
Interviews & case studies
Strategic recommendations
Vendor profiles & capabilities analysis
5-year forecasts
8 regions and 60+ country-level data splits
Market segment data splits
12 months of continuous data updates
DELIVERED AS:
PDF EXCEL ONLINE
Western Europe Industrial Drum Market Growth – Trends & Forecast 2023-2033
Korea Industrial Drum Market Analysis – Growth & Forecast 2023-2033
Japan Industrial Drum Market Insights – Growth & Forecast 2023-2033
Industrial Furnace Industry Analysis in Europe Forecast and Outlook 2025 to 2035
Lubricants for Cement Industry Market
India Decorative Veneer Industry Size and Share Forecast Outlook 2025 to 2035
Europe Industrial Lubricants Market: Growth, Trends, and Forecast 2025 to 2035
Industrial Electronics Packaging Industry Analysis in Western Europe Size and Share Forecast Outlook 2025 to 2035
Skincare Industry in India – Trends & Growth Forecast 2024-2034
Industrial Analysis of Coronary Stent in India Size and Share Forecast Outlook 2025 to 2035
Decor Paper Industry Analysis in India Size and Share Forecast Outlook 2025 to 2035
Power Tools Industry Analysis in India - Size, Share, and Forecast Outlook 2025 to 2035
Methylamine Market Growth – Trends & Forecast 2024-2034
Stainless Steel Industry Analysis in India Forecast and Outlook 2025 to 2035
Consumer Packaging Industry Analysis in India Forecast and Outlook 2025 to 2035
Automotive Stamping Industry Analysis in India Size and Share Forecast Outlook 2025 to 2035
Menopause Treatment Industry Analysis in India Forecast Outlook 2025 to 2035
Construction Chemical Industry Analysis in India - Size, Share, and Forecast 2025 to 2035
Smart Home Automation in India – IoT & AI-Driven Growth
Injection Molding Machines Industry Analysis in India Size, Share & Forecast 2025 to 2035

Thank you!
You will receive an email from our Business Development Manager. Please be sure to check your SPAM/JUNK folder too.
Chat With
MaRIA