Industrial Filling Machine Market
Market Insights on Industrial Filling Machine covering sales outlook, demand forecast & up-to-date key trends
Industrial Filling Machine Market by Machine Output, Automation, End Use Industry & Region - Forecast 2022 – 2032
Industrial Filling Machine Market Outlook (2022-2032)
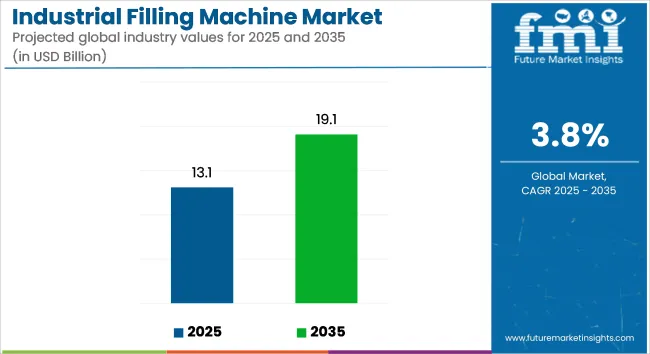
[202 Pages Report] The global industrial filling machine market is expected to grow at a CAGR of 4.6% during the forecast period (2022-2032). The market value is estimated to increase from US$ 11.8 Bn in 2022 to US$ 18.5 Bn by 2032. The industrial filling machine market was valued at US$ 11.3 Bn at the end of 2021 and is anticipated to exhibit Y-o-Y growth of 4.0% in 2022.
Industrial Filling Machine Market Size (2022E) |
US$ 11.8 Bn |
Projected Market Size (2032F) |
US$ 18.5 Bn |
Value CAGR (2022-2032) |
4.6% |
Top 3 Countries Market Share |
~30-35% |
The industrial filling machine market is estimated to hold 7-7.5% of the global packaging machine market worth US$ 58 Bn, in 2021.
Newly released data from industrial filling machine market analysis shows that the global demand for overall machines with an output of more than 1,000 fills/hr segment enjoyed year-on-year (YoY) growth of 5.1% in 2021.
The 501-1,000 fills/hr industrial filling machine segment grew 4.4%, while the up to 100 fills/hr industrial filling machine segment was up 3.7%. The consumption of industrial filling machines in food and beverages industry witnessed growth, with worldwide revenues up 4.8% year over year in 2021.
In 2021, the U.S. industrial filling machine market grew by 3.1% year on year, dominating the North America industrial filling machine market. Across North America, total sales of industrial filling machines reached US$ 2.7 Bn in 2021.
Let us know your requirement to get
100% FREE customization
2015-2021 Industrial Filling Machine Demand Outlook Compared to 2022-2032 Forecast
The global industrial filling machine market grew at a CAGR of 2.4% between 2015 and 2021 and is projected to register 4.6% CAGR over the forecast period (2022-2032). Growth in the market is projected to improve on the back of increasing demand for automatic machines that ensure minimum error and clean room packaging of the consumable products.
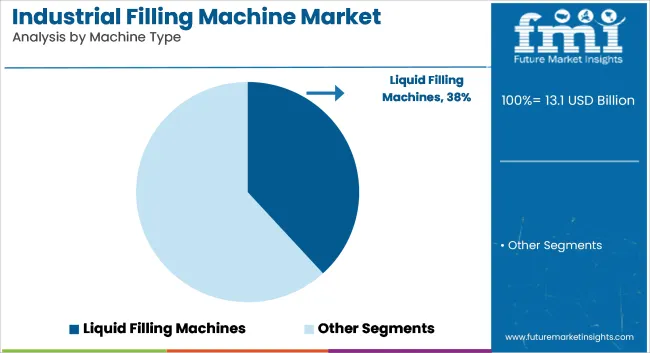
As consumers are more inclined towards hygiene and safety, end-users are investing more in adopting recent technologies providing contamination-free packaging. Based on industrial filling machines, the form fill & seal machine is expected to hold maximum market share. As this machine performs three operations such as forming, filling, and sealing, the demand is projected to surge over the upcoming decade.
How will Demand for Precision Filling Boost Industrial Filling Machine Market?
Demand for industrial filling machine is expected to surge with increasing need for precise filling of the products available in various forms like liquid, powder, granules, gel, etc. The accurate amount of product filling within packages is the prime concern of several end users.
In the pharmaceutical industry, the drug manufacturers need to confirm the packaging of the prescribed volume of medicine to avoid situations of either overdosing or under dosing. Hence, medical dosage filling processes require perfect filling. Industrial filling machines such as automated capsule filling, vial filling, bottle filling, and prefill syringe filling machines are gaining traction in the healthcare sector.
Apart from this, the aseptic packaging trend is encouraging brand owners in food, beverages, and cosmetics to shift to the automated filling machine. Cold aseptic filling is now becoming a common technique among beverage and dairy product manufacturers for contamination-free packaging of milk, fruit juices, and energy drinks.
Find your sweet spots for generating winning opportunities in this market.
Talk to AnalystHow will Growing Need to Product Integrity Propel Industrial Filling Machine Sales?
Product composition plays an important role especially when it consists of a variety of ingredients. An industrial filling machine having a weightage setting option helps to fill the right size of ingredients. This results in achieving product integrity to the best level.
In the food and beverage or cosmetic industries, the product is made of various ingredients with different compositions. If these ingredients are not filled with the prescribed percentage/weightage, then it hampers the product quality and thus increases product waste.
As these industries usually opt for mass production, it becomes a challenge for the company to accept huge losses due to inappropriate combinations. Hence, end-users are increasing the adoption of the industrial filling machine to maintain product integrity.
Country-wise Insights
How is the Germany Industrial Filling Machine Market Shaping?
Expansion of Pharmaceutical Industry to Boost Industrial Filling Machine Market in Germany
As per the Germany Trade & Invest, supported by Federal Ministry for Economic Affairs and Climate Action, Germany is a key European pharmaceutical market and ranks as the fourth largest in the world.
In 2019, sales in pharmaceutical industry Germany increased by 5.7%, reaching US$ 47 Bn. Germany generated production value is increased significantly in the past three years, making it the leading pharmaceutical manufacturing location in Europe.
Expansion of the pharmaceutical industry and increasing FDIs in the promotion of business development in the healthcare industry are expected to create significant growth opportunities industrial filling machines manufacturers.
FMI predicts with the increase in production of medicines like vaccines, powders, capsules and many others will create multiple demands for aseptic filling machines. On the back of this, the industrial filling machine market in Germany is expected to increase by 1.4x in the next decade.
Will India Emerge as Manufacturing Leader in Industrial Filling Machine Market?
Increasing Application in Food & Beverage Industry to Propel Industrial Filling Machine Sales
As per the ministry of food processing industries, India exported around US$2.3 Bn of only tea, coffee and spices in 2021-22 to the other countries. As a developing country, India is holds approx. 2.3% share of food export in the world.
The above-mentioned factors indicate a heavy rise in demand for industrial filling machines across the food & beverage industry. Sales are anticipated to increase due to a sharp rise in demand for consumables produced in India across International markets.
Hence, key players across the industrial filling machine market are eyeing profitable growth opportunities offered by India over the upcoming decade. As per FMI, India is expected to offer a total incremental opportunity of US$ 694 Mn between 2022 and 2032.

An unified Market Research Subscription Platform, built for today’s disparate research needs.
Category-wise Insights
Why are Industrial Filling Machine with an above 1000 fills/hour Output Gaining Traction?
Availability of Industrial Filling Machines with Over 1000 fills/hr Output at Cost-Effective Prices to Boost Demand
The machine output for the above 1000 fills/hr is going to hold the maximum share in the industrial filling machine market. Increased demand for goods across food & beverages, agriculture and pharmaceutical industry has made it mandatory for producers to upgrade their products as well as packaging capabilities.
The availability of high-speed industrial filling machines at cost-effective rates has propelled the demand for equipment having a capacity of more than 1000 fills/hr. Total sales of industrial filling machines are expected to witness growth at 5.1% CAGR over the forecasted period.
Who will be the Dominant End User of Industrial Filling Machines?
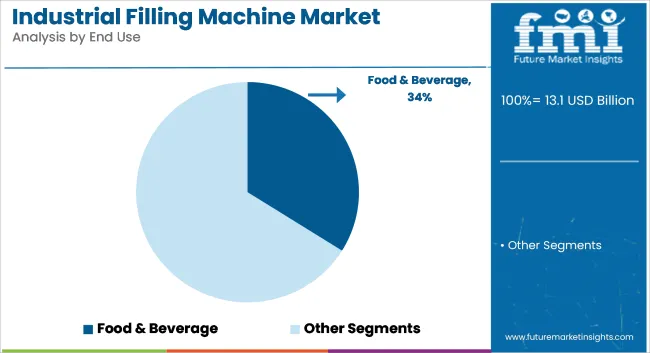
Food & Beverage Industry to Account for Nearly 2/5th of Total Industrial Filling Machine Sales
Food & beverages have a prominent market share in the industrial filling machine market. In 2022, the food & beverage industry accounted for 37.3% market share and is expected to reach 39.3% by 2032.
Rise in demand for processed consumable products has propelled the demand for automated filling equipment. Further, the increased technological adoption among all the players across the food industry will boost the industrial filling machine market.
Competitive Landscape
As per FMI, the global industrial filling machine market is extremely fragmented and competitive. Key players use a variety of marketing techniques, including mergers & acquisitions, expansions, collaborations, and partnerships.
Leading organisations also use new product creation as a strategic way to expand their market presence among customers. Advanced industrial filling machine have been incorporated as a result of these tactics. Some of the recent developments in the market are as follows –
- On December 21, 2021. PAXIOM has started a new industry in Las Vegas. It is a 50,000 square foot area in which they provide all the kinds of filling machine packaging facilities and CEO stated that there is nothing better than going into a new industry with the best environment dedicated to a team member.
- On March 5, 2022. All-Fill Inc. has sponsored Malvern robotic club in the USA to cover their expenses and all the student are engaged to build a robot for future things. They were also doing some research for the competition which is going to be held in the same month only.
Scope of the Report
Attribute |
Details |
Estimated Market Size (2022E) |
US$ 11.8 Bn |
Projected Market Size (2032F) |
US$ 18.5 Bn |
Growth Rate |
CAGR of 4.6% from 2022 to 2032 |
Base Year for Estimation |
2021 |
Historical Data |
2015-2020 |
Forecast Period |
2022-2032 |
Quantitative Units |
Revenue in USD Million, Volume in Units and CAGR from 2022-2032 |
Report Coverage |
Revenue Forecast, Volume Forecast, Company Ranking, Competitive Landscape, Growth Factors, Trends and Pricing Analysis |
Segment Covered |
|
Regions Covered |
|
Key Countries Profiled |
|
Key Companies Profiled |
|
Industrial Filling Machine Market by Category
By Machine Output:
- Upto 100 Fills/Hr
- 101-500 Fills/Hr
- 501-1000 Fills/Hr
- Above 1000 Fills/Hr
By Automation:
- Manual Industrial Filling Machine
- Semi-automatic Industrial Filling Machine
- Automatic Industrial Filling Machine
By End Use Industry:
- Agriculture
- Food & Beverages
- Building & Construction
- Chemicals
- Personal Care & Cosmetic
- Pharmaceutical
By Region:
- North America
- Latin America
- Europe
- South Asia
- East Asia
- Middle East & Africa
- Oceania
Frequently Asked Questions
The industrial filling machine market is estimated to reach US$ 11.8 Bn in 2022.
During the forecast period, the automatic industrial filling machine is likely to be the leading automation type across the global industrial filling machine market.
As per FMI estimates Nichrome Packaging Solutions, Romaco Group, PAXIOM, All fill-Inc and NALBACH ENGINEERING COMPANY are some of the leading global industrial filling machine market.
The food and beverage industry is expected to create exponential demand for industrial filling machines during the forecast period.
The major markets across the global industrial filling machine market are the US, Germany, China, Japan and India.
Table of Content
1. Executive Summary
1.1. Global Market Outlook
1.2. Demand-side Trends
1.3. Supply-side Trends
1.4. Technology Roadmap Analysis
1.5. Analysis and Recommendations
2. Market Overview
2.1. Market Coverage / Taxonomy
2.2. Market Definition / Scope / Limitations
3. Market Background
3.1. Market Dynamics
3.1.1. Drivers
3.1.2. Restraints
3.1.3. Opportunity
3.1.4. Trends
3.2. Impact of Covid-19
3.2.1. Demand in Optimistic Scenario
3.2.2. Demand in Likely Scenario
3.2.3. Demand in Conservative Scenario
3.3. Macro Factors and Forecast Factors
3.4. Value Chain Analysis
3.4.1. Profit Margin Analysis
3.4.2. Raw Machine Output Suppliers
3.4.3. Manufacturers, Wholesalers and Distributors
3.4.4. End Users/ Customers
3.5. Regional Parent Market Outlook
3.6. Production and Consumption Statistics
3.7. Global Average Pricing Analysis Benchmark
4. Global Industrial Filling Machine Market Analysis 2015-2021 and Forecast, 2022-2032
4.1. Historical Market Size Value (US$ Mn) & Volume (Units) Analysis, 2015-2021
4.2. Current and Future Market Size Value (US$ Mn) & Volume (Units) Projections, 2022-2032
4.2.1. Y-o-Y Growth Trend Analysis
4.2.2. Absolute $ Opportunity Analysis
5. Global Industrial Filling Machine Market Analysis 2015–2021 and Forecast 2022–2032, By Machine Output
5.1. Introduction / Key Findings
5.2. Historical Market Size Value (US$ Mn) & Volume (Units) Analysis By Machine Output, 2015-2021
5.3. Current and Future Market Size Value (US$ Mn) & Volume (Units) Analysis and Forecast By Machine Output, 2022-2032
5.3.1. Upto 100 Fills/hr
5.3.2. 101-500 Fills/hr
5.3.3. 501-1000 Fills/hr
5.3.4. Above 1000 Fills/hr
5.4. Y-o-Y Growth Trend Analysis By Machine Output, 2015-2021
5.5. Absolute $ Opportunity Analysis By Machine Output, 2022-2032
6. Global Industrial Filling Machine Market Analysis 2015–2021 and Forecast 2022–2032, By Automation
6.1. Introduction / Key Findings
6.2. Historical Market Size Value (US$ Mn) & Volume (Units) Analysis By Automation, 2015-2021
6.3. Current and Future Market Size Value (US$ Mn) & Volume (Units) Analysis and Forecast By Automation, 2022-2032
6.3.1. Manual
6.3.2. Semi-automatic
6.3.3. Automatic
6.4. Y-o-Y Growth Trend Analysis By Automation, 2015-2021
6.5. Absolute $ Opportunity Analysis By Automation, 2022-2032
7. Global Industrial Filling Machine Market Analysis 2015–2021 and Forecast 2022–2032, By End Use Industry
7.1. Introduction / Key Findings
7.2. Historical Market Size Value (US$ Mn) & Volume (Units) Analysis By End Use Industry, 2015-2021
7.3. Current and Future Market Size Value (US$ Mn) & Volume (Units) Analysis and Forecast By End Use Industry, 2022-2032
7.3.1. Pharmaceutical
7.3.2. Chemical
7.3.3. Food & Beverage
7.3.4. Personal Care & Cosmetics
7.3.5. Agriculture
7.3.6. Building & Construction
7.4. Y-o-Y Growth Trend Analysis By End Use Industry, 2015-2021
7.5. Absolute $ Opportunity Analysis By End Use Industry, 2022-2032
8. Global Industrial Filling Machine Market Analysis 2015–2021 and Forecast 2022–2032, by Region
8.1. Introduction / Key Findings
8.2. Historical Market Size Value (US$ Mn) & Volume (Units) Analysis By Region, 2015-2021
8.3. Current and Future Market Size Value (US$ Mn) & Volume (Units) Analysis and Forecast By Region, 2022-2032
8.3.1. North America
8.3.2. Latin America
8.3.3. Europe
8.3.4. East Asia
8.3.5. South Asia
8.3.6. Oceania
8.3.7. Middle East and Africa (MEA)
8.4. Market Attractiveness Analysis, by Region
9. North America Industrial Filling Machine Market Analysis 2015–2021 and Forecast 2022–2032, By Country
9.1. Historical Market Size Value (US$ Mn) & Volume (Units) Trend Analysis By Market Taxonomy, 2015-2021
9.2. Market Size Value (US$ Mn) & Volume (Units) Forecast By Market Taxonomy, 2022-2032
9.2.1. By Country
9.2.1.1. U.S.
9.2.1.2. Canada
9.2.2. By Machine Output
9.2.3. By Automation
9.2.4. By End Use Industry
9.3. Market Attractiveness Analysis
9.3.1. By Country
9.3.2. By Machine Output
9.3.3. By Automation
9.3.4. By End Use Industry
9.4. Key Takeaways
10. Latin America Industrial Filling Machine Market Analysis 2015–2021 and Forecast 2022–2032, By Country
10.1. Historical Market Size Value (US$ Mn) & Volume (Units) Trend Analysis By Market Taxonomy, 2015-2021
10.2. Market Size Value (US$ Mn) & Volume (Units) Forecast By Market Taxonomy, 2022-2032
10.2.1. By Country
10.2.1.1. Brazil
10.2.1.2. Mexico
10.2.1.3. Argentina
10.2.1.4. Chile
10.2.1.5. Peru
10.2.1.6. Rest of Latin America
10.2.2. By Machine Output
10.2.3. By Automation
10.2.4. By End Use Industry
10.3. Market Attractiveness Analysis
10.3.1. By Country
10.3.2. By Machine Output
10.3.3. By Automation
10.3.4. By End Use Industry
10.4. Key Takeaways
11. Europe Industrial Filling Machine Market Analysis 2015–2021 and Forecast 2022–2032, By Country
11.1. Historical Market Size Value (US$ Mn) & Volume (Units) Trend Analysis By Market Taxonomy, 2015-2021
11.2. Market Size Value (US$ Mn) & Volume (Units) Forecast By Market Taxonomy, 2022-2032
11.2.1. By Country
11.2.1.1. Germany
11.2.1.2. Italy
11.2.1.3. France
11.2.1.4. U.K.
11.2.1.5. Spain
11.2.1.6. BENELUX
11.2.1.7. Nordic
11.2.1.8. Russia
11.2.1.9. Poland
11.2.1.10. Rest of Europe
11.2.2. By Machine Output
11.2.3. By Automation
11.2.4. By End Use Industry
11.3. Market Attractiveness Analysis
11.3.1. By Country
11.3.2. By Machine Output
11.3.3. By Automation
11.3.4. By End Use Industry
11.4. Key Takeaways
12. East Asia Industrial Filling Machine Market Analysis 2015–2021 and Forecast 2022–2032, By Country
12.1. Historical Market Size Value (US$ Mn) & Volume (Units) Trend Analysis By Market Taxonomy, 2015-2021
12.2. Market Size Value (US$ Mn) & Volume (Units) Forecast By Market Taxonomy, 2022-2032
12.2.1. By Country
12.2.1.1. China
12.2.1.2. Japan
12.2.1.3. South Korea
12.2.2. By Machine Output
12.2.3. By Automation
12.2.4. By End Use Industry
12.3. Market Attractiveness Analysis
12.3.1. By Country
12.3.2. By Machine Output
12.3.3. By Automation
12.3.4. By End Use Industry
12.4. Key Takeaways
13. South Asia Industrial Filling Machine Market Analysis 2015–2021 and Forecast 2022–2032, By Country
13.1. Historical Market Size Value (US$ Mn) & Volume (Units) Trend Analysis By Market Taxonomy, 2015-2021
13.2. Market Size Value (US$ Mn) & Volume (Units) Forecast By Market Taxonomy, 2022-2032
13.2.1. By Country
13.2.1.1. India
13.2.1.2. Thailand
13.2.1.3. Malaysia
13.2.1.4. Indonesia
13.2.1.5. Rest of South Asia
13.2.2. By Machine Output
13.2.3. By Automation
13.2.4. By End Use Industry
13.3. Market Attractiveness Analysis
13.3.1. By Country
13.3.2. By Machine Output
13.3.3. By Automation
13.3.4. By End Use Industry
13.4. Key Takeaways
14. Oceania Industrial Filling Machine Market Analysis 2015–2021 and Forecast 2022–2032, By Country
14.1. Historical Market Size Value (US$ Mn) & Volume (Units) Trend Analysis By Market Taxonomy, 2015-2021
14.2. Market Size Value (US$ Mn) & Volume (Units) Forecast By Market Taxonomy, 2022-2032
14.2.1. By Country
14.2.1.1. Australia
14.2.1.2. New Zealand
14.2.2. By Machine Output
14.2.3. By Automation
14.2.4. By End Use Industry
14.3. Market Attractiveness Analysis
14.3.1. By Country
14.3.2. By Machine Output
14.3.3. By Automation
14.3.4. By End Use Industry
14.4. Key Takeaways
15. Middle East & Africa Industrial Filling Machine Market Analysis 2015–2021 and Forecast 2022–2032, By Country
15.1. Historical Market Size Value (US$ Mn) & Volume (Units) Trend Analysis By Market Taxonomy, 2015-2021
15.2. Market Size Value (US$ Mn) & Volume (Units) Forecast By Market Taxonomy, 2022-2032
15.2.1. By Country
15.2.1.1. GCC Countries
15.2.1.2. Turkey
15.2.1.3. Northern Africa
15.2.1.4. South Africa
15.2.1.5. Rest of MEA
15.2.2. By Machine Output
15.2.3. By Automation
15.2.4. By End Use Industry
15.3. Market Attractiveness Analysis
15.3.1. By Country
15.3.2. By Machine Output
15.3.3. By Automation
15.3.4. By End Use Industry
15.4. Key Takeaways
16. Country wise Industrial Filling Machine Market Analysis
16.1. United States (U.S.)
16.1.1. Market Share Analysis, 2022
16.1.2. By Machine Output
16.1.3. By Automation
16.1.4. By End Use Industry
16.2. Canada
16.2.1. Market Share Analysis, 2022
16.2.2. By Machine Output
16.2.3. By Automation
16.2.4. By End Use Industry
16.3. Brazil
16.3.1. Market Share Analysis, 2022
16.3.2. By Machine Output
16.3.3. By Automation
16.3.4. By End Use Industry
16.4. Mexico
16.4.1. Market Share Analysis, 2022
16.4.2. By Machine Output
16.4.3. By Automation
16.4.4. By End Use Industry
16.5. Germany
16.5.1. Market Share Analysis, 2022
16.5.2. By Machine Output
16.5.3. By Automation
16.5.4. By End Use Industry
16.6. Italy
16.6.1. Market Share Analysis, 2022
16.6.2. By Machine Output
16.6.3. By Automation
16.6.4. By End Use Industry
16.7. France
16.7.1. Market Share Analysis, 2022
16.7.2. By Machine Output
16.7.3. By Automation
16.7.4. By End Use Industry
16.8. Spain
16.8.1. Market Share Analysis, 2022
16.8.2. By Machine Output
16.8.3. By Automation
16.8.4. By End Use Industry
16.9. U.K.
16.9.1. Market Share Analysis, 2022
16.9.2. By Machine Output
16.9.3. By Automation
16.9.4. By End Use Industry
16.10. Russia
16.10.1. Market Share Analysis, 2022
16.10.2. By Machine Output
16.10.3. By Automation
16.10.4. By End Use Industry
16.11. China
16.11.1. Market Share Analysis, 2022
16.11.2. By Machine Output
16.11.3. By Automation
16.11.4. By End Use Industry
16.12. Japan
16.12.1. Market Share Analysis, 2022
16.12.2. By Machine Output
16.12.3. By Automation
16.12.4. By End Use Industry
16.13. India
16.13.1. Market Share Analysis, 2022
16.13.2. By Machine Output
16.13.3. By Automation
16.13.4. By End Use Industry
16.14. GCC Countries
16.14.1. Market Share Analysis, 2022
16.14.2. By Machine Output
16.14.3. By Automation
16.14.4. By End Use Industry
16.15. Australia
16.15.1. Market Share Analysis, 2022
16.15.2. By Machine Output
16.15.3. By Automation
16.15.4. By End Use Industry
17. Market Structure Analysis
17.1. Competition Dashboard
17.2. Competition Benchmarking
17.3. Market Share Analysis of Top Players
17.3.1. By Region
17.3.2. By Product Portfolio
18. Competition Analysis
18.1. Competition Deep Dive
18.1.1. Nichrome Packaging Solutions.
18.1.1.1. Overview
18.1.1.2. Product Portfolio
18.1.1.3. Profitability by Market Segments (Product/Channel/Region)
18.1.1.4. Sales Footprint
18.1.1.5. Strategy Overview
18.1.1.5.1. Marketing Strategy
18.1.1.5.2. Product Strategy
18.1.1.5.3. Channel Strategy
18.1.2. Romaco Group
18.1.2.1. Overview
18.1.2.2. Product Portfolio
18.1.2.3. Profitability by Market Segments (Product/Channel/Region)
18.1.2.4. Sales Footprint
18.1.2.5. Strategy Overview
18.1.2.5.1. Marketing Strategy
18.1.2.5.2. Product Strategy
18.1.2.5.3. Channel Strategy
18.1.3. PAXIOM
18.1.3.1. Overview
18.1.3.2. Product Portfolio
18.1.3.3. Profitability by Market Segments (Product/Channel/Region)
18.1.3.4. Sales Footprint
18.1.3.5. Strategy Overview
18.1.3.5.1. Marketing Strategy
18.1.3.5.2. Product Strategy
18.1.3.5.3. Channel Strategy
18.1.4. Allfill Inc.
18.1.4.1. Overview
18.1.4.2. Product Portfolio
18.1.4.3. Profitability by Market Segments (Product/Channel/Region)
18.1.4.4. Sales Footprint
18.1.4.5. Strategy Overview
18.1.4.5.1. Marketing Strategy
18.1.4.5.2. Product Strategy
18.1.4.5.3. Channel Strategy
18.1.5. NALBACH ENGINEERING COMPANY
18.1.5.1. Overview
18.1.5.2. Product Portfolio
18.1.5.3. Profitability by Market Segments (Product/Channel/Region)
18.1.5.4. Sales Footprint
18.1.5.5. Strategy Overview
18.1.5.5.1. Marketing Strategy
18.1.5.5.2. Product Strategy
18.1.5.5.3. Channel Strategy
18.1.6. Syntegon Technology GmbH
18.1.6.1. Overview
18.1.6.2. Product Portfolio
18.1.6.3. Profitability by Market Segments (Product/Channel/Region)
18.1.6.4. Sales Footprint
18.1.6.5. Strategy Overview
18.1.6.5.1. Marketing Strategy
18.1.6.5.2. Product Strategy
18.1.6.5.3. Channel Strategy
18.1.7. JBT Corporation
18.1.7.1. Overview
18.1.7.2. Product Portfolio
18.1.7.3. Profitability by Market Segments (Product/Channel/Region)
18.1.7.4. Sales Footprint
18.1.7.5. Strategy Overview
18.1.7.5.1. Marketing Strategy
18.1.7.5.2. Product Strategy
18.1.7.5.3. Channel Strategy
18.1.8. GEA Group Aktiengesellschaft
18.1.8.1. Overview
18.1.8.2. Product Portfolio
18.1.8.3. Profitability by Market Segments (Product/Channel/Region)
18.1.8.4. Sales Footprint
18.1.8.5. Strategy Overview
18.1.8.5.1. Marketing Strategy
18.1.8.5.2. Product Strategy
18.1.8.5.3. Channel Strategy
18.1.9. Coesia S.p.A.
18.1.9.1. Overview
18.1.9.2. Product Portfolio
18.1.9.3. Profitability by Market Segments (Product/Channel/Region)
18.1.9.4. Sales Footprint
18.1.9.5. Strategy Overview
18.1.9.5.1. Marketing Strategy
18.1.9.5.2. Product Strategy
18.1.9.5.3. Channel Strategy
18.1.10. Ronchi Mario S.p.A.
18.1.10.1. Overview
18.1.10.2. Product Portfolio
18.1.10.3. Profitability by Market Segments (Product/Channel/Region)
18.1.10.4. Sales Footprint
18.1.10.5. Strategy Overview
18.1.10.5.1. Marketing Strategy
18.1.10.5.2. Product Strategy
18.1.10.5.3. Channel Strategy
18.1.11. Barry-Wehmiller
18.1.11.1. Overview
18.1.11.2. Product Portfolio
18.1.11.3. Profitability by Market Segments (Product/Channel/Region)
18.1.11.4. Sales Footprint
18.1.11.5. Strategy Overview
18.1.11.5.1. Marketing Strategy
18.1.11.5.2. Product Strategy
18.1.11.5.3. Channel Strategy
18.1.12. IPK Packaging
18.1.12.1. Overview
18.1.12.2. Product Portfolio
18.1.12.3. Profitability by Market Segments (Product/Channel/Region)
18.1.12.4. Sales Footprint
18.1.12.5. Strategy Overview
18.1.12.5.1. Marketing Strategy
18.1.12.5.2. Product Strategy
18.1.12.5.3. Channel Strategy
18.1.13. SS Automation & Packaging Machines
18.1.13.1. Overview
18.1.13.2. Product Portfolio
18.1.13.3. Profitability by Market Segments (Product/Channel/Region)
18.1.13.4. Sales Footprint
18.1.13.5. Strategy Overview
18.1.13.5.1. Marketing Strategy
18.1.13.5.2. Product Strategy
18.1.13.5.3. Channel Strategy
18.1.14. UV Fill Pack Engineers
18.1.14.1. Overview
18.1.14.2. Product Portfolio
18.1.14.3. Profitability by Market Segments (Product/Channel/Region)
18.1.14.4. Sales Footprint
18.1.14.5. Strategy Overview
18.1.14.5.1. Marketing Strategy
18.1.14.5.2. Product Strategy
18.1.14.5.3. Channel Strategy
18.1.15. Adinath International
18.1.15.1. Overview
18.1.15.2. Product Portfolio
18.1.15.3. Profitability by Market Segments (Product/Channel/Region)
18.1.15.4. Sales Footprint
18.1.15.5. Strategy Overview
18.1.15.5.1. Marketing Strategy
18.1.15.5.2. Product Strategy
18.1.15.5.3. Channel Strategy
18.1.16. E-PAK Machinery.
18.1.16.1. Overview
18.1.16.2. Product Portfolio
18.1.16.3. Profitability by Market Segments (Product/Channel/Region)
18.1.16.4. Sales Footprint
18.1.16.5. Strategy Overview
18.1.16.5.1. Marketing Strategy
18.1.16.5.2. Product Strategy
18.1.16.5.3. Channel Strategy
18.1.17. Tokyo Automatic Machinery.
18.1.17.1. Overview
18.1.17.2. Product Portfolio
18.1.17.3. Profitability by Market Segments (Product/Channel/Region)
18.1.17.4. Sales Footprint
18.1.17.5. Strategy Overview
18.1.17.5.1. Marketing Strategy
18.1.17.5.2. Product Strategy
18.1.17.5.3. Channel Strategy
18.1.18. Bossar Packaging
18.1.18.1. Overview
18.1.18.2. Product Portfolio
18.1.18.3. Profitability by Market Segments (Product/Channel/Region)
18.1.18.4. Sales Footprint
18.1.18.5. Strategy Overview
18.1.18.5.1. Marketing Strategy
18.1.18.5.2. Product Strategy
18.1.18.5.3. Channel Strategy
18.1.19. Fres-co System USA, Inc.
18.1.19.1. Overview
18.1.19.2. Product Portfolio
18.1.19.3. Profitability by Market Segments (Product/Channel/Region)
18.1.19.4. Sales Footprint
18.1.19.5. Strategy Overview
18.1.19.5.1. Marketing Strategy
18.1.19.5.2. Product Strategy
18.1.19.5.3. Channel Strategy
18.1.20. Pakona Engineers Pvt Ltd.
18.1.20.1. Overview
18.1.20.2. Product Portfolio
18.1.20.3. Profitability by Market Segments (Product/Channel/Region)
18.1.20.4. Sales Footprint
18.1.20.5. Strategy Overview
18.1.20.5.1. Marketing Strategy
18.1.20.5.2. Product Strategy
18.1.20.5.3. Channel Strategy
19. Assumptions and Acronyms Used
20. Research Methodology
Let us know your requirement to get
100% FREE customization
List of Tables
Table 01: Global Industrial Filling Machine Market Value (US$ Mn) Forecast by Region, 2015-2032
Table 02: Global Industrial Filling Machine Market Volume (Units) Forecast by Region, 2015-2032
Table 03: Global Industrial Filling Machine Market Value (US$ Mn) Forecast by Machine Output, 2015-2032
Table 04: Global Industrial Filling Machine Market Volume (Units) Forecast by Machine Output, 2015-2032
Table 05: Global Industrial Filling Machine Market Value (US$ Mn) Forecast by Automation, 2015-2032
Table 06: Global Industrial Filling Machine Market Volume (Units) Forecast by Automation, 2015-2032
Table 07: Global Industrial Filling Machine Market Value (US$ Mn) Forecast by End Use Industry, 2015-2032
Table 08: Global Industrial Filling Machine Market Volume (Units) Forecast by End Use Industry, 2015-2032
Table 09: North America Industrial Filling Machine Market Value (US$ Mn) Forecast by Country, 2015-2032
Table 10: North America Industrial Filling Machine Market Volume (Units) Forecast by Country, 2015-2032
Table 11: North America Industrial Filling Machine Market Value (US$ Mn) Forecast by Machine Output, 2015-2032
Table 12: North America Industrial Filling Machine Market Volume (Units) Forecast by Machine Output, 2015-2032
Table 13: North America Industrial Filling Machine Market Value (US$ Mn) Forecast by Automation, 2015-2032
Table 14: North America Industrial Filling Machine Market Volume (Units) Forecast by Automation, 2015-2032
Table 15: North America Industrial Filling Machine Market Value (US$ Mn) Forecast by End Use Industry, 2015-2032
Table 16: North America Industrial Filling Machine Market Volume (Units) Forecast by End Use Industry, 2015-2032
Table 17: Latin America Industrial Filling Machine Market Value (US$ Mn) Forecast by Country, 2015-2032
Table 18: Latin America Industrial Filling Machine Market Volume (Units) Forecast by Country, 2015-2032
Table 19: Latin America Industrial Filling Machine Market Value (US$ Mn) Forecast by Machine Output, 2015-2032
Table 20: Latin America Industrial Filling Machine Market Volume (Units) Forecast by Machine Output, 2015-2032
Table 21: Latin America Industrial Filling Machine Market Value (US$ Mn) Forecast by Automation, 2015-2032
Table 22: Latin America Industrial Filling Machine Market Volume (Units) Forecast by Automation, 2015-2032
Table 23: Latin America Industrial Filling Machine Market Value (US$ Mn) Forecast by End Use Industry, 2015-2032
Table 24: Latin America Industrial Filling Machine Market Volume (Units) Forecast by End Use Industry, 2015-2032
Table 25: Europe Industrial Filling Machine Market Value (US$ Mn) Forecast by Country, 2015-2032
Table 26: Europe Industrial Filling Machine Market Volume (Units) Forecast by Country, 2015-2032
Table 27: Europe Industrial Filling Machine Market Value (US$ Mn) Forecast by Machine Output, 2015-2032
Table 28: Europe Industrial Filling Machine Market Volume (Units) Forecast by Machine Output, 2015-2032
Table 29: Europe Industrial Filling Machine Market Value (US$ Mn) Forecast by Automation, 2015-2032
Table 30: Europe Industrial Filling Machine Market Volume (Units) Forecast by Automation, 2015-2032
Table 31: Europe Industrial Filling Machine Market Value (US$ Mn) Forecast by End Use Industry, 2015-2032
Table 32: Europe Industrial Filling Machine Market Volume (Units) Forecast by End Use Industry, 2015-2032
Table 33: East Asia Industrial Filling Machine Market Value (US$ Mn) Forecast by Country, 2015-2032
Table 34: East Asia Industrial Filling Machine Market Volume (Units) Forecast by Country, 2015-2032
Table 35: East Asia Industrial Filling Machine Market Value (US$ Mn) Forecast by Machine Output, 2015-2032
Table 36: East Asia Industrial Filling Machine Market Volume (Units) Forecast by Machine Output, 2015-2032
Table 37: East Asia Industrial Filling Machine Market Value (US$ Mn) Forecast by Automation, 2015-2032
Table 38: East Asia Industrial Filling Machine Market Volume (Units) Forecast by Automation, 2015-2032
Table 39: East Asia Industrial Filling Machine Market Value (US$ Mn) Forecast by End Use Industry, 2015-2032
Table 40: East Asia Industrial Filling Machine Market Volume (Units) Forecast by End Use Industry, 2015-2032
Table 41: South Asia Industrial Filling Machine Market Value (US$ Mn) Forecast by Country, 2015-2032
Table 42: South Asia Industrial Filling Machine Market Volume (Units) Forecast by Country, 2015-2032
Table 43: South Asia Industrial Filling Machine Market Value (US$ Mn) Forecast by Machine Output, 2015-2032
Table 44: South Asia Industrial Filling Machine Market Volume (Units) Forecast by Machine Output, 2015-2032
Table 45: South Asia Industrial Filling Machine Market Value (US$ Mn) Forecast by Automation, 2015-2032
Table 46: South Asia Industrial Filling Machine Market Volume (Units) Forecast by Automation, 2015-2032
Table 47: South Asia Industrial Filling Machine Market Value (US$ Mn) Forecast by End Use Industry, 2015-2032
Table 48: South Asia Industrial Filling Machine Market Volume (Units) Forecast by End Use Industry, 2015-2032
Table 49: Oceania Industrial Filling Machine Market Value (US$ Mn) Forecast by Country, 2015-2032
Table 50: Oceania Industrial Filling Machine Market Volume (Units) Forecast by Country, 2015-2032
Table 51: Oceania Industrial Filling Machine Market Value (US$ Mn) Forecast by Machine Output, 2015-2032
Table 52: Oceania Industrial Filling Machine Market Volume (Units) Forecast by Machine Output, 2015-2032
Table 53: Oceania Industrial Filling Machine Market Value (US$ Mn) Forecast by Automation, 2015-2032
Table 54: Oceania Industrial Filling Machine Market Volume (Units) Forecast by Automation, 2015-2032
Table 55: Oceania Industrial Filling Machine Market Value (US$ Mn) Forecast by End Use Industry, 2015-2032
Table 56: Oceania Industrial Filling Machine Market Volume (Units) Forecast by End Use Industry, 2015-2032
Table 57: MEA Industrial Filling Machine Market Value (US$ Mn) Forecast by Country, 2015-2032
Table 58: MEA Industrial Filling Machine Market Volume (Units) Forecast by Country, 2015-2032
Table 59: MEA Industrial Filling Machine Market Value (US$ Mn) Forecast by Machine Output, 2015-2032
Table 60: MEA Industrial Filling Machine Market Volume (Units) Forecast by Machine Output, 2015-2032
Table 61: MEA Industrial Filling Machine Market Value (US$ Mn) Forecast by Automation, 2015-2032
Table 62: MEA Industrial Filling Machine Market Volume (Units) Forecast by Automation, 2015-2032
Table 63: MEA Industrial Filling Machine Market Value (US$ Mn) Forecast by End Use Industry, 2015-2032
Table 64: MEA Industrial Filling Machine Market Volume (Units) Forecast by End Use Industry, 2015-2032
Table 65: U.S. Industrial Filling Machine Market Value (US$ Mn) Forecast by Machine Output, Automation, and End Use Industry (2022(E) & 2032(F))
Table 66: Canada Industrial Filling Machine Market Value (US$ Mn) Forecast by Machine Output, Automation, and End Use Industry (2022(E) & 2032(F))
Table 67: Brazil Industrial Filling Machine Market Value (US$ Mn) Forecast by Machine Output, Automation, and End Use Industry (2022(E) & 2032(F))
Table 68: Mexico Industrial Filling Machine Market Value (US$ Mn) Forecast by Machine Output, Automation, and End Use Industry (2022(E) & 2032(F))
Table 69: Germany Industrial Filling Machine Market Value (US$ Mn) Forecast by Machine Output, Automation, and End Use Industry (2022(E) & 2032(F))
Table 70: Italy Industrial Filling Machine Market Value (US$ Mn) Forecast by Machine Output, Automation, and End Use Industry (2022(E) & 2032(F))
Table 71: France Industrial Filling Machine Market Value (US$ Mn) Forecast by Machine Output, Automation, and End Use Industry (2022(E) & 2032(F))
Table 72: Spain Industrial Filling Machine Market Value (US$ Mn) Forecast by Machine Output, Automation, and End Use Industry (2022(E) & 2032(F))
Table 73: U.K. Industrial Filling Machine Market Value (US$ Mn) Forecast by Machine Output, Automation, and End Use Industry (2022(E) & 2032(F))
Table 74: Russia Industrial Filling Machine Market Value (US$ Mn) Forecast by Machine Output, Automation, and End Use Industry (2022(E) & 2032(F))
Table 75: China Industrial Filling Machine Market Value (US$ Mn) Forecast by Machine Output, Automation, and End Use Industry (2022(E) & 2032(F))
Table 76: Japan Industrial Filling Machine Market Value (US$ Mn) Forecast by Machine Output, Automation, and End Use Industry (2022(E) & 2032(F))
Table 77: India Industrial Filling Machine Market Value (US$ Mn) Forecast by Machine Output, Automation, and End Use Industry (2022(E) & 2032(F))
Table 78: GCC Countries Industrial Filling Machine Market Value (US$ Mn) Forecast by Machine Output, Automation, and End Use Industry (2022(E) & 2032(F))
Table 79: Australia Industrial Filling Machine Market Value (US$ Mn) Forecast by Machine Output, Automation, and End Use Industry (2022(E) & 2032(F))
Find your sweet spots for generating winning opportunities in this market.
Talk to AnalystList of Charts
Figure 01: Global Industrial Filling Machine Market Value (US$ Mn) by Machine Output, 2022-2032
Figure 02: Global Industrial Filling Machine Market Value (US$ Mn) by Automation, 2022-2032
Figure 03: Global Industrial Filling Machine Market Value (US$ Mn) by End Use Industry, 2022-2032
Figure 04: Global Industrial Filling Machine Market Value (US$ Mn) by Region, 2022-2032
Figure 05: Global Industrial Filling Machine Market Value (US$ Mn) Analysis by Region, 2015-2021
Figure 06: Global Industrial Filling Machine Market Volume (Units) Analysis by Region, 2015-2032
Figure 07: Global Industrial Filling Machine Market Value Share (%) and BPS Analysis by Region, 2022 & 2032
Figure 08: Global Industrial Filling Machine Market Y-o-Y Growth (%) Projections by Region, 2022-2032
Figure 09: Global Industrial Filling Machine Market Value (US$ Mn) Analysis by Machine Output, 2015-2021
Figure 10: Global Industrial Filling Machine Market Volume (Units) Analysis by Machine Output, 2015-2032
Figure 11: Global Industrial Filling Machine Market Value Share (%) and BPS Analysis by Machine Output, 2022 & 2032
Figure 12: Global Industrial Filling Machine Market Y-o-Y Growth (%) Projections by Machine Output, 2022-2032
Figure 13: Global Industrial Filling Machine Market Value (US$ Mn) Analysis by Automation, 2015-2021
Figure 14: Global Industrial Filling Machine Market Volume (Units) Analysis by Automation, 2015-2032
Figure 15: Global Industrial Filling Machine Market Value Share (%) and BPS Analysis by Automation, 2022 & 2032
Figure 16: Global Industrial Filling Machine Market Y-o-Y Growth (%) Projections by Automation, 2022-2032
Figure 17: Global Industrial Filling Machine Market Value (US$ Mn) Analysis by End Use Industry, 2015-2021
Figure 18: Global Industrial Filling Machine Market Volume (Units) Analysis by End Use Industry, 2015-2032
Figure 19: Global Industrial Filling Machine Market Value Share (%) and BPS Analysis by End Use Industry, 2022 & 2032
Figure 20: Global Industrial Filling Machine Market Y-o-Y Growth (%) Projections by End Use Industry, 2022-2032
Figure 21: Global Industrial Filling Machine Market Attractiveness by Machine Output, 2022-2032
Figure 22: Global Industrial Filling Machine Market Attractiveness by Automation, 2022-2032
Figure 23: Global Industrial Filling Machine Market Attractiveness by Application, 2022-2032
Figure 24: Global Industrial Filling Machine Market Attractiveness by End Use Industry, 2022-2032
Figure 25: Global Industrial Filling Machine Market Attractiveness by Region, 2022-2032
Figure 26: North America Industrial Filling Machine Market Value (US$ Mn) by Machine Output, 2022-2032
Figure 27: North America Industrial Filling Machine Market Value (US$ Mn) by Automation, 2022-2032
Figure 28: North America Industrial Filling Machine Market Value (US$ Mn) by End Use Industry, 2022-2032
Figure 29: North America Industrial Filling Machine Market Value (US$ Mn) by Country, 2022-2032
Figure 30: North America Industrial Filling Machine Market Value (US$ Mn) Analysis by Country, 2015-2021
Figure 31: North America Industrial Filling Machine Market Volume (Units) Analysis by Country, 2015-2032
Figure 32: North America Industrial Filling Machine Market Value Share (%) and BPS Analysis by Country, 2022 & 2032
Figure 33: North America Industrial Filling Machine Market Y-o-Y Growth (%) Projections by Country, 2022-2032
Figure 34: North America Industrial Filling Machine Market Value (US$ Mn) Analysis by Machine Output, 2015-2021
Figure 35: North America Industrial Filling Machine Market Volume (Units) Analysis by Machine Output, 2015-2032
Figure 36: North America Industrial Filling Machine Market Value Share (%) and BPS Analysis by Machine Output, 2022 & 2032
Figure 37: North America Industrial Filling Machine Market Y-o-Y Growth (%) Projections by Machine Output, 2022-2032
Figure 38: North America Industrial Filling Machine Market Value (US$ Mn) Analysis by Automation, 2015-2021
Figure 39: North America Industrial Filling Machine Market Volume (Units) Analysis by Automation, 2015-2032
Figure 40: North America Industrial Filling Machine Market Value Share (%) and BPS Analysis by Automation, 2022 & 2032
Figure 41: North America Industrial Filling Machine Market Y-o-Y Growth (%) Projections by Automation, 2022-2032
Figure 42: North America Industrial Filling Machine Market Value (US$ Mn) Analysis by End Use Industry, 2015-2021
Figure 43: North America Industrial Filling Machine Market Volume (Units) Analysis by End Use Industry, 2015-2032
Figure 44: North America Industrial Filling Machine Market Value Share (%) and BPS Analysis by End Use Industry, 2022 & 2032
Figure 45: North America Industrial Filling Machine Market Y-o-Y Growth (%) Projections by End Use Industry, 2022-2032
Figure 46: North America Industrial Filling Machine Market Attractiveness by Machine Output, 2022-2032
Figure 47: North America Industrial Filling Machine Market Attractiveness by Automation, 2022-2032
Figure 48: North America Industrial Filling Machine Market Attractiveness by End Use Industry, 2022-2032
Figure 49: North America Industrial Filling Machine Market Attractiveness by Country, 2022-2032
Figure 50: Latin America Industrial Filling Machine Market Value (US$ Mn) by Machine Output, 2022 & 2032
Figure 51: Latin America Industrial Filling Machine Market Value (US$ Mn) by Automation, 2022-2032
Figure 52: Latin America Industrial Filling Machine Market Value (US$ Mn) by End Use Industry, 2022-2032
Figure 53: Latin America Industrial Filling Machine Market Value (US$ Mn) by Country, 2022-2032
Figure 54: Latin America Industrial Filling Machine Market Value (US$ Mn) Analysis by Country, 2015-2021
Figure 55: Latin America Industrial Filling Machine Market Volume (Units) Analysis by Country, 2015-2032
Figure 56: Latin America Industrial Filling Machine Market Value Share (%) and BPS Analysis by Country, 2022 & 2032
Figure 57: Latin America Industrial Filling Machine Market Y-o-Y Growth (%) Projections by Country, 2022-2032
Figure 58: Latin America Industrial Filling Machine Market Value (US$ Mn) Analysis by Machine Output, 2015-2021
Figure 59: Latin America Industrial Filling Machine Market Volume (Units) Analysis by Machine Output, 2015-2032
Figure 60: Latin America Industrial Filling Machine Market Value Share (%) and BPS Analysis by Machine Output, 2022 & 2032
Figure 61: Latin America Industrial Filling Machine Market Y-o-Y Growth (%) Projections by Machine Output, 2022-2032
Figure 62: Latin America Industrial Filling Machine Market Value (US$ Mn) Analysis by Automation, 2015-2021
Figure 63: Latin America Industrial Filling Machine Market Volume (Units) Analysis by Automation, 2015-2032
Figure 64: Latin America Industrial Filling Machine Market Value Share (%) and BPS Analysis by Automation, 2022 & 2032
Figure 65: Latin America Industrial Filling Machine Market Y-o-Y Growth (%) Projections by Automation, 2022-2032
Figure 66: Latin America Industrial Filling Machine Market Value (US$ Mn) Analysis by End Use Industry, 2015-2021
Figure 67: Latin America Industrial Filling Machine Market Volume (Units) Analysis by End Use Industry, 2015-2032
Figure 68: Latin America Industrial Filling Machine Market Value Share (%) and BPS Analysis by End Use Industry, 2022 & 2032
Figure 69: Latin America Industrial Filling Machine Market Y-o-Y Growth (%) Projections by End Use Industry, 2022-2032
Figure 70: Latin America Industrial Filling Machine Market Attractiveness by Machine Output, 2022-2032
Figure 71: Latin America Industrial Filling Machine Market Attractiveness by Automation, 2022-2032
Figure 72: Latin America Industrial Filling Machine Market Attractiveness by End Use Industry, 2022-2032
Figure 73: Latin America Industrial Filling Machine Market Attractiveness by Country, 2022-2032
Figure 74: Europe Industrial Filling Machine Market Value (US$ Mn) by Machine Output, 2022-2032
Figure 75: Europe Industrial Filling Machine Market Value (US$ Mn) by Automation, 2022-2032
Figure 76: Europe Industrial Filling Machine Market Value (US$ Mn) by End Use Industry, 2022-2032
Figure 77: Europe Industrial Filling Machine Market Value (US$ Mn) by Country, 2022-2032
Figure 78: Europe Industrial Filling Machine Market Value (US$ Mn) Analysis by Country, 2015-2021
Figure 79: Europe Industrial Filling Machine Market Volume (Units) Analysis by Country, 2015-2032
Figure 80: Europe Industrial Filling Machine Market Value Share (%) and BPS Analysis by Country, 2022 & 2032
Figure 81: Europe Industrial Filling Machine Market Y-o-Y Growth (%) Projections by Country, 2022-2032
Figure 82: Europe Industrial Filling Machine Market Value (US$ Mn) Analysis by Machine Output, 2015-2021
Figure 83: Europe Industrial Filling Machine Market Volume (Units) Analysis by Machine Output, 2015-2032
Figure 84: Europe Industrial Filling Machine Market Value Share (%) and BPS Analysis by Machine Output, 2022 & 2032
Figure 85: Europe Industrial Filling Machine Market Y-o-Y Growth (%) Projections by Machine Output, 2022-2032
Figure 86: Europe Industrial Filling Machine Market Value (US$ Mn) Analysis by Automation, 2015-2021
Figure 87: Europe Industrial Filling Machine Market Volume (Units) Analysis by Automation, 2015-2032
Figure 88: Europe Industrial Filling Machine Market Value Share (%) and BPS Analysis by Automation, 2022 & 2032
Figure 89: Europe Industrial Filling Machine Market Y-o-Y Growth (%) Projections by Automation, 2022-2032
Figure 90: Europe Industrial Filling Machine Market Value (US$ Mn) Analysis by End Use Industry, 2015-2021
Figure 91: Europe Industrial Filling Machine Market Volume (Units) Analysis by End Use Industry, 2015-2032
Figure 92: Europe Industrial Filling Machine Market Value Share (%) and BPS Analysis by End Use Industry, 2022 & 2032
Figure 93: Europe Industrial Filling Machine Market Y-o-Y Growth (%) Projections by End Use Industry, 2022-2032
Figure 94: Europe Industrial Filling Machine Market Attractiveness by Machine Output, 2022-2032
Figure 95: Europe Industrial Filling Machine Market Attractiveness by Automation, 2022-2032
Figure 96: Europe Industrial Filling Machine Market Attractiveness by End Use Industry, 2022-2032
Figure 97: Europe Industrial Filling Machine Market Attractiveness by Country, 2022-2032
Figure 98: East Asia Industrial Filling Machine Market Value (US$ Mn) by Machine Output, 2022-2032
Figure 99: East Asia Industrial Filling Machine Market Value (US$ Mn) by Automation, 2022-2032
Figure 100: East Asia Industrial Filling Machine Market Value (US$ Mn) by End Use Industry, 2022-2032
Figure 101: East Asia Industrial Filling Machine Market Value (US$ Mn) by Country, 2022-2032
Figure 102: East Asia Industrial Filling Machine Market Value (US$ Mn) Analysis by Country, 2015-2021
Figure 103: East Asia Industrial Filling Machine Market Volume (Units) Analysis by Country, 2015-2032
Figure 104: East Asia Industrial Filling Machine Market Value Share (%) and BPS Analysis by Country, 2022 & 2032
Figure 105: East Asia Industrial Filling Machine Market Y-o-Y Growth (%) Projections by Country, 2022-2032
Figure 106: East Asia Industrial Filling Machine Market Value (US$ Mn) Analysis by Machine Output, 2015-2021
Figure 107: East Asia Industrial Filling Machine Market Volume (Units) Analysis by Machine Output, 2015-2032
Figure 108: East Asia Industrial Filling Machine Market Value Share (%) and BPS Analysis by Machine Output, 2022 & 2032
Figure 109: East Asia Industrial Filling Machine Market Y-o-Y Growth (%) Projections by Machine Output, 2022-2032
Figure 110: East Asia Industrial Filling Machine Market Value (US$ Mn) Analysis by Automation, 2015-2021
Figure 111: East Asia Industrial Filling Machine Market Volume (Units) Analysis by Automation, 2015-2032
Figure 112: East Asia Industrial Filling Machine Market Value Share (%) and BPS Analysis by Automation, 2022 & 2032
Figure 113: East Asia Industrial Filling Machine Market Y-o-Y Growth (%) Projections by Automation, 2022-2032
Figure 114: East Asia Industrial Filling Machine Market Value (US$ Mn) Analysis by End Use Industry, 2015-2021
Figure 115: East Asia Industrial Filling Machine Market Volume (Units) Analysis by End Use Industry, 2015-2032
Figure 116: East Asia Industrial Filling Machine Market Value Share (%) and BPS Analysis by End Use Industry, 2022 & 2032
Figure 117: East Asia Industrial Filling Machine Market Y-o-Y Growth (%) Projections by End Use Industry, 2022-2032
Figure 118: East Asia Industrial Filling Machine Market Attractiveness by Machine Output, 2022-2032
Figure 119: East Asia Industrial Filling Machine Market Attractiveness by Automation, 2022-2032
Figure 120: East Asia Industrial Filling Machine Market Attractiveness by End Use Industry, 2022-2032
Figure 121: East Asia Industrial Filling Machine Market Attractiveness by Country, 2022-2032
Figure 122: South Asia Industrial Filling Machine Market Value (US$ Mn) by Machine Output, 2022-2032
Figure 123: South Asia Industrial Filling Machine Market Value (US$ Mn) by Automation, 2022-2032
Figure 124: South Asia Industrial Filling Machine Market Value (US$ Mn) by End Use Industry, 2022-2032
Figure 125: South Asia Industrial Filling Machine Market Value (US$ Mn) by Country, 2022-2032
Figure 126: South Asia Industrial Filling Machine Market Value (US$ Mn) Analysis by Country, 2015-2021
Figure 127: South Asia Industrial Filling Machine Market Volume (Units) Analysis by Country, 2015-2032
Figure 128: South Asia Industrial Filling Machine Market Value Share (%) and BPS Analysis by Country, 2022 & 2032
Figure 129: South Asia Industrial Filling Machine Market Y-o-Y Growth (%) Projections by Country, 2022-2032
Figure 130: South Asia Industrial Filling Machine Market Value (US$ Mn) Analysis by Machine Output, 2015-2021
Figure 131: South Asia Industrial Filling Machine Market Volume (Units) Analysis by Machine Output, 2015-2032
Figure 132: South Asia Industrial Filling Machine Market Value Share (%) and BPS Analysis by Machine Output, 2022 & 2032
Figure 133: South Asia Industrial Filling Machine Market Y-o-Y Growth (%) Projections by Machine Output, 2022-2032
Figure 134: South Asia Industrial Filling Machine Market Value (US$ Mn) Analysis by Automation, 2015-2021
Figure 135: South Asia Industrial Filling Machine Market Volume (Units) Analysis by Automation, 2015-2032
Figure 136: South Asia Industrial Filling Machine Market Value Share (%) and BPS Analysis by Automation, 2022 & 2032
Figure 137: South Asia Industrial Filling Machine Market Y-o-Y Growth (%) Projections by Automation, 2022-2032
Figure 138: South Asia Industrial Filling Machine Market Value (US$ Mn) Analysis by End Use Industry, 2015-2021
Figure 139: South Asia Industrial Filling Machine Market Volume (Units) Analysis by End Use Industry, 2015-2032
Figure 140: South Asia Industrial Filling Machine Market Value Share (%) and BPS Analysis by End Use Industry, 2022 & 2032
Figure 141: South Asia Industrial Filling Machine Market Y-o-Y Growth (%) Projections by End Use Industry, 2022-2032
Figure 142: South Asia Industrial Filling Machine Market Attractiveness by Machine Output, 2022-2032
Figure 143: South Asia Industrial Filling Machine Market Attractiveness by Automation, 2022-2032
Figure 144: South Asia Industrial Filling Machine Market Attractiveness by End Use Industry, 2022-2032
Figure 145: South Asia Industrial Filling Machine Market Attractiveness by Country, 2022-2032
Figure 146: Oceania Industrial Filling Machine Market Value (US$ Mn) by Machine Output, 2022-2032
Figure 147: Oceania Industrial Filling Machine Market Value (US$ Mn) by Automation, 2022-2032
Figure 148: Oceania Industrial Filling Machine Market Value (US$ Mn) by End Use Industry, 2022-2032
Figure 149: Oceania Industrial Filling Machine Market Value (US$ Mn) by Country, 2022-2032
Figure 150: Oceania Industrial Filling Machine Market Value (US$ Mn) Analysis by Country, 2015-2021
Figure 151: Oceania Industrial Filling Machine Market Volume (Units) Analysis by Country, 2015-2032
Figure 152: Oceania Industrial Filling Machine Market Value Share (%) and BPS Analysis by Country, 2022 & 2032
Figure 153: Oceania Industrial Filling Machine Market Y-o-Y Growth (%) Projections by Country, 2022-2032
Figure 154: Oceania Industrial Filling Machine Market Value (US$ Mn) Analysis by Machine Output, 2015-2021
Figure 155: Oceania Industrial Filling Machine Market Volume (Units) Analysis by Machine Output, 2015-2032
Figure 156: Oceania Industrial Filling Machine Market Value Share (%) and BPS Analysis by Machine Output, 2022 & 2032
Figure 157: Oceania Industrial Filling Machine Market Y-o-Y Growth (%) Projections by Machine Output, 2022-2032
Figure 158: Oceania Industrial Filling Machine Market Value (US$ Mn) Analysis by Automation, 2015-2021
Figure 159: Oceania Industrial Filling Machine Market Volume (Units) Analysis by Automation, 2015-2032
Figure 160: Oceania Industrial Filling Machine Market Value Share (%) and BPS Analysis by Automation, 2022 & 2032
Figure 161: Oceania Industrial Filling Machine Market Y-o-Y Growth (%) Projections by Automation, 2022-2032
Figure 162: Oceania Industrial Filling Machine Market Value (US$ Mn) Analysis by End Use Industry, 2015-2021
Figure 163: Oceania Industrial Filling Machine Market Volume (Units) Analysis by End Use Industry, 2015-2032
Figure 164: Oceania Industrial Filling Machine Market Value Share (%) and BPS Analysis by End Use Industry, 2022 & 2032
Figure 165: Oceania Industrial Filling Machine Market Y-o-Y Growth (%) Projections by End Use Industry, 2022-2032
Figure 166: Oceania Industrial Filling Machine Market Attractiveness by Machine Output, 2022-2032
Figure 167: Oceania Industrial Filling Machine Market Attractiveness by Automation, 2022-2032
Figure 168: Oceania Industrial Filling Machine Market Attractiveness by End Use Industry, 2022-2032
Figure 169 Oceania Industrial Filling Machine Market Attractiveness by Country, 2022-2032
Figure 170: MEA Industrial Filling Machine Market Value (US$ Mn) by Machine Output, 2022-2032
Figure 171: MEA Industrial Filling Machine Market Value (US$ Mn) by Automation, 2022-2032
Figure 172: MEA Industrial Filling Machine Market Value (US$ Mn) by End Use Industry, 2022-2032
Figure 173: MEA Industrial Filling Machine Market Value (US$ Mn) by Country, 2022-2032
Figure 174: MEA Industrial Filling Machine Market Value (US$ Mn) Analysis by Country, 2015-2021
Figure 175: MEA Industrial Filling Machine Market Volume (Units) Analysis by Country, 2015-2032
Figure 176: MEA Industrial Filling Machine Market Value Share (%) and BPS Analysis by Country, 2022 & 2032
Figure 177: MEA Industrial Filling Machine Market Y-o-Y Growth (%) Projections by Country, 2022-2032
Figure 178: MEA Industrial Filling Machine Market Value (US$ Mn) Analysis by Machine Output, 2015-2021
Figure 179: MEA Industrial Filling Machine Market Volume (Units) Analysis by Machine Output, 2015-2032
Figure 180: MEA Industrial Filling Machine Market Value Share (%) and BPS Analysis by Machine Output, 2022 & 2032
Figure 181: MEA Industrial Filling Machine Market Y-o-Y Growth (%) Projections by Machine Output, 2022-2032
Figure 182: MEA Industrial Filling Machine Market Value (US$ Mn) Analysis by Automation, 2015-2021
Figure 183: MEA Industrial Filling Machine Market Volume (Units) Analysis by Automation, 2015-2032
Figure 184: MEA Industrial Filling Machine Market Value Share (%) and BPS Analysis by Automation, 2022 & 2032
Figure 185: MEA Industrial Filling Machine Market Y-o-Y Growth (%) Projections by Automation, 2022-2032
Figure 186: MEA Industrial Filling Machine Market Value (US$ Mn) Analysis by End Use Industry, 2015-2021
Figure 187: MEA Industrial Filling Machine Market Volume (Units) Analysis by End Use Industry, 2015-2032
Figure 188: MEA Industrial Filling Machine Market Value Share (%) and BPS Analysis by End Use Industry, 2022 & 2032
Figure 189: MEA Industrial Filling Machine Market Y-o-Y Growth (%) Projections by End Use Industry, 2022-2032
Figure 190: MEA Industrial Filling Machine Market Attractiveness by Machine Output, 2022-2032
Figure 191: MEA Industrial Filling Machine Market Attractiveness by Automation, 2022-2032
Figure 192: MEA Industrial Filling Machine Market Attractiveness by End Use Industry, 2022-2032
Figure 193 MEA Industrial Filling Machine Market Attractiveness by Country, 2022-2032
Need specific information?
Request CustomizationExplore Packaging Insights
View Reports