The global industrial nailers market is valued at USD 788.6 million in 2025 and is slated to reach USD 1,671.3 million by 2035, recording an absolute increase of USD 882.6 million over the forecast period. This translates into a total growth of 112%, with the market forecast to expand at a compound annual growth rate (CAGR) of 7.8% between 2025 and 2035. The overall market size is expected to grow by nearly 2.1X during the same period, supported by increasing global construction activities, growing demand for efficient fastening tools, and rising adoption of pneumatic and cordless nailer technologies across diverse industrial applications.
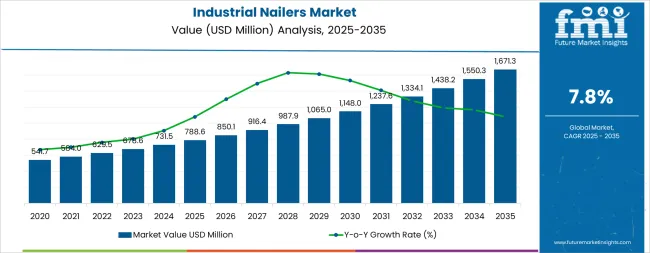
Between 2025 and 2030, the industrial nailers market is projected to expand from USD 788.6 million to USD 1.1 billion, resulting in a value increase of USD 311.4 million, which represents 35.3% of the total forecast growth for the decade. This phase of development will be shaped by increasing construction sector growth, rising infrastructure development projects, and growing adoption of pneumatic nailer solutions in framing and construction applications. Equipment manufacturers are expanding their production capabilities to address the growing demand for efficient fastening solutions and enhanced operational productivity.
| Metric | Value |
|---|---|
| Estimated Value (2025E) | USD 788.6 million |
| Forecast Value (2035F) | USD 1,671.3 million |
| Forecast CAGR (2025 to 2035) | 7.8% |
From 2030 to 2035, the market is forecast to grow from USD 1.1 billion to USD 1,671.3 million, adding another USD 571.2 million, which constitutes 64.7% of the overall ten-year expansion. This period is expected to be characterized by the expansion of cordless and gas-powered nailer systems, the integration of smart nailer technologies, and the development of automated fastening solutions for construction and manufacturing facilities. The growing adoption of energy efficiency programs and advanced tool technologies will drive demand for industrial nailers with enhanced operational efficiency and reduced maintenance requirements.
Between 2020 and 2025, the industrial nailers market experienced steady recovery growth, driven by increasing construction activity demand recovery and growing recognition of industrial nailers as essential equipment for construction, manufacturing, and automotive assembly operations. The market developed as industries recognized the potential for efficient fastening tools to enhance operational productivity while reducing labor costs and improving project completion times. Technological advancement in pneumatic systems and cordless technologies began emphasizing the critical importance of maintaining operational efficiency and safety compliance in construction and manufacturing operations.
Market expansion is being supported by the increasing global construction activities and the corresponding need for efficient fastening equipment that can maintain operational productivity and project completion reliability while supporting diverse construction applications across various building environments. Modern construction companies are increasingly focused on implementing tool solutions that can reduce labor time, minimize operational costs, and provide consistent performance in framing and assembly operations. Industrial nailers' proven ability to deliver enhanced operational efficiency, reliable fastening capabilities, and versatile construction applications make them essential equipment for contemporary construction operations and manufacturing assembly solutions.
The growing emphasis on construction modernization and operational efficiency is driving demand for industrial nailers that can support high-volume fastening, reduce project completion time, and enable efficient building operations across varying construction configurations. Construction operators' preference for equipment that combines reliability with operational efficiency and cost-effectiveness is creating opportunities for innovative nailer implementations. The rising influence of safety regulations and automated construction technologies is also contributing to increased adoption of industrial nailers that can provide advanced operational control without compromising performance or safety compliance.
The industrial nailers market is poised for robust growth and transformation. As construction companies and manufacturers across both developed and emerging markets seek fastening equipment that is efficient, reliable, automated, and safety-compliant, industrial nailer systems are gaining prominence not just as operational tools but as strategic infrastructure for operational efficiency, project completion reliability, productivity enhancement, and safety compliance.
Rising construction activities and manufacturing expansion in East Asia, North America, and Western Europe amplify demand, while manufacturers are picking up on innovations in pneumatic technologies and cordless applications.
Pathways like pneumatic nailer adoption, cordless integration, and smart fastening technologies promise strong margin uplift, especially in developed markets. Geographic expansion and application diversification will capture volume, particularly where construction activities are growing or manufacturing infrastructure requires modernization. Safety pressures around accident reduction, operational efficiency, and performance enhancement give structural support.
The market is segmented by category, application, nail length, and region. By category, the market is divided into pneumatic industrial nailers, cordless industrial nailers, and gas-powered industrial nailers. By application, it covers furniture, millwork, pallets & crating, leather goods manufacturing, steel skids, construction & framing, automotive interiors, and others. By nail length, it is segmented into less than 20 mm, 20 to 40 mm, 40 to 60 mm, 60 to 80 mm, and above 80 mm. Regionally, the market is divided into North America, Latin America, Western Europe, Eastern Europe, East Asia, South Asia Pacific, and Middle East & Africa.
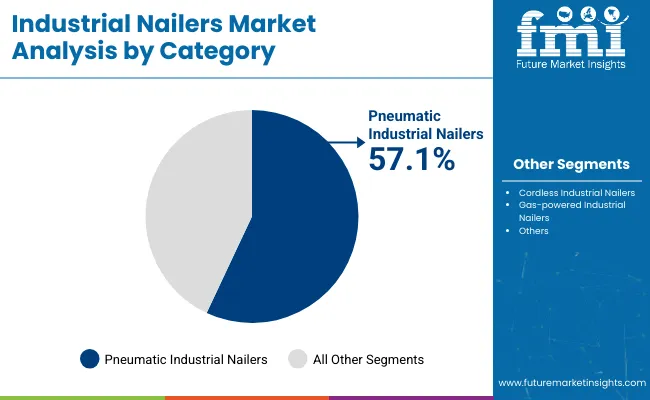
The pneumatic industrial nailers segment is projected to account for 57.1% of the industrial nailers market in 2025, reaffirming its position as the leading category. Construction operators and manufacturers increasingly utilize pneumatic nailers for their proven reliability, high-speed performance, and cost-effectiveness in fastening applications across construction framing, manufacturing assembly, and industrial equipment applications. Pneumatic nailer technology's established operational procedures and consistent performance output directly address the construction requirements for reliable fastening operations and operational efficiency in diverse building environments.
This category segment forms the foundation of current construction fastening operations, as it represents the technology with the greatest operational reliability and established maintenance infrastructure across multiple applications and construction scenarios. Operator investments in enhanced pneumatic systems and operational optimization continue to strengthen adoption among construction companies and manufacturers. With operators prioritizing operational reliability and equipment availability, pneumatic nailers align with both operational efficiency objectives and cost management requirements, making them the central component of comprehensive fastening strategies.
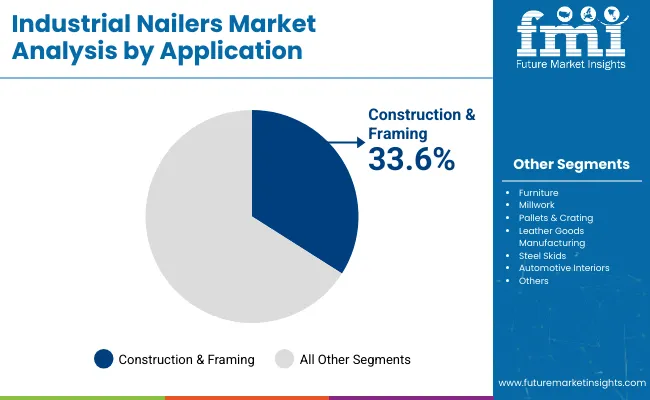
Construction & framing is projected to represent 33.6% of industrial nailers demand in 2025, underscoring its critical role as the primary application of nailers for construction projects and building operations. Construction operators prefer industrial nailers for their efficiency, reliability, and ability to handle high-volume fastening while supporting project schedules and building requirements. Positioned as essential equipment for modern construction operations, nailers offer both operational advantages and performance benefits.
The segment is supported by continuous innovation in construction equipment development and the growing availability of specialized nailer configurations that enable efficient fastening with enhanced operational capabilities. Construction companies are investing in tool optimization to support large-scale operations and project delivery. As construction demand becomes more prevalent and operational efficiency requirements increase, construction & framing will continue to dominate the application market while supporting advanced tool utilization and building operational strategies.
The industrial nailers market is advancing steadily due to increasing construction activities and growing adoption of operational efficiency infrastructure that provides enhanced fastening capabilities and project completion reliability across diverse construction applications. However, the market faces challenges, including high equipment capital costs, specialized maintenance infrastructure requirements, and varying operational requirements across different construction environments. Innovation in pneumatic technologies and cordless systems continues to influence tool development and market expansion patterns.
The growing expansion of construction projects and infrastructure development is enabling tool manufacturers to develop industrial nailer systems that provide superior operational efficiency, enhanced fastening capabilities, and reliable performance in high-demand construction environments. Advanced nailer systems provide improved operational capacity while allowing more effective project completion and consistent performance delivery across various applications and construction requirements. Manufacturers are increasingly recognizing the competitive advantages of modern nailer capabilities for operational efficiency and construction productivity positioning.
Modern industrial nailer manufacturers are incorporating pneumatic systems and cordless technologies to enhance operational efficiency, reduce equipment dependency, and ensure consistent performance delivery to construction operators. These technologies improve operational reliability while enabling new applications, including automated fastening and smart tool management solutions. Advanced technology integration also allows manufacturers to support premium equipment positioning and operational optimization beyond traditional fastening tool supply.
| Country | CAGR (2025-2035) |
|---|---|
| USA | 6.9% |
| China | 7.2% |
| Germany | 6.5% |
| Japan | 5.8% |
| India | 7.5% |
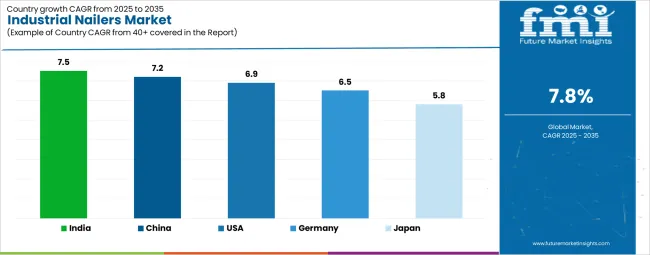
The industrial nailers market is experiencing robust growth globally, with India leading at a 7.5% CAGR through 2035, driven by rapid construction expansion, infrastructure development projects, and growing adoption of efficient fastening technologies. China follows at 7.2%, supported by massive urbanization initiatives, construction sector growth, and increasing demand for high-performance nailer solutions. USA shows growth at 6.9%, emphasizing construction modernization and advanced manufacturing capabilities. Germany records 6.5%, focusing on precision engineering and smart tool integration. Japan demonstrates 5.8% growth, supported by construction technology advancement and operational optimization initiatives.
The report covers an in-depth analysis of 15+ countries top-performing countries are highlighted below.
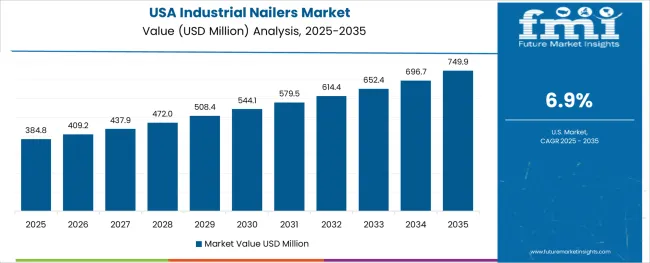
Revenue from industrial nailers in the USA is projected to exhibit strong growth with a CAGR of 6.9% through 2035, driven by extensive construction sector expansion and rapidly growing adoption of pneumatic nailer solutions supported by infrastructure development and operational efficiency initiatives. The country's comprehensive construction infrastructure and increasing investment in advanced fastening technologies are creating substantial demand for efficient industrial nailer solutions. Major construction companies and manufacturers are establishing comprehensive tool systems to serve both domestic operations and export requirements.
Revenue from industrial nailers in China is expanding at a CAGR of 7.2%, supported by the country's massive urbanization projects, extensive construction infrastructure development, and increasing adoption of automated fastening systems. The country's comprehensive construction strategy and growing manufacturing demand are driving advanced nailer capabilities. State construction companies and manufacturing enterprises are establishing extensive equipment operations to address the growing demand for efficient fastening operations and operational reliability.
Revenue from industrial nailers in Germany is expanding at a CAGR of 6.5%, supported by the country's strong manufacturing base, advanced construction techniques, and emphasis on precision engineering. The focus on smart tools, along with advanced construction methods, is accelerating the trend toward cordless and battery-powered nailers for construction and framing applications. German companies are investing in research and development to produce lightweight, energy-efficient, and multi-functional nailers with safety features.
Revenue from industrial nailers in Japan is growing at a CAGR of 5.8%, driven by expanding construction technology programs, increasing operational precision requirements, and growing investment in manufacturing enhancement. The country's established construction infrastructure and emphasis on technology integration are supporting demand for advanced nailer technologies across major construction markets. Construction operators and equipment manufacturers are establishing comprehensive tool programs to serve both domestic construction needs and technology export requirements.
Revenue from industrial nailers in India is expanding at a CAGR of 7.5%, supported by the country's growing construction sector, increasing infrastructure development demand, and strategic investment in building projects. India's expanding construction market and emphasis on operational efficiency are driving demand for cost-effective nailer technologies across major construction markets. Construction companies and manufacturing operators are establishing equipment partnerships to serve both domestic construction expansion and operational efficiency requirements.
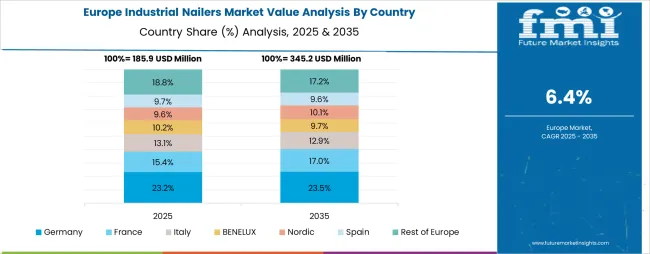
The industrial nailers market in Europe is projected to grow from USD 120.0 million in 2025 to USD 250 million by 2035, registering a CAGR of 7.6% over the forecast period. Germany is expected to maintain its leadership position with a 45.2% market share in 2025, increasing to 46.1% by 2035, supported by its advanced manufacturing infrastructure, comprehensive precision engineering capabilities, and major construction facilities serving European and international markets.
United Kingdom follows with a 18.5% share in 2025, projected to ease to 18.1% by 2035, driven by construction modernization programs, operational optimization initiatives, and established manufacturing capabilities, but facing challenges from competitive pressures and investment constraints. France holds a 16.3% share in 2025, expected to decline to 15.9% by 2035, supported by construction equipment upgrades and operational efficiency requirements but facing challenges from operational optimization and investment uncertainties. Italy commands a 12.0% share in 2025, projected to reach 12.2% by 2035, while Spain accounts for 8.0% in 2025, expected to reach 7.7% by 2035. The Rest of Europe region, including Nordic countries, Netherlands, Belgium, and other European countries, is anticipated to maintain momentum, with their collective share remaining stable from 0.0% to 0.0% by 2035, attributed to increasing construction development across Nordic countries and growing manufacturing modernization across various European markets implementing tool upgrade programs.
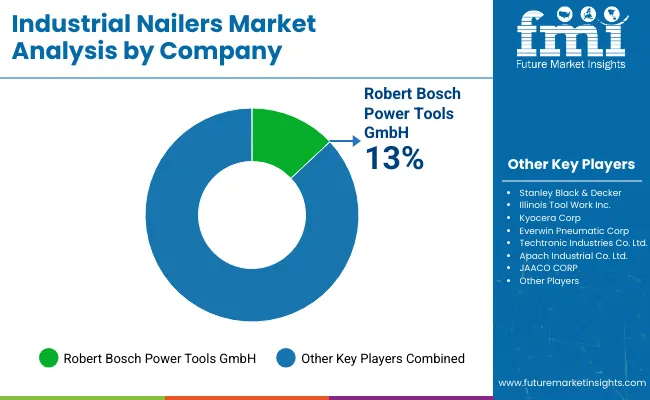
The industrial nailers market is characterized by competition among established tool manufacturers, specialized fastening technology providers, and integrated construction equipment companies. Companies are investing in advanced pneumatic nailer research, cordless technology development, operational efficiency enhancement, and comprehensive tool portfolios to deliver efficient, reliable, and safety-compliant industrial nailer solutions. Innovation in pneumatic systems, cordless technologies, and smart tool integration is central to strengthening market position and competitive advantage.
Stanley Black & Decker leads the market with a strong presence, offering comprehensive industrial nailer solutions and fastening systems with a focus on reliability and operational efficiency for construction applications. Illinois Tool Work Inc. provides extensive nailer portfolios with an emphasis on innovation, customization, and aftermarket support services. Robert Bosch Power Tools delivers specialized pneumatic nailer systems with a focus on precision manufacturing and regional adaptability. Kyocera Corp specializes in advanced fastening technologies with emphasis on construction and manufacturing applications. Everwin Pneumatic Corp focuses on pneumatic nailer solutions with emphasis on high-pressure applications and operational excellence. Techtronic Industries offers comprehensive cordless nailer equipment with emphasis on battery technology and manufacturing performance. Apach Industrial Co. Ltd. provides diverse nailer solutions with regional market leadership and cost-effective production capabilities.
| Items | Values |
|---|---|
| Quantitative Units (2025) | USD 788.6 million |
| Category | Pneumatic Industrial Nailers, Cordless Industrial Nailers, Gas-powered Industrial Nailers |
| Application | Furniture, Millwork, Pallets & Crating, Leather Goods Manufacturing, Steel Skids, Construction & Framing, Automotive Interiors, Others |
| Nail Length | Less than 20 mm, 20 to 40 mm, 40 to 60 mm, 60 to 80 mm, Above 80 mm |
| Regions Covered | North America, Latin America, Western Europe, Eastern Europe, East Asia, South Asia Pacific, Middle East & Africa |
| Countries Covered | United States, Canada, Germany, United Kingdom, France, China, Japan, Brazil, India and 15+ countries |
| Key Companies Profiled | Stanley Black & Decker, Illinois Tool Work Inc., Robert Bosch Power Tools, Kyocera Corp, Everwin Pneumatic Corp, Techtronic Industries, and Apach Industrial |
| Additional Attributes | Nailer sales by category and application, regional demand trends, competitive landscape, technological advancements in pneumatic systems, cordless technology development, operational efficiency innovation, and performance enhancement optimization |
The global industrial nailers market is estimated to be valued at USD 788.6 million in 2025.
The market size for the industrial nailers market is projected to reach USD 1,671.3 million by 2035.
The industrial nailers market is expected to grow at a 7.8% CAGR between 2025 and 2035.
The key product types in industrial nailers market are pneumatic industrial nailers, cordless industrial nailers and gas-powered industrial nailers.
In terms of application, construction & framing segment to command 33.6% share in the industrial nailers market in 2025.


Our Research Products

The "Full Research Suite" delivers actionable market intel, deep dives on markets or technologies, so clients act faster, cut risk, and unlock growth.

The Leaderboard benchmarks and ranks top vendors, classifying them as Established Leaders, Leading Challengers, or Disruptors & Challengers.

Locates where complements amplify value and substitutes erode it, forecasting net impact by horizon

We deliver granular, decision-grade intel: market sizing, 5-year forecasts, pricing, adoption, usage, revenue, and operational KPIs—plus competitor tracking, regulation, and value chains—across 60 countries broadly.

Spot the shifts before they hit your P&L. We track inflection points, adoption curves, pricing moves, and ecosystem plays to show where demand is heading, why it is changing, and what to do next across high-growth markets and disruptive tech

Real-time reads of user behavior. We track shifting priorities, perceptions of today’s and next-gen services, and provider experience, then pace how fast tech moves from trial to adoption, blending buyer, consumer, and channel inputs with social signals (#WhySwitch, #UX).

Partner with our analyst team to build a custom report designed around your business priorities. From analysing market trends to assessing competitors or crafting bespoke datasets, we tailor insights to your needs.
Supplier Intelligence
Discovery & Profiling
Capacity & Footprint
Performance & Risk
Compliance & Governance
Commercial Readiness
Who Supplies Whom
Scorecards & Shortlists
Playbooks & Docs
Category Intelligence
Definition & Scope
Demand & Use Cases
Cost Drivers
Market Structure
Supply Chain Map
Trade & Policy
Operating Norms
Deliverables
Buyer Intelligence
Account Basics
Spend & Scope
Procurement Model
Vendor Requirements
Terms & Policies
Entry Strategy
Pain Points & Triggers
Outputs
Pricing Analysis
Benchmarks
Trends
Should-Cost
Indexation
Landed Cost
Commercial Terms
Deliverables
Brand Analysis
Positioning & Value Prop
Share & Presence
Customer Evidence
Go-to-Market
Digital & Reputation
Compliance & Trust
KPIs & Gaps
Outputs
Full Research Suite comprises of:
Market outlook & trends analysis
Interviews & case studies
Strategic recommendations
Vendor profiles & capabilities analysis
5-year forecasts
8 regions and 60+ country-level data splits
Market segment data splits
12 months of continuous data updates
DELIVERED AS:
PDF EXCEL ONLINE
Industrial Grade Electrochemical CO Sensor Market Size and Share Forecast Outlook 2025 to 2035
Industrial Bench Scale Market Size and Share Forecast Outlook 2025 to 2035
Industrial Low Profile Floor Scale Market Size and Share Forecast Outlook 2025 to 2035
Industrial Sand Mill Market Size and Share Forecast Outlook 2025 to 2035
Industrial Control Network Modules Market Size and Share Forecast Outlook 2025 to 2035
Industrial Precision Oven Market Size and Share Forecast Outlook 2025 to 2035
Industrial Water Chiller for PCB Market Size and Share Forecast Outlook 2025 to 2035
Industrial & Commercial HVLS Fans Market Size and Share Forecast Outlook 2025 to 2035
Industrial Robot Controller Market Size and Share Forecast Outlook 2025 to 2035
Industrial Wired Routers Market Size and Share Forecast Outlook 2025 to 2035
Industrial Evaporative Condensers Market Size and Share Forecast Outlook 2025 to 2035
Industrial Energy Management System Market Size and Share Forecast Outlook 2025 to 2035
Industrial Insulation Market Size and Share Forecast Outlook 2025 to 2035
Industrial Safety Gloves Market Size and Share Forecast Outlook 2025 to 2035
Industrial Cleaner Market Size and Share Forecast Outlook 2025 to 2035
Industrial Dust Treatment System Market Size and Share Forecast Outlook 2025 to 2035
Industrial Vertical Washing Tower Market Size and Share Forecast Outlook 2025 to 2035
Industrial Pepper Market Size and Share Forecast Outlook 2025 to 2035
Industrial Electronics Packaging Market Forecast and Outlook 2025 to 2035
Industrial Absorbent Market Forecast and Outlook 2025 to 2035

Thank you!
You will receive an email from our Business Development Manager. Please be sure to check your SPAM/JUNK folder too.
Chat With
MaRIA