The industrial adhesives market is expected to grow from USD 58.8 billion in 2025 to USD 96.7 billion by 2035, representing substantial growth, demonstrating the accelerating adoption of advanced adhesive formulations and bonding technology across automotive assembly, e-commerce packaging, building envelope systems, and electronics manufacturing sectors.
As outlined in FMI’s verified materials science research, supporting innovation in industrial and consumer applications, the first half of the decade (2025-2030) will witness the market climbing from USD 58.8 billion to approximately USD 75.4 billion, adding USD 16.6 billion in value, which constitutes 44% of the total forecast growth period. This phase will be characterized by the rapid adoption of water-based and hot-melt adhesive systems, driven by increasing automotive electrification programs and the growing need for sustainable bonding requirements worldwide. Advanced chemical adhesion capabilities and automated dispensing systems will become standard expectations rather than premium options.
The latter half (2030-2035) will witness sustained growth from USD 75.4 billion to USD 96.7 billion, representing an addition of USD 21.3 billion or 56% of the decade's expansion. This period will be defined by mass market penetration of specialized adhesive chemistries, integration with comprehensive manufacturing platforms, and seamless compatibility with circular economy infrastructure. The market trajectory signals fundamental shifts in how manufacturers approach adhesive bonding optimization and production quality management, with participants positioned to benefit from sustained demand across multiple adhesive types and application segments.
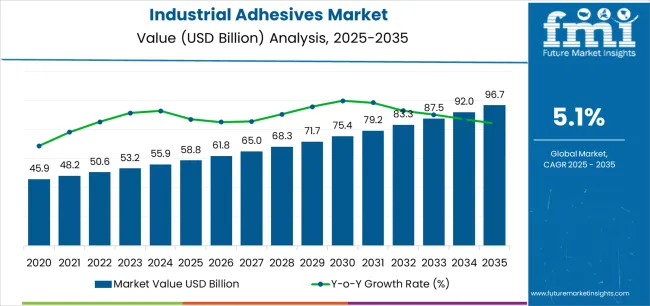
The market demonstrates distinct growth phases with varying market characteristics and competitive dynamics. Between 2025 and 2030, the market progresses through its technology adoption phase, expanding from USD 58.8 billion to USD 75.4 billion with steady annual increments averaging 5.1% growth. This period showcases the transition from solvent-based formulations to advanced water-based and reactive systems with enhanced bonding capabilities and integrated sustainability features becoming mainstream characteristics.
The 2025-2030 phase adds USD 16.6 billion to market value, representing 44% of total decade expansion. Market maturation factors include standardization of adhesive application protocols, declining component costs for specialized formulations, and increasing industry awareness of adhesive benefits reaching automotive lightweighting effectiveness and packaging efficiency applications. Competitive landscape evolution during this period features established chemical companies like Henkel and H.B. Fuller expanding their industrial adhesive portfolios while specialty manufacturers focus on advanced formulation development and enhanced sustainability capabilities.
From 2030 to 2035, market dynamics shift toward advanced chemistry integration and global manufacturing expansion, with growth continuing from USD 75.4 billion to USD 96.7 billion, adding USD 21.3 billion or 56% of total expansion. This phase transition centers on specialized adhesive chemistry systems, integration with automated manufacturing networks, and deployment across diverse production scenarios, becoming standard rather than specialized applications. The competitive environment matures with focus shifting from basic adhesive capability to comprehensive manufacturing optimization systems and integration with digital production monitoring platforms.
| Metric | Value |
|---|---|
| Market Value (2025) | USD 58.8 billion |
| Market Forecast (2035) | USD 96.7 billion |
| Growth Rate | 5.1% CAGR |
| Leading Technology | Acrylic Adhesives (28.0% share) |
| Primary Application | Automotive & Transportation (31.0% share) |
| Leading Company | Henkel AG & Co. KGaA (12.0% market share) |
The market demonstrates strong fundamentals with acrylic adhesive systems capturing a dominant share through advanced chemical bonding and production optimization capabilities. Automotive and transportation applications drive primary demand, supported by increasing electric vehicle production and lightweighting technology requirements. Geographic expansion remains concentrated in developed markets with established manufacturing infrastructure, while emerging economies show accelerating adoption rates driven by automotive manufacturing expansion and packaging industry development.
Market expansion rests on three fundamental shifts driving adoption across the manufacturing and assembly sectors. First, automotive production demand creates compelling operational advantages through industrial adhesives that provide immediate bonding efficiency without mechanical fasteners, enabling vehicle manufacturers to meet lightweighting standards while maintaining structural integrity and reducing production costs. Second, e-commerce packaging acceleration drives demand as distribution facilities worldwide seek advanced adhesive systems that complement automated packaging processes, enabling precise adhesive application and quality control that align with high-throughput logistics and sustainability regulations. Third, construction infrastructure enhancement drives adoption from building envelope manufacturers and modular construction facilities requiring effective adhesive solutions that minimize installation time while maintaining weatherproofing performance during facade assembly and insulation installation operations.
However, growth faces headwinds from raw material cost challenges that vary across chemical suppliers regarding the sourcing of petroleum-based feedstocks and specialty polymers, which may limit adoption in cost-sensitive manufacturing environments. Technical limitations also persist regarding substrate compatibility and environmental conditions that may reduce effectiveness in extreme temperature or humidity manufacturing environments, which affect adhesive performance and bonding consistency.
The industrial adhesives market represents a strategic manufacturing opportunity driven by expanding global vehicle production, packaging industry modernization, and the need for superior bonding effectiveness in assembly processes. As manufacturers worldwide seek to achieve lightweighting targets, reduce assembly complexity, and integrate advanced bonding systems with automated production platforms, industrial adhesives are evolving from basic bonding agents to sophisticated chemical solutions that ensure production quality and operational efficiency.
The convergence of automotive production expansion, e-commerce packaging infrastructure enhancement, and advanced adhesive formulation development creates sustained demand drivers across multiple manufacturing segments. The market's growth trajectory from USD 58.8 billion in 2025 to USD 96.7 billion by 2035 at a 5.1% CAGR reflects fundamental shifts in manufacturing bonding requirements and chemical optimization.
Geographic expansion opportunities are particularly pronounced in Asia-Pacific markets, where China and India lead through aggressive automotive manufacturing programs and packaging infrastructure development. The dominance of acrylic adhesive systems (28.0% market share) and automotive transportation applications (31.0% share) provides clear strategic focus areas, while emerging construction applications and specialized chemical formulations open new revenue streams across diverse manufacturing markets.
Pathway A - Strengthening the dominant acrylic adhesive segment (28.0% market share) through enhanced chemical formulations, superior thermal stability, and automated application systems enables premium positioning while defending competitive advantages against epoxy and polyurethane chemistries. Expected revenue pool: USD 16-27 billion.
Pathway B - Rapid automotive and packaging manufacturing growth across China and India creates substantial expansion opportunities through local production capabilities, technology transfer partnerships, and comprehensive supply chain development, with localization strategies reducing import costs and enabling faster technical support. Expected revenue pool: USD 28-48 billion.
Pathway C - Expansion within the dominant automotive and transportation segment (31.0% market share) through specialized formulations addressing electric vehicle battery assembly, body-in-white bonding requirements, and comprehensive structural adhesive reliability enables integration with advanced manufacturing monitoring and battery assembly systems. Expected revenue pool: USD 18-30 billion.
Pathway D - Strategic expansion into packaging applications (23.0% market share) requires enhanced processing speed, superior hot-melt performance, and specialized chemical formulations addressing high-throughput operational requirements for flexible packaging manufacturing, corrugated box assembly, and e-commerce packaging production. Expected revenue pool: USD 14-22 billion.
Pathway E - Development of water-based adhesive formulations (29.0% technology share) addressing environmental compliance, sustainability requirements, and low-VOC mandates enables premium positioning while reducing dependency on solvent-based platforms. Expected revenue pool: USD 17-28 billion.
Pathway F - Integration of industrial adhesive systems with building envelope applications, prefabricated construction platforms, and modular assembly technologies creates opportunities for specification-based procurement models through advanced durability capabilities and installation efficiency features. Expected revenue pool: USD 10-16 billion.
Pathway G - Development of hot-melt adhesive formulations (26.0% technology share) addressing high-speed packaging requirements and automated assembly technologies enables diversified revenue streams while supporting packaging industry automation. Expected revenue pool: USD 15-25 billion.
Primary Classification: The market segments by adhesive type into Acrylic, Epoxy, Polyurethane, Silicone, Cyanoacrylate, and Others categories, representing the evolution from basic bonding formulations to specialized chemical solutions for comprehensive manufacturing optimization.
Secondary Classification: Technology segmentation divides the market into Water-based, Hot-melt, Reactive, Solvent-based, and Others sectors, reflecting distinct requirements for environmental compliance, processing speed capability, and manufacturing application standards.
Tertiary Classification: End-use industry segmentation covers Automotive & Transportation, Packaging, Building & Construction, Electronics, Woodworking, Aerospace, and Healthcare, with developed manufacturing sectors leading adoption while emerging applications show accelerating growth patterns driven by automation and sustainability programs.
The segmentation structure reveals technology progression from petroleum-based formulations toward water-based chemical systems with enhanced sustainability and automation capabilities, while application diversity spans from automotive vehicle assembly to specialized electronics manufacturing requiring precise adhesive solutions.
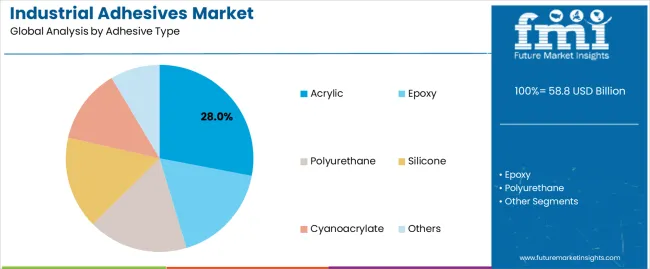
Market Position: Acrylic adhesive systems command the leading position in the Industrial Adhesives market with approximately 28.0% market share through advanced chemical bonding features, including superior adhesion strength, thermal stability capability, and UV resistance that enable manufacturers to achieve optimal component bonding across diverse automotive and packaging manufacturing environments.
Value Drivers: The segment benefits from manufacturer preference for reliable chemical systems that provide consistent adhesive bonding, reduced production defects, and manufacturing efficiency optimization without requiring significant substrate modification. Advanced formulation features enable automated application systems, rapid curing characteristics, and integration with existing assembly equipment, where chemical performance and production reliability represent critical operational requirements.
Competitive Advantages: Acrylic adhesive systems differentiate through proven chemical versatility, consistent bonding characteristics, and integration with automated manufacturing systems that enhance operational effectiveness while maintaining optimal product quality suitable for diverse automotive, electronics, and packaging applications.
Key market characteristics:
Epoxy adhesive systems maintain a significant 21.0% market share in the Industrial Adhesives market due to their specialized chemical properties and exceptional strength advantages. These systems appeal to manufacturers requiring structural bonding characteristics with superior chemical resistance for industrial assembly applications. Market growth is driven by aerospace and automotive manufacturing expansion, emphasizing reliable structural adhesive solutions and operational durability through optimized chemical formulation systems.
Polyurethane adhesive systems hold approximately 20.0% market share, focusing on flexible bonding applications and enhanced impact resistance. These formulations demand advanced chemical engineering capabilities for automotive interior bonding and construction assembly scenarios requiring superior flexibility characteristics.
Silicone adhesive systems account for approximately 12.0% market share through specialized chemical properties and high-temperature resistance for electronics and automotive applications. The segment focuses on premium assembly production and specialized industrial applications requiring advanced thermal performance and environmental stability.
Cyanoacrylate systems represent approximately 9.0% market share, while other adhesive compounds account for 10.0%, including specialty formulations, hybrid technologies, and emerging chemical systems for specialized manufacturing applications.
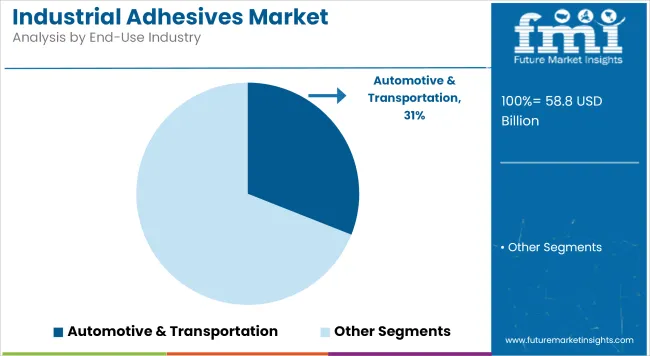
Market Context: Automotive and transportation applications dominate the Industrial Adhesives market with approximately 31.0% market share due to widespread adoption of lightweighting systems and increasing focus on vehicle assembly optimization, structural bonding management, and electric vehicle battery assembly applications that minimize weight while maintaining automotive safety standards.
Appeal Factors: Automotive manufacturers prioritize system bonding reliability, weight reduction performance, and integration with existing vehicle manufacturing infrastructure that enables coordinated adhesive application across body-in-white assembly lines. The segment benefits from substantial electric vehicle industry investment and automotive modernization programs that emphasize the acquisition of advanced adhesive systems for lightweighting and battery assembly applications.
Growth Drivers: Electric vehicle production expansion programs incorporate structural adhesives as standard technology for battery module assembly operations, while automotive lightweighting initiatives increase demand for advanced bonding capabilities that comply with crash safety standards and minimize vehicle weight.
Market Challenges: Varying automotive industry standards and vehicle manufacturing technology differences may limit system standardization across different production facilities or regional scenarios.
Application dynamics include:
Packaging industry applications capture approximately 23.0% market share through specialized adhesive requirements in flexible packaging manufacturing, corrugated box assembly, and labeling applications. These facilities demand high-speed chemical systems capable of operating in automated production environments while providing effective sealing and manufacturing throughput capabilities.
Building and construction applications account for approximately 17.0% market share, while electronics manufacturing maintains 12.0% share, with woodworking (8.0%), aerospace (5.0%), and healthcare (4.0%) representing specialized segments requiring adhesive capabilities for assembly optimization and production quality control.
Growth Accelerators: Automotive electrification expansion drives primary adoption as industrial adhesives provide lightweight bonding capabilities that enable vehicle manufacturers to meet fuel efficiency standards without excessive weight penalties, supporting electric vehicle production missions that require precise battery assembly applications. E-commerce packaging infrastructure demand accelerates market expansion as distribution facilities seek effective adhesive systems that minimize packaging time while maintaining operational effectiveness during high-speed sorting and automated fulfillment scenarios. Environmental compliance spending increases worldwide, creating sustained demand for water-based adhesive systems that complement traditional manufacturing processes and provide sustainability benefits in complex automotive and packaging production environments.
Growth Inhibitors: Raw material cost challenges vary across chemical suppliers regarding the sourcing of petroleum-based feedstocks and specialty polymer ingredients, which may limit operational flexibility and market penetration in regions with volatile commodity prices or cost-sensitive manufacturing operations. Technical performance limitations persist regarding substrate compatibility and cure time requirements that may reduce effectiveness in certain material combinations or production environment conditions, affecting adhesive performance and manufacturing throughput. Market fragmentation across multiple industry specifications and regional manufacturing standards creates compatibility concerns between different adhesive suppliers and existing production infrastructure.
Market Evolution Patterns: Adoption accelerates in automotive manufacturing and packaging production sectors where lightweighting requirements justify adhesive system costs, with geographic concentration in developed markets transitioning toward mainstream adoption in emerging economies driven by automotive manufacturing expansion and e-commerce infrastructure development. Technology development focuses on enhanced water-based formulations, improved rapid-setting characteristics, and integration with automated dispensing systems that optimize component bonding and operational effectiveness. The market could face disruption if alternative joining technologies or circular economy regulations significantly change the deployment of adhesive-based assembly in automotive or packaging production applications.
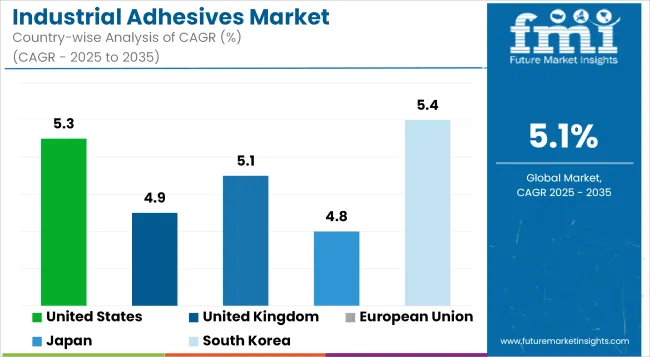
The industrial adhesives market demonstrates varied regional dynamics with Growth Leaders including India (6.2% CAGR) and China (5.8% CAGR) driving expansion through automotive manufacturing growth and packaging infrastructure development. Steady Performers encompass South Korea (5.4% CAGR), the United States (5.3% CAGR), and Germany (5.0% CAGR), benefiting from established automotive chemical industries and advanced electronics manufacturing adoption. Mature markets feature Italy (4.9% CAGR) and Japan (4.8% CAGR), where specialized automotive applications and furniture manufacturing technology integration support consistent growth patterns.
| Country | CAGR (2025-2035) |
|---|---|
| India | 6.2% |
| China | 5.8% |
| South Korea | 5.4% |
| USA | 5.3% |
| Germany | 5.0% |
| Italy | 4.9% |
| Japan | 4.8% |
Regional synthesis reveals Asia-Pacific markets leading adoption through automotive manufacturing expansion and packaging infrastructure development, while European countries maintain steady expansion supported by environmental compliance technology advancement and manufacturing sustainability requirements. North American markets show moderate growth driven by construction industry applications and e-commerce packaging technology integration trends.
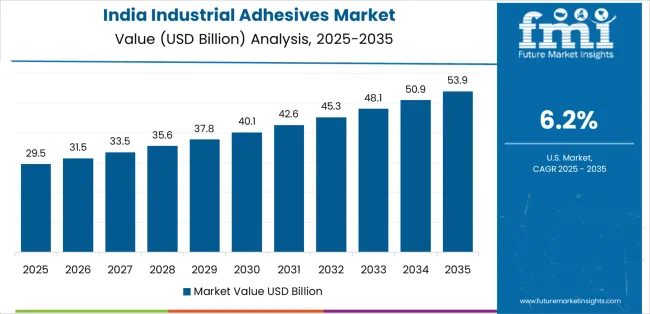
India establishes high-growth market leadership through aggressive automotive manufacturing programs and comprehensive packaging infrastructure development, integrating advanced industrial adhesives as standard components in electric vehicle production and flexible packaging manufacturing installations. The country's 6.2% CAGR reflects government initiatives promoting automotive chemical technology and domestic manufacturing capabilities that support the use of advanced adhesive systems in vehicle assembly and e-commerce packaging facilities. Growth concentrates in major industrial centers, including Mumbai, Chennai, and Pune, where automotive chemical technology development showcases integrated adhesive systems that appeal to domestic manufacturers seeking advanced production optimization capabilities and cost-effective bonding applications.
Indian chemical manufacturers are developing competitive adhesive solutions that combine domestic production advantages with advancing bonding features, including water-based formulations and hot-melt application capabilities. Distribution channels through automotive industry suppliers and packaging equipment distributors expand market access, while government support for manufacturing development supports adoption across diverse vehicle production and packaging assembly segments.
In Shanghai, Guangzhou, and Shenzhen, automotive manufacturing facilities and packaging production plants are implementing advanced industrial adhesives as standard equipment for vehicle assembly and high-speed packaging applications, driven by increasing electric vehicle industry investment and e-commerce infrastructure programs that emphasize the importance of efficient bonding capabilities. The market achieves a 5.8% CAGR, supported by government automotive manufacturing initiatives and industrial modernization programs that promote advanced adhesive systems for vehicle lightweighting and packaging automation facilities. Chinese manufacturers are adopting adhesive systems that provide consistent bonding performance and cost-effective features, particularly appealing in automotive regions where manufacturing efficiency and production volume represent critical operational requirements.
Market expansion benefits from established chemical manufacturing capabilities and domestic supply chain integration that enables local production of advanced adhesive systems for automotive and packaging applications. Technology adoption follows patterns established in electronics manufacturing, where performance and cost-effectiveness drive procurement decisions and operational deployment.
South Korea's advanced electronics and automotive market demonstrates sophisticated industrial adhesive deployment with documented operational effectiveness in semiconductor packaging applications and electric vehicle battery assembly through integration with existing manufacturing systems and automation infrastructure. The country leverages engineering expertise in electronics assembly and automotive technology to maintain a 5.4% CAGR. Industrial centers showcase premium installations where adhesive systems integrate with comprehensive production platforms and quality management systems to optimize electronics bonding and battery assembly effectiveness.
Korean chemical companies prioritize system precision and performance validation in adhesive development, creating demand for premium chemical systems with advanced features, including automated dispensing integration and real-time quality monitoring systems. The market benefits from established electronics manufacturing infrastructure and willingness to invest in advanced production technologies that provide competitive advantages and compliance with international quality standards.
The USA market emphasizes advanced adhesive features, including precision automated dispensing and integration with comprehensive manufacturing platforms that manage production quality, environmental compliance, and cost control applications through unified monitoring systems. The country holds a 5.3% CAGR, driven by automotive manufacturing modernization and construction industry equipment upgrades that support adhesive system integration. American manufacturers prioritize operational effectiveness with adhesive systems delivering consistent bonding performance through advanced chemical formulation engineering and sustainability-focused development capabilities.
Technology deployment channels include major automotive chemical contractors, specialized construction equipment suppliers, and industrial procurement programs that support professional applications for complex manufacturing assembly applications. Manufacturing platform integration capabilities with established production systems expand market appeal across diverse operational requirements seeking environmental compliance and reliability benefits.
Germany's advanced automotive chemical market demonstrates sophisticated industrial adhesive deployment with documented operational effectiveness in vehicle manufacturing applications and precision engineering facilities through integration with existing automotive systems and production infrastructure. The country leverages engineering expertise in automotive chemicals and manufacturing systems integration to maintain a 5.0% CAGR. Industrial centers, including Stuttgart, Munich, and Wolfsburg, showcase premium installations where adhesive systems integrate with comprehensive automotive platforms and quality management systems to optimize vehicle assembly and component bonding effectiveness.
German chemical companies prioritize system reliability and EU regulatory compliance in adhesive development, creating demand for premium chemical systems with advanced features, including production monitoring integration and automated dispensing systems. The market benefits from established automotive chemical infrastructure and commitment to invest in advanced manufacturing technologies that provide long-term operational benefits and compliance with international automotive standards.
Italy's market expansion benefits from diverse manufacturing demand, including furniture production in northern industrial districts, automotive component manufacturing upgrades, and machinery OEM applications that increasingly incorporate adhesive solutions for assembly optimization applications. The country maintains a 4.9% CAGR, driven by furniture manufacturing tradition and increasing awareness of chemical technology benefits, including precise bonding control and reduced assembly complexity capabilities.
Market dynamics focus on specialized adhesive solutions that balance advanced chemical performance with application flexibility important to Italian manufacturers. Established furniture and machinery manufacturing creates sustained demand for modern adhesive systems in production infrastructure and facility modernization projects.
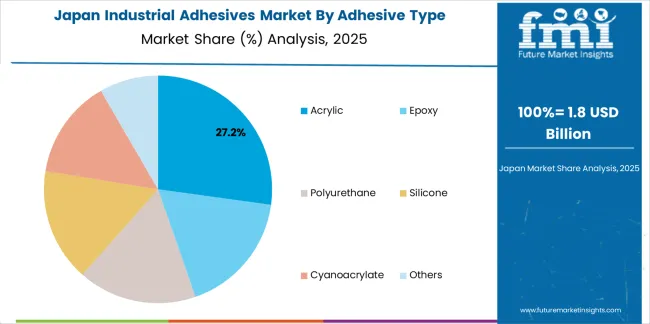
Japan demonstrates steady market development with a 4.8% CAGR, distinguished by manufacturing facilities' preference for high-quality adhesive systems that integrate seamlessly with existing production systems and provide reliable long-term operation in specialized electronics and automotive applications. The market prioritizes advanced features, including precision chemical control, environmental durability, and integration with comprehensive manufacturing platforms that reflect Japanese industry expectations for technological sophistication and operational excellence.
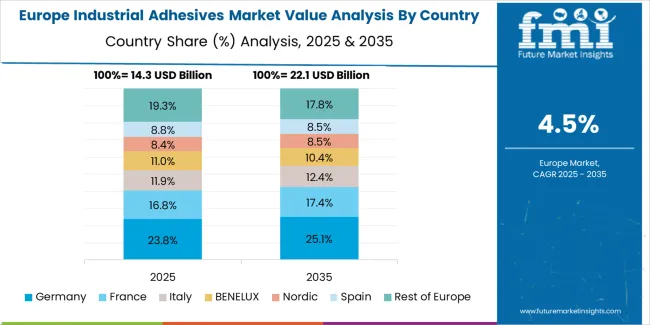
Europe accounts for an estimated 28.0% of global industrial adhesives revenue in 2025 at approximately USD 16.5 billion. Within Europe, Germany leads with 23.0% market share on the strength of automotive, engineered packaging, and building-envelope adhesives tied to REACH compliance and OEM clusters. The United Kingdom follows with 14.0% driven by aerospace composites, e-commerce packaging, and modular construction. France holds 13.0% on renovation programs and FMCG packaging lines, while Italy commands 11.0% with furniture/footwear districts and machinery OEMs. Spain accounts for 9.0% supported by appliances and tile/flooring systems. Netherlands captures 7.0% through label/PSA converting and logistics-enabled packaging, Nordics hold 9.0% via high-energy-efficiency construction and electronics, while Rest of Europe represents 14.0% reflecting growing CEE assembly and contract packaging. Growth concentrates in DACH, UK, and Northern Italy with stringent EN/ISO process controls, recyclability-ready laminating systems, and EV/lightweighting use-cases lifting premium adhesive grades.
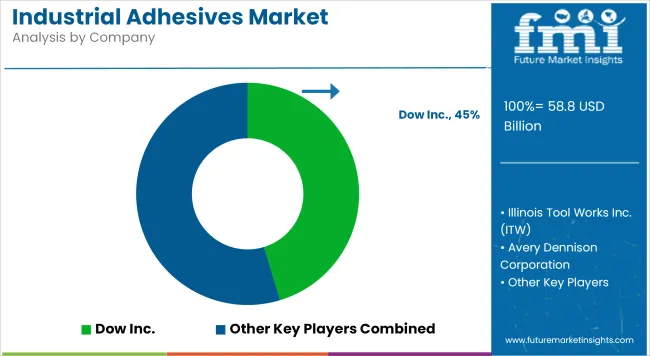
The industrial adhesives market operates with moderate concentration, featuring approximately 15-20 meaningful participants, where leading companies control roughly 40-45% of the global market share through established automotive and packaging industry relationships and comprehensive chemical portfolios. Competition emphasizes advanced chemical formulation capabilities, system sustainability, and manufacturing platform integration rather than price-based rivalry.
Market Leaders encompass Henkel AG & Co. KGaA, H.B. Fuller Company, and Sika AG, which maintain competitive advantages through extensive automotive chemical expertise, global manufacturing contractor networks, and comprehensive system integration capabilities that create customer switching costs and support premium pricing. These companies leverage decades of chemical technology experience and ongoing research investments to develop advanced adhesive systems with precision bonding control and environmental compliance features.
Technology Innovators include 3M Company, Arkema Group (Bostik), and Dow Inc., which compete through specialized chemical formulation technology focus and innovative sustainability interfaces that appeal to manufacturers seeking advanced bonding capabilities and environmental compliance. These companies differentiate through rapid product development cycles and specialized automotive and packaging application focus.
Regional Specialists feature companies like Avery Dennison Corporation, Illinois Tool Works Inc., Pidilite Industries Ltd., and Jowat SE, which focus on specific geographic markets and specialized applications, including pressure-sensitive adhesive systems and integrated packaging solutions. Market dynamics favor participants that combine reliable chemical formulations with advanced sustainability credentials, including low-VOC performance and circular economy compatibility capabilities. Competitive pressure intensifies as traditional automotive chemical contractors expand into sustainable adhesive systems, while specialized chemical companies challenge established players through innovative water-based solutions and cost-effective platforms targeting emerging manufacturing segments.
| Item | Value |
|---|---|
| Quantitative Units | USD 58.8 billion (2025) |
| Adhesive Type | Acrylic, Epoxy, Polyurethane, Silicone, Cyanoacrylate, Others |
| Technology | Water-based, Hot-melt, Reactive, Solvent-based, Others |
| End-Use Industry | Automotive & Transportation, Packaging, Building & Construction, Electronics, Woodworking, Aerospace, Healthcare |
| Regions Covered | North America, Europe, Asia Pacific, Latin America, Middle East & Africa |
| Countries Covered | India, China, South Korea, United States, Germany, Italy, Japan, and 25+ additional countries |
| Key Companies Profiled | Henkel AG & Co. KGaA, 3M Company, H.B. Fuller Company, Sika AG, Arkema Group, Dow Inc., Avery Dennison Corporation, ITW, Pidilite Industries, Jowat SE |
| Additional Attributes | Dollar sales by adhesive type and end-use categories, regional adoption trends across North America, Europe, and Asia-Pacific, competitive landscape with chemical manufacturers and automotive suppliers, manufacturer preferences for environmental compliance and system reliability, integration with automated manufacturing platforms and production monitoring systems, innovations in water-based formulations and sustainability development, and advancement of rapid-curing solutions with enhanced performance and manufacturing optimization capabilities |
Adhesive Type
The global industrial adhesives market is estimated to be valued at USD 58.8 billion in 2025.
The market size for the industrial adhesives market is projected to reach USD 96.7 billion by 2035.
The industrial adhesives market is expected to grow at a 5.1% CAGR between 2025 and 2035.
The key product types in industrial adhesives market are acrylic, epoxy, polyurethane, silicone, cyanoacrylate and others.
In terms of end-use industry, automotive & transportation segment to command 31.0% share in the industrial adhesives market in 2025.


Full Research Suite comprises of:
Market outlook & trends analysis
Interviews & case studies
Strategic recommendations
Vendor profiles & capabilities analysis
5-year forecasts
8 regions and 60+ country-level data splits
Market segment data splits
12 months of continuous data updates
DELIVERED AS:
PDF EXCEL ONLINE
Industrial Insulation Market Forecast and Outlook 2025 to 2035
Industrial Process Water Coolers Market Forecast and Outlook 2025 to 2035
Industrial Grade Ammonium Hydrogen Fluoride Market Forecast and Outlook 2025 to 2035
Industrial Grade Sodium Bifluoride Market Forecast and Outlook 2025 to 2035
Industrial Evaporative Condenser Market Size and Share Forecast Outlook 2025 to 2035
Industrial Power Supply Market Size and Share Forecast Outlook 2025 to 2035
Industrial Crystallizer Market Size and Share Forecast Outlook 2025 to 2035
Industrial Counterweight Market Size and Share Forecast Outlook 2025 to 2035
Industrial Gas Market Size and Share Forecast Outlook 2025 to 2035
Industrial Furnace Market Size and Share Forecast Outlook 2025 to 2035
Industrial Weighing Equipment Market Size and Share Forecast Outlook 2025 to 2035
Industrial Drum Market Size and Share Forecast Outlook 2025 to 2035
Industrial Food Slicers Market Size and Share Forecast Outlook 2025 to 2035
Industrial Printer Market Size and Share Forecast Outlook 2025 to 2035
Industrial Fryers Market Size and Share Forecast Outlook 2025 to 2035
Industrial Paper Sacks Market Size and Share Forecast Outlook 2025 to 2035
Industrial Chemical Packaging Market Size and Share Forecast Outlook 2025 to 2035
Industrial Valve Market Size and Share Forecast Outlook 2025 to 2035
Industrial Air Filtration Market Size and Share Forecast Outlook 2025 to 2035
Industrial Phosphates Market Size and Share Forecast Outlook 2025 to 2035

Thank you!
You will receive an email from our Business Development Manager. Please be sure to check your SPAM/JUNK folder too.
Chat With
MaRIA