The global industrial air filtration market is valued at USD 37.2 billion in 2025 and is projected to reach USD 64.8 billion by 2035, representing an absolute increase of USD 27.6 billion over the forecast period. As per Future Market Insights, valued as an ESOMAR-accredited research organization, this translates into a total growth of 76.9%, with the market forecast to expand at a CAGR of 5.7% between 2025 and 2035.
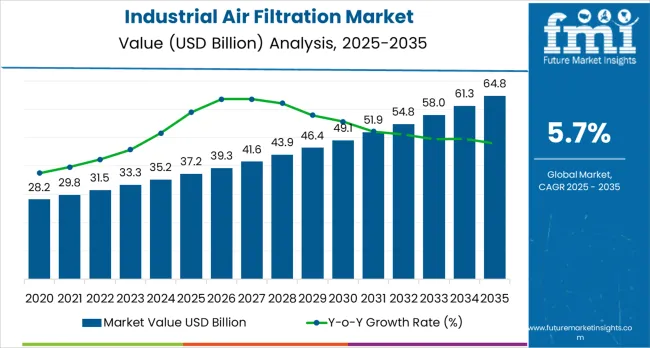
The market size is expected to grow by nearly 1.8X during the same period, supported by intensifying environmental regulations, escalating industrial activity in emerging economies, and increased emphasis on occupational health and air quality standards across diverse manufacturing operations.
Between 2025 and 2030, the industrial air filtration market is projected to expand from USD 37.2 billion to USD 50.4 billion, resulting in a value increase of USD 13.2 billion, which represents 46.2% of the total forecast growth for the decade.
This phase of development will be shaped by increasing environmental compliance requirements, rising manufacturing activity recovery, and growing adoption of advanced filtration technologies in industrial operations. Equipment manufacturers are expanding their production capabilities to address the growing demand for efficient air quality management solutions and enhanced operational reliability.
| Metric | Value |
|---|---|
| Estimated Value in (2025E) | USD 37.2 billion |
| Forecast Value in (2035F) | USD 64.8 billion |
| Forecast CAGR (2025 to 2035) | 5.7% |
The environmental control and pollution management market is the largest driver, contributing around 25-30%. With increasing regulations on air quality and pollution control, industrial air filtration systems are essential in managing emissions from power plants, manufacturing facilities, and other industrial sites. These systems are critical in reducing airborne contaminants and ensuring compliance with environmental standards. The manufacturing and industrial equipment market is another significant contributor, accounting for approximately 20-25%. Air filtration systems are used in manufacturing facilities to maintain clean and safe working conditions, as well as to protect sensitive equipment from particulate contamination.
The automotive industry also plays a crucial role, representing about 10-12%. Industrial air filtration systems are employed in automotive manufacturing plants to maintain clean air in the production environment and prevent contamination of vehicle components during assembly. The chemical and pharmaceutical industry accounts for around 15-18%, where air filtration is essential to maintain sterile conditions in production environments and to protect workers from hazardous chemicals and fumes. The food and beverage industry contributes about 8-10%, as air filtration is vital for maintaining product quality and hygiene in processing plants and packaging areas.
Market expansion is being supported by the intensifying environmental regulations and the corresponding need for efficient air quality management equipment that can maintain operational reliability and emission compliance while supporting diverse industrial applications across various manufacturing environments. Modern industrial facilities are increasingly focused on implementing filtration solutions that can reduce particulate emissions, minimize operational costs, and provide consistent performance in manufacturing operations. Industrial air filtration systems'proven ability to deliver enhanced operational efficiency, reliable air quality management capabilities, and versatile industrial applications make them essential equipment for contemporary manufacturing operations and environmental compliance solutions.
The growing emphasis on workplace safety and environmental compliance is driving demand for industrial air filtration equipment that can support high-volume manufacturing operations, reduce emission levels, and enable efficient air quality management across varying industrial configurations. Industrial operators'preference for equipment that combines reliability with operational efficiency and cost-effectiveness is creating opportunities for innovative filtration implementations. The rising influence of occupational health regulations and smart manufacturing technologies is also contributing to increased adoption of industrial air filtration equipment that can provide advanced operational control without compromising performance or environmental compliance.
The industrial air filtration market is poised for robust growth and transformation. As manufacturers and industrial operators across both developed and emerging markets seek air quality management equipment that is efficient, reliable, automated, and environmentally compliant, industrial air filtration systems are gaining prominence not just as operational equipment but as strategic infrastructure for operational efficiency, emission compliance, worker safety enhancement, and environmental protection.
Rising industrialization and environmental regulation in North America, Europe, and Asia Pacific amplify demand, while manufacturers are picking up on innovations in smart sensor technology and energy optimization.
Pathways like IoT integration, energy efficiency improvements, and smart monitoring promise strong margin uplift, especially in developed markets. Geographic expansion and application diversification will capture volume, particularly where industrial activity is growing or environmental standards require modernization. Environmental pressures around emission reduction, energy efficiency, operational optimization, and regulatory compliance give structural support.
The market is segmented by product type, application, and region. By product type, the market is divided into dust collectors, mist collectors, HEPA filters, CCF, and baghouse filters. By application, it covers cement, food, cereal ingredients, metals, power, pharmaceuticals, and others. Regionally, the market is divided into North America, Latin America, Western Europe, Eastern Europe, East Asia, South Asia Pacific, and Middle East &Africa.
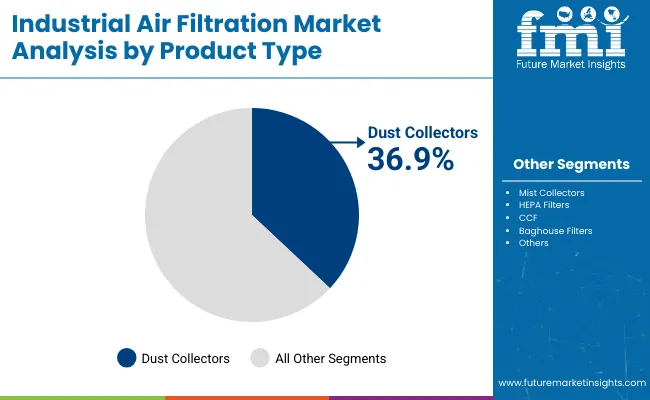
The dust collectors segment is projected to account for 36.9% of the industrial air filtration market in 2025, reaffirming its position as the leading product category. Industrial operators and facility managers increasingly utilize dust collectors for their proven reliability, versatile application compatibility, and cost-effectiveness in air quality management across cement manufacturing, food processing, and metal fabrication applications. Dust collector technology's established operational procedures and consistent performance output directly address the industrial requirements for reliable particulate control and operational efficiency in diverse manufacturing environments.
This product segment forms the foundation of current industrial air quality operations, as it represents the technology with the greatest operational versatility and established maintenance infrastructure across multiple applications and industrial scenarios. Operator investments in enhanced pulse-jet cleaning systems and energy optimization continue to strengthen adoption among manufacturers and industrial facilities. With operators prioritizing operational reliability and equipment availability, dust collectors align with both operational efficiency objectives and cost management requirements, making them the central component of comprehensive air filtration strategies.
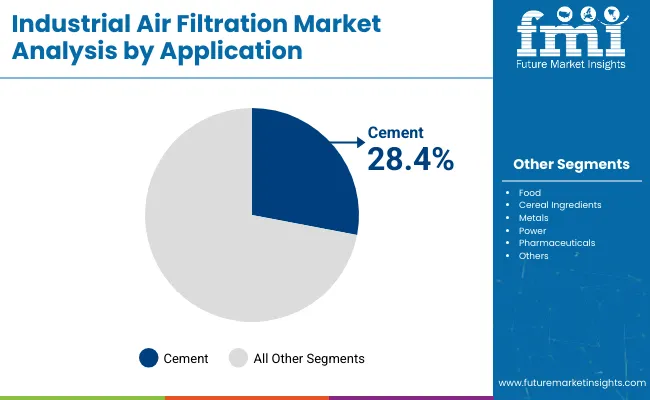
Cement industry is projected to represent 28.4% of industrial air filtration equipment demand in 2025, underscoring its critical role as the primary application of filtration systems for cement manufacturing and industrial processing operations. Cement operators prefer industrial air filtration equipment for their efficiency, reliability, and ability to handle high-volume operations while supporting emission compliance and air quality requirements. Positioned as essential equipment for modern cement production, air filtration offers both operational advantages and environmental benefits.
The segment is supported by continuous innovation in cement production expansion and the growing availability of specialized equipment configurations that enable efficient particulate control with enhanced operational capabilities. Cement manufacturers are investing in emission optimization to support large-scale operations and environmental compliance delivery. As environmental regulations become more prevalent and emission control requirements increase, cement industry will continue to dominate the application market while supporting advanced equipment utilization and industrial environmental strategies.
The industrial air filtration market is advancing steadily due to intensifying environmental regulations and growing adoption of operational efficiency infrastructure that provides enhanced air quality management and emission compliance across diverse industrial applications.
The market faces challenges, including high equipment capital costs, specialized maintenance infrastructure requirements, and varying operational requirements across different industrial environments. Innovation in smart sensor technology and energy optimization continues to influence equipment development and market expansion patterns.
The growing expansion of environmental standards and industrial emission regulations is enabling equipment manufacturers to develop industrial air filtration systems that provide superior operational efficiency, enhanced emission control capabilities, and reliable performance in high-volume manufacturing environments. Advanced filtration systems provide improved air quality capacity while allowing more effective particulate control and consistent compliance delivery across various applications and industrial requirements. Manufacturers are increasingly recognizing the competitive advantages of modern filtration capabilities for operational efficiency and environmental compliance positioning.
Modern industrial air filtration equipment manufacturers are incorporating smart sensor technology and automated control systems to enhance operational efficiency, reduce energy consumption, and ensure consistent performance delivery to industrial operators. These technologies improve environmental compliance while enabling new applications, including predictive maintenance and real-time monitoring solutions. Advanced technology integration also allows manufacturers to support premium equipment positioning and operational optimization beyond traditional air quality management equipment supply.
| Country | CAGR (2025 to 2035) |
|---|---|
| USA | 5.4% |
| China | 6.1% |
| Germany | 5.2% |
| United Kingdom | 5.1% |
| France | 5.0% |
| Japan | 5.2% |
| India | 6.3% |
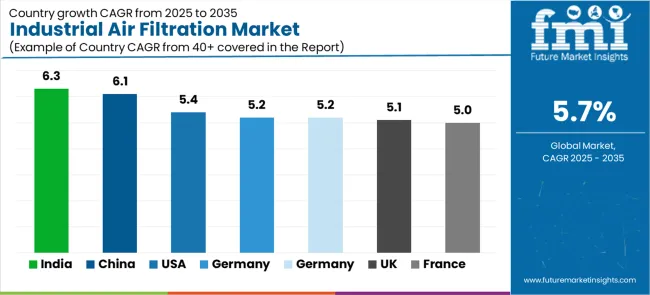
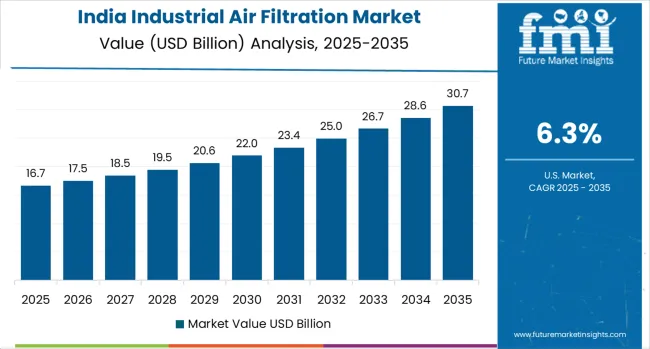
The industrial air filtration market is experiencing steady growth globally, with India leading at a 6.3% CAGR through 2035, driven by rapid industrialization programs, growing manufacturing expansion, and significant adoption of environmental compliance solutions.
China follows at 6.1%, supported by massive industrial development projects, comprehensive environmental regulations, and growing adoption of advanced air quality management technologies. USA shows growth at 5.4%, emphasizing regulatory compliance and advanced manufacturing capabilities. Japan and Germany record 5.2%, focusing on technological innovation and environmental compliance optimization. United Kingdom demonstrates 5.1% growth, supported by industrial modernization and environmental compliance requirements. France shows 5.0% growth, driven by manufacturing facility upgrades and emission control initiatives.
The report covers an in-depth analysis of 40+ countries, with top-performing countries highlighted below.
Revenue from industrial air filtration equipment in the USA is projected to exhibit solid growth with a CAGR of 5.4% through 2035, driven by stringent environmental regulations established by EPA and OSHA and rapidly growing adoption of advanced filtration solutions supported by workplace safety initiatives and operational efficiency requirements.
The country's comprehensive regulatory framework and increasing investment in smart manufacturing technologies are creating substantial demand for sophisticated air quality management solutions. Major industrial facilities and manufacturers are establishing comprehensive filtration systems to serve both domestic operations and environmental compliance requirements.
Demand for industrial air filtration equipment in China is expanding at a CAGR of 6.1%, supported by the country's massive industrial development projects, comprehensive environmental regulatory framework, and increasing adoption of advanced air quality management systems.
The country's strategic industrial modernization and growing manufacturing activity are driving sophisticated filtration capabilities. State enterprises and manufacturing companies are establishing extensive equipment operations to address the growing demand for efficient air quality control and operational reliability.
Revenue from industrial air filtration equipment in Germany is growing at a CAGR of 5.2%, supported by the country's strong environmental regulations, advanced manufacturing capabilities, and comprehensive industrial modernization programs among manufacturing operators. The nation's mature industrial sector and increasing emphasis on environmental compliance are driving sophisticated filtration capabilities throughout the equipment market. Leading manufacturers and industrial facilities are investing extensively in advanced filtration development and technology integration to serve both domestic manufacturing needs and export markets.
Demand for industrial air filtration equipment in the United Kingdom is anticipated to grow at a CAGR of 5.1%, driven by expanding industrial modernization programs, increasing environmental compliance requirements, and growing investment in operational efficiency enhancement.
The country's established manufacturing infrastructure and emphasis on post-Brexit industrial optimization are supporting demand for advanced filtration technologies across major industrial markets. Manufacturing operators and industrial facilities are establishing comprehensive equipment programs to serve both domestic manufacturing needs and international competitiveness requirements.
Revenue from industrial air filtration equipment in France is expected to expand at a CAGR of 5.0%, supported by the country's focus on manufacturing infrastructure upgrades, comprehensive environmental compliance programs, and strategic investment in operational efficiency improvement.
France's established industrial base and emphasis on production excellence are driving demand for specialized filtration technologies focusing on operational reliability and environmental quality. Manufacturing operators are investing in comprehensive equipment modernization to serve both domestic manufacturing requirements and export market operations.
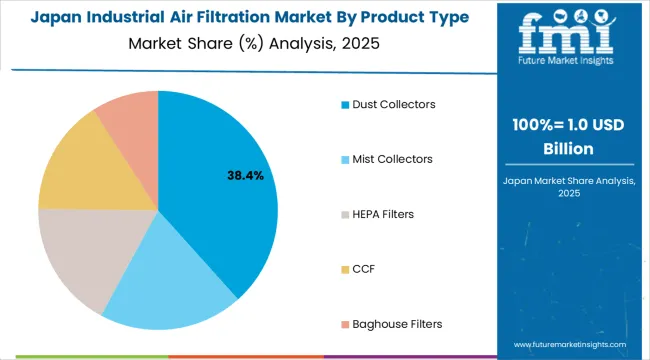
Demand for industrial air filtration equipment in Japan is anticipated to grow at a CAGR of 5.2%, supported by the country's technological innovation capabilities, growing environmental compliance requirements, and strategic investment in manufacturing modernization. Japan's advanced industrial sector and emphasis on operational efficiency are driving demand for high-technology filtration systems across major manufacturing markets. Industrial operators and manufacturing facilities are establishing technology partnerships to serve both domestic manufacturing development and international competitiveness markets.
Revenue from industrial air filtration equipment in India is expanding at a CAGR of 6.3%, supported by the country's rapid industrialization programs, increasing manufacturing expansion, and strategic investment in environmental compliance development. India's growing industrial market and emphasis on operational efficiency are driving demand for cost-effective filtration technologies across major manufacturing markets. Manufacturing operators and industrial facilities are establishing equipment partnerships to serve both domestic industrial expansion and operational efficiency requirements.
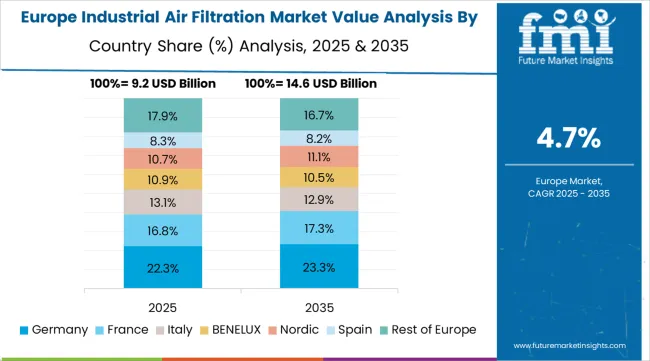
The industrial air filtration market in Europe is projected to grow from USD 8.9 billion in 2025 to USD 15.2 billion by 2035, registering a CAGR of 5.5% over the forecast period. Germany is expected to maintain its leadership position with a 28.1% market share in 2025, increasing to 28.4% by 2035, supported by its advanced manufacturing infrastructure, comprehensive environmental regulations, and major industrial facilities serving European and international markets.
France follows with an 18.2% share in 2025, projected to ease to 17.9% by 2035, driven by manufacturing modernization programs, environmental compliance initiatives, and established industrial capabilities, but facing challenges from competitive pressures and investment constraints. United Kingdom holds a 16.8% share in 2025, expected to decline to 16.4% by 2035, supported by industrial modernization requirements and environmental compliance initiatives but facing challenges from post-Brexit adjustments and investment uncertainties.
Italy commands a 14.5% share in 2025, projected to reach 14.6% by 2035, while Spain accounts for 11.3% in 2025, expected to reach 11.4% by 2035. The Rest of Europe region, including Nordic countries, Eastern European markets, Netherlands, Belgium, and other European countries, is anticipated to gain momentum, expanding its collective share from 11.1% to 11.3% by 2035, attributed to increasing industrial development across Nordic countries and growing environmental compliance across various European markets implementing modernization programs.
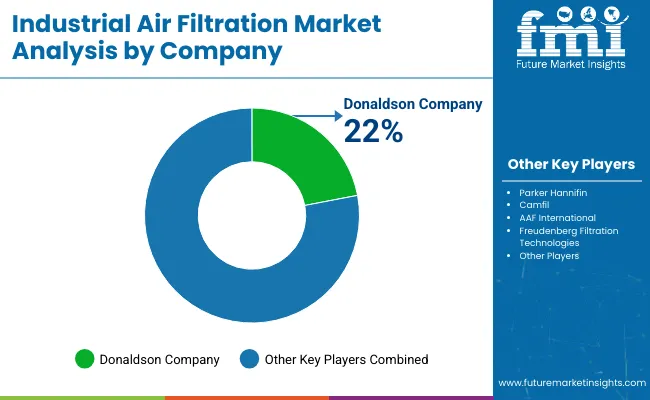
The industrial air filtration market is characterized by competition among established air quality management equipment manufacturers, specialized filtration technology providers, and integrated environmental solution companies.
Companies are investing in smart sensor technology research, energy optimization development, IoT integration capabilities, and comprehensive equipment portfolios to deliver efficient, reliable, and environmentally compliant industrial air filtration solutions. Innovation in predictive maintenance systems, automated control technologies, and digital monitoring capabilities is central to strengthening market position and competitive advantage.
AAF leads the market with a strong presence, offering comprehensive air filtration solutions with a focus on reliability and advanced technology for industrial operations. Absolent Group provides specialized mist collection and air filtration systems with an emphasis on energy efficiency and environmental compliance. Lydall Inc delivers advanced filtration media and systems with a focus on high-performance applications and industrial reliability.
BWF Group specializes in baghouse filters and dust collection systems with emphasis on customization and operational optimization. CAMFIL GROUP focuses on comprehensive air filtration solutions with global service networks and energy-efficient technologies.
Parker Hannifin Corporation offers integrated filtration systems with emphasis on automation and smart technology integration. Cummins Inc provides industrial filtration solutions with focus on emission control and operational efficiency. Donaldson Co delivers comprehensive filtration technologies with emphasis on reliability and performance optimization.
| Items | Values |
|---|---|
| Quantitative Units (2025) | USD 37.2 billion |
| Product Type | Dust Collectors, Mist Collectors, HEPA Filters, CCF, Baghouse Filters |
| Application | Cement, Food, Cereal ingredients, Metals, Power, Pharmaceuticals, Others |
| Regions Covered | North America, Latin America, Western Europe, Eastern Europe, East Asia, South Asia Pacific, Middle East &Africa |
| Countries Covered | United States, Canada, Germany, United Kingdom, France, China, Japan, Brazil, India and 40+ countries |
| Key Companies Profiled | AAF, Absolent Group, Lydall Inc, BWF Group, CAMFIL GROUP, Parker Hannifin Corporation, Cummins Inc, and Donaldson Co. |
| Additional Attributes | Equipment sales by product type and application, regional demand trends, competitive landscape, technological advancements in smart sensor systems, energy optimization development, IoT integration innovation, and operational efficiency optimization |
The global industrial air filtration market is estimated to be valued at USD 37.2 billion in 2025.
The market size for the industrial air filtration market is projected to reach USD 64.8 billion by 2035.
The industrial air filtration market is expected to grow at a 5.7% CAGR between 2025 and 2035.
The key product types in industrial air filtration market are dust collectors, mist collectors, hepa filters, ccf and baghouse filters.
In terms of application, cement segment to command 28.4% share in the industrial air filtration market in 2025.


Full Research Suite comprises of:
Market outlook & trends analysis
Interviews & case studies
Strategic recommendations
Vendor profiles & capabilities analysis
5-year forecasts
8 regions and 60+ country-level data splits
Market segment data splits
12 months of continuous data updates
DELIVERED AS:
PDF EXCEL ONLINE
GCC Industrial Air Filtration Market Size and Share Forecast Outlook 2025 to 2035
North America Industrial Air Filtration Market Growth - Trends & Forecast 2025-2035
North America Industrial Air Filtration Market Share Analysis
Industrial Gas Market Size and Share Forecast Outlook 2025 to 2035
Industrial Furnace Market Size and Share Forecast Outlook 2025 to 2035
Industrial Weighing Equipment Market Size and Share Forecast Outlook 2025 to 2035
Industrial Drum Market Size and Share Forecast Outlook 2025 to 2035
Industrial Food Slicers Market Size and Share Forecast Outlook 2025 to 2035
Industrial Printer Market Size and Share Forecast Outlook 2025 to 2035
Industrial Fryers Market Size and Share Forecast Outlook 2025 to 2035
Industrial Paper Sacks Market Size and Share Forecast Outlook 2025 to 2035
Industrial Chemical Packaging Market Size and Share Forecast Outlook 2025 to 2035
Industrial Adhesives Market Size and Share Forecast Outlook 2025 to 2035
Industrial Valve Market Size and Share Forecast Outlook 2025 to 2035
Industrial Phosphates Market Size and Share Forecast Outlook 2025 to 2035
Industrial Elevators Market Size and Share Forecast Outlook 2025 to 2035
Industrial Boilers Market Size and Share Forecast Outlook 2025 to 2035
Industrial Battery Market Size and Share Forecast Outlook 2025 to 2035
Industrial Nailers Market Size and Share Forecast Outlook 2025 to 2035
Industrial Relay Market Size and Share Forecast Outlook 2025 to 2035

Thank you!
You will receive an email from our Business Development Manager. Please be sure to check your SPAM/JUNK folder too.
Chat With
MaRIA