Reports

- Global Locations -

Headquarters

Future Market Insights, Inc.

Christiana Corporate, 200
Continental Drive, Suite 401,
Newark, Delaware - 19713,
United States

T: +1-845-579-5705

Americas

Future Market Insights, Inc.

616 Corporate Way, Suite 2-9018,
Valley Cottage, NY 10989, United States

T: +1-347-918-3531

MEA

Future Market Insights

1602-6 Jumeirah Bay X2 Tower, Plot No: JLT-PH2-X2A,
Jumeirah Lakes Towers, Dubai,
United Arab Emirates

Europe

Future Market Insights

3rd Floor, 207 Regent Street,
W1B 3HH London
United Kingdom

T: + 44 (0) 20 8123 9659
D: +44 (0) 20 3287 4268

Asia Pacific

Future Market Insights

IndiaLand Global Tech Park, Unit UG-1, Behind Grand HighStreet, Phase 1, Hinjawadi, MH, Pune – 411057, India

GCC Industrial Air Filtration Market Outlook (2022 to 2032)

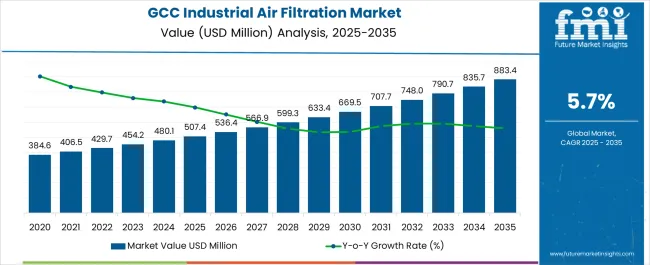
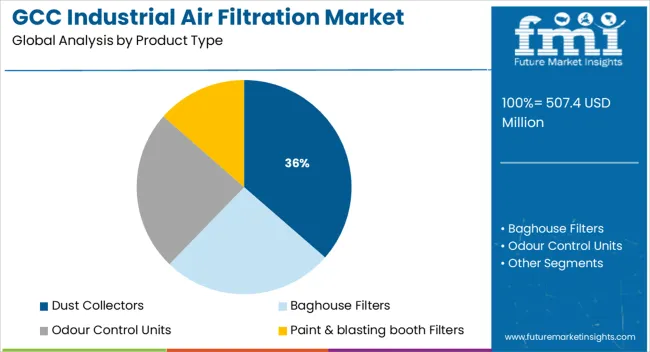
[185 Pages Report] Future Market Insights (FMI) has valued the GCC Industrial Air Filtration Market at US$ 407.0 Million in 2021 and has estimated the market to grow at a CAGR of 5.7% to reach a valuation of US$ 751.4 Million by 2032. In the product type segment, odor control units account for more than 1/3rd of the market value share of the total GCC industrial air filtration by the end of the forecast period.

Sales of Industrial Air filtration have increased as a result of growing industrialization in GCC. Currently, some of the prominent markets in GCC for Industrial Air filtration are Saudi Arabia, UAE, and Qatar, where industry experts predict usage of the equipment to soar over the next decade.

Report Attributes Details
GCC Industrial Air Filtration Market Size (2021A) US$ 407.0 Million
GCC Industrial Air Filtration Market Size (2022E) US$ 429.7 Million
Projected GCC Industrial Air Filtration Market Value (2032F) US$ 751.4 Million
Value CAGR (2022 to 2032) 5.7%
Collective Value Share: Top 3 Countries (2022) 85%

Saudi Arabia is expected to dominate the GCC Industrial Air Filtration Market in terms of revenue in 2022 and is anticipated to grow throughout the forecast period. Saudi Arabia is projected to hold more than half the share of the GCC market.

In terms of demand-side behavior, the increasing necessity for air filtration inside warehouses and distribution centers is anticipated to boost the growth of the industrial air filtration market. Warehouses are more likely to produce pollution owing to the frequent deliveries from large vehicles, which emit more pollution. Particulates emitted from diesel trucks can cause serious health issues. Industrial air filtration helps in collecting smoke and dust at the source and is generally the most effective means of controlling contaminants from industrial processes.

The GCC Industrial Air Filtration Market is 2.9% of its parent market, Global Industrial Air Filtration Market.

Don't pay for what you don't need

Customize your report by selecting specific countries or regions and save 30%!

Sales Analysis of GCC Industrial Air Filtration from 2017 to 2021 Vs Market Projections for 2022 to 2032

As per FMI analysis, the demand for GCC Industrial Air Filtration Market is anticipated to grow by US$ 407 Million in 2021, the industrial air Filtration is anticipated to grow at 2.7% CAGR by value between 2017 and 2021.

The GCC Industrial Air Filtration Market is projected to grow at a significant rate, owing to the increasing power industry, pharmaceutical industry, and cement industry. The increasing popularity of custom-built products amongst end users is creating a huge scope for R&D activities for manufacturers. The customized filtration system allows end users to choose the right products for their application according to various technical factors such as dust load and dust type. Due to such increasing demand, manufacturers have also focused on enhancing their offerings with customized products. The Industrial Air Filtration Market also owes some of its growth to increased investments in urban development and the expansion of manufacturing plants throughout GCC countries to support governments' initiative to shift the dependency of revenue generation from the Oil & Gas to the Industrial Sector. In countries like KSA and the UAE - where industrialization is gaining momentum - safety from air pollution continues to grow in popularity as more regulations are enacted to ensure worker safety.

Another force behind the ever-expanding market for industrial air filtration is the demand among customers for newer and better filtration systems. As the technology behind Industrial Air filtration improves, users of industrial air filtration trade up their equipment for newer models. New and improved technology leads to improved efficiency, better ease of use, and inclusive savings in operational costs. These qualities compel users of industrial air filtration to replace their machines regularly.

The growth of industrial air Filtration in the GCC market is anticipated to grow by 1.7x from 2022 to 2032

GCC Industrial Air Filtration Market

What are the key Trends in the GCC Industrial Air Filtration Market?

  • Bag-House Air Filtration Systems Gaining Popularity in the GCC Market

Carbon black, cement, insulation production, lime, metals and mining, and power all employ baghouses. Baghouses are available in a variety of fabrics and are frequently used in hot, high-temperature, and dry operations. The Gulf countries probably favor baghouse air filtration systems because of how simple they are to install, how effective they are financially, and how well they can handle large amounts of dust.

A number of sectors are in charge of producing dust particles as a result of increased consumption in several nations, including Saudi Arabia and the United Arab Emirates, which is further boosting the demand for baghouse filters. Depending on the type of particulate, the temperature of the gases entering the baghouse, and the gas constituents, bags are designed in a wide variety of fabrics and finishes.

  • Local Manufacturers are making partnerships & collaborating with raw material suppliers and filtration consumable suppliers

The local manufacturers present in the Gulf region are creating partnerships with raw material suppliers, housing unit manufacturers, and filter consumable manufacturers to create proper assembly lines under the name of their own brand. Due to this strategy, the market players have the advantage of offering more products.

The manufacturers in the present market are providing custom-built air filtration systems to the end users by designing the system according to the customer's application, which enhances their customer relationship and increases brand value in the market.

Nikhil Kaitwade
Nikhil Kaitwade

Principal Consultant

Talk to Analyst

Find your sweet spots for generating winning opportunities in this market.

What is driving the growth of Industrial Air Filtration Market?

Increasing Governmental Policies for Industrial Indoor Pollution Levels

By heavily investing in a variety of clean and renewable energy sources and technologies, the UAE government hopes to achieve carbon emission-free status by the year 2050. The UAE government estimates that in 2019, 76% of PM10 pollutants were caused by industrial air pollution. The total emissions in the region are significantly influenced by a number of industries, including those in manufacturing, woodworking, cement, food & beverage, pharmaceuticals, and utility production, which drives up the need for air filters such as dust collectors and baghouse filters.

The removal of particle pollutants is aided by air filtration systems because of their different sizes and customized designs. The demand for air filtration is expected to increase throughout the anticipated period due to increased laws and regulations by the national governments in the GCC region.
Country-wise Insights

Where Does the Saudi Arabia Stand in the GCC Industrial Air Filtration Market?

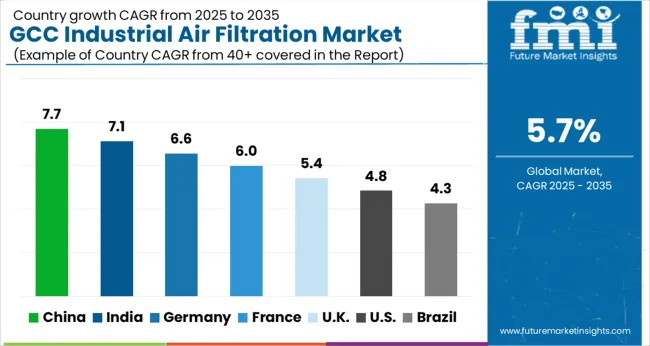
Saudi Arabia is set to create an absolute dollar opportunity worth US$ 168.4 Million during the forecast period.

Saudi Arabia dominates the market for industrial air filtration in the GCC region. The growing investment in research and development by foreign companies in the country is leading to the growth of small and large-scale businesses in the country resulting in positively influencing the growth of the industrial air filtration market in Saudi Arabia.

The growing end-use industries such as food and beverage, pharma, power, etc. are stimulating the demand for industrial air filtration in the country. Moreover, Saudi Arabia is considered one of the largest producers of cement within the GCC countries. The growing demand for residential, commercial, and industrial construction is driving the growth of the cement industries, which is thereby driving the demand for industrial air filtration systems in cement manufacturing plants.

What is the Projected Growth Rate of the Industrial Air Filtration Market in the UAE?

The UAE industrial air filtration market is expected to grow at a 6.1% CAGR during the forecast period, creating an absolute dollar opportunity worth US$ 68.2 million.

According to the UAE Economic Vision 2030, industrial activity is increasing in the UAE to achieve sustainable economic diversification. By 2025, the UAE government is expecting to see the manufacturing sector's share of the total GDP rise from the present 11% to 25%. Accordingly, the manufacturing industry is expanding quickly. The UAE's oil and gas industry has helped the nation's economy flourish and has provided a significant investment to spend in manufacturing industries. Moreover, new industrial facilities have popped up all around recently, and foreign direct investments have also been welcomed in the country. As there has been significant growth in the manufacturing industry, the demand for industrial air filtration is also increasing in the UAE.

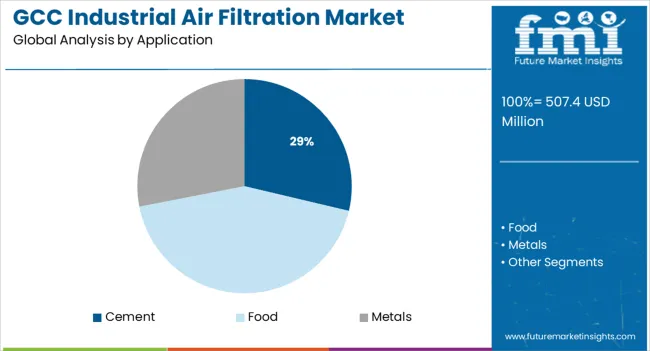
The application segment share varies in key markets; the chart above depicts an elaborated view of the application segment share by key market. Metal has a large stake, followed by food. By Country, Saudi Arabia has the highest share of the industrial air filtration market. The UAE has a significant share and is expected to grow at a steady rate during the forecast period.

Get the data you need at a Fraction of the cost

Personalize your report by choosing insights you need
and save 40%!

Category-wise Insights

Which Product Type of Industrial Air Filtration has more Demand in the GCC Market?

By Product Type, odour control units will dominate the market through the forecast period and will account for more than 33.9% share on a value basis by 2032.

An odour nuisance can cause stress and can be harmful to humans. Without proper odour control, industrial odours can spread into surrounding areas and cause stakeholders to complain. The role that odour control units perform is crucial and necessary. Odour control systems capture and neutralise odour molecules to cover up offensive odours and eliminate them. The odour control units are designed to eliminate volatile organic compounds (VOC), and hazardous air pollutants (HAP), and to meet other odour regulations.

Which Application has more Demand for Industrial Air Filtration in GCC Market?

According to research, the food industry remains the most popular. The food industry is anticipated to remain dominant throughout the forecast period.

Increases in population, awareness of healthy eating habits, and increasing food consumption all contributed to the GCC food market's expansion. Consumption of organic and healthy food is expected to increase with growing awareness. Food production entirely depends on clean air. Contamination can only be reduced with regulated and monitored air quality. The use of filtration solutions with high efficiency provides maximum air hygiene and air quality compliance within the strictest standards and regulations.

The Food industry is set to grow with a CAGR of 6.9% and is estimated to create an absolute dollar opportunity worth US$ 76.2 Million during the forecast period.
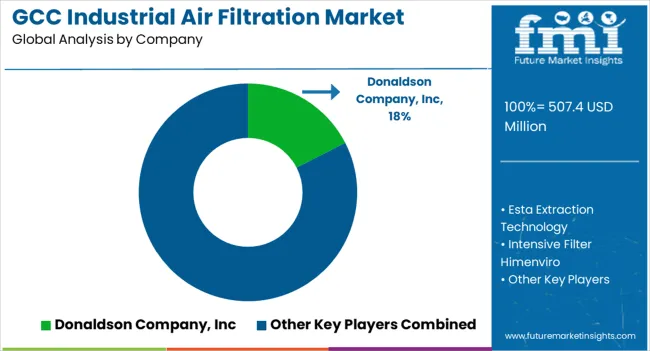
Competitive Landscape

The GCC Industrial Air Filtration Market is gaining momentum with the presence of several big, medium, and small-scale system manufacturers, and service providers. Prominent industrial air Filtration manufacturers are collaborating and partnering with big manufacturers for better market opportunities.

Industrial Air Filtration Market Report Scope

Attribute Details
Forecast Period 2022 to 2032
Historical Data Available for 2017 to 2021
Market Analysis USD Million for Value
Key Countries Covered Saudi Arabia, UAE, Qatar, Kuwait, Oman, Bahrain
Key Market Segments Covered By Product Type, By Application, and By Country
Key Companies Profiled
  • Esta Extraction Technology
  • Intensive Filter Himenviro
  • Wam Group
  • Tama Aernova
  • Absolent Air Care Group
  • Hanza Environment Technology Factory
  • CAMFIL GROUP
  • Donaldson Company, Inc
  • AGET Manufacturing
  • Filter Concept Pvt. Ltd
Report Coverage Market Forecast, brand share analysis, competition intelligence, DROT analysis, Market Dynamics and Challenges, Strategic Growth Initiatives
Customization & Pricing Available upon Request

Key Segments Covered in GCC Industrial Air Filtration Market Analysis

GCC Industrial Air Filtration Market by Product Type:

  • Dust Collectors
  • Baghouse Filters
  • Odour Control Units
  • Paint & blasting booth Filters

GCC Industrial Air Filtration Market by Application:

  • Cement
  • Food
    • Cereal ingredients
    • Spices
    • Feed & Raw grain
    • agricultural products
    • Eggshell & dust
    • Sugar dust
    • Flours
    • Corn starches
    • Others
  • Metals
    • Grinding
    • Sandblasting
    • Welding Fumes
    • Fine powders
    • Others
  • Power
  • Pharmaceuticals
  • Others

GCC Industrial Air Filtration Market by Country:

  • Saudi Arabia
  • UAE
  • Qatar
  • Kuwait
  • Oman
  • Bahrain

Frequently Asked Questions

How much is the GCC market for Industrial Air Filtration System worth?

The GCC Industrial Air Filtration Market is currently valued at US$ 407.0 Million (2021).

What is the predicted growth rate for the GCC Industrial Air Filtration Market from 2022 to 2032?

Sales of GCC Industrial Air Filtration are slated to surge at a CAGR of around 5.7% from 2022 to 2032.

Which are the most lucrative Industrial Air Filtration Markets?

Saudi Arabia is a lucrative market for Industrial Air Filtration.

Who are the top 5 Industrial Air Filtration Market manufacturers?

Tier-1 firms such as Donaldson Company Inc, CAMFIL GROUP, Wam Group, Absolent Group, and Hanza Environment Technology are the top 5 manufacturers of industrial air filtration.

How is the Industrial Air Filtration Market shaping up in UAE?

The market for industrial air Filtration by value in UAE is expected to surge at 6.1% CAGR through 2032.

Table of Content

1. Executive Summary | GCC Industrial Air Filtration Market

    1.1. GCC Market Outlook

    1.2. Demand Side Trends

    1.3. Supply Side Trends

    1.4. Material Roadmap

    1.5. Analysis and Recommendations

2. Market Overview

    2.1. Market Coverage / Taxonomy

    2.2. Market Definition / Scope / Limitations

3. Key Market Trends

    3.1. Key Trends Impacting the Market

    3.2. Product Innovation / Development Trends

4. Key Success Factors

    4.1. Product Adoption / Usage Analysis

    4.2. Product USPs / Features

    4.3. Strategic Promotional Strategies

5. Market Demand Analysis 2014 to 2021 and Forecast, 2022 to 2032

    5.1. Historical Market Volume (Units) Analysis, 2014 to 2021

    5.2. Current and Future Market Volume (Units) Projections, 2022 to 2032

    5.3. Y-o-Y Growth Trend Analysis

6. Market - Pricing Analysis

    6.1. Regional Pricing Analysis By Product Type

    6.2. GCC Average Pricing Analysis Benchmark

7. Market Demand (in Value or Size in US$ Million) Analysis 2014 to 2021 and Forecast, 2022 to 2032

    7.1. Historical Market Value (US$ Million) Analysis, 2014 to 2021

    7.2. Current and Future Market Value (US$ Million) Projections, 2022 to 2032

        7.2.1. Y-o-Y Growth Trend Analysis

        7.2.2. Absolute $ Opportunity Analysis

8. Market Background

    8.1. Macro-Economic Factors

        8.1.1. GCC GDP Growth Outlook

        8.1.2. Statistical Comparison of GCC Countries

        8.1.3. Economical Comparison of GCC Countries

        8.1.4. GCC Market Cement Consumption by Region

        8.1.5. GCC Food Consumption

        8.1.6. Parent Market Overview

    8.2. Forecast Factors - Relevance & Impact

        8.2.1. Technological innovation.

        8.2.2. Rapid Industrialization

        8.2.3. Increasing Investments

        8.2.4. Replacement demand

        8.2.5. Competitive Intensity

        8.2.6. COVID-19 Impact

    8.3. Value Chain

        8.3.1. List of Manufacturers

        8.3.2. List of Physical Distributors

        8.3.3. Trade Margins/Profit Margins

    8.4. Buyers Decision Rationale

    8.5. COVID-19 Crisis – Impact Assessment

        8.5.1. Current Statistics

        8.5.2. Short-Mid-Long Term Outlook

        8.5.3. Likely Rebound

    8.6. Market Dynamics

        8.6.1. Drivers

        8.6.2. Restraints

        8.6.3. Opportunity Analysis

9. Market Analysis 2014 to 2021 and Forecast 2022 to 2032, By Product Type

    9.1. Introduction / Key Findings

    9.2. Historical Market Size (US$ Million) and Volume Analysis By Product Type, 2014 to 2021

    9.3. Current and Future Market Size (US$ Million) and Volume Analysis and Forecast By Product Type, 2022 to 2032

        9.3.1. Dust Collectors

        9.3.2. Baghouse Filters

        9.3.3. Odour Control Units

        9.3.4. Paint & blasting booth Filters

    9.4. Market Attractiveness Analysis By Product Type

10. Market Analysis 2014 to 2021 and Forecast 2022 to 2032, by Application

    10.1. Introduction

    10.2. Historical Market Size (US$ Million) and Volume Analysis by Application, 2014 to 2021

    10.3. Current Market Size (US$ Million) and Volume Analysis and Forecast by Application, 2022 to 2032

        10.3.1. Cement

        10.3.2. Food

            10.3.2.1. Cereal ingredients

            10.3.2.2. Spices

            10.3.2.3. Feed & Raw grain

            10.3.2.4. Agricultural products

            10.3.2.5. Eggshell & dust

            10.3.2.6. Sugar dust

            10.3.2.7. Flours

            10.3.2.8. Corn starches

            10.3.2.9. Others

        10.3.3. Metals

            10.3.3.1. Grinding

            10.3.3.2. Sandblasting

            10.3.3.3. Welding Fumes

            10.3.3.4. Fine powders

            10.3.3.5. Others

        10.3.4. Power

        10.3.5. Pharmaceuticals

        10.3.6. Others

        10.3.7. Market Attractiveness Analysis by Application

11. Market Analysis 2014 to 2021 and Forecast 2022 to 2032, by Region

    11.1. Introduction

    11.2. Historical Market Size (US$ Million) and Volume Analysis by Region, 2014 to 2021

    11.3. Current Market Size (US$ Million) and Volume Analysis and Forecast by Region, 2022 to 2032

        11.3.1. Saudi Arabia

        11.3.2. UAE

        11.3.3. Qatar

        11.3.4. Kuwait

        11.3.5. Oman

        11.3.6. Bahrain

    11.4. Market Attractiveness Analysis by Region

12. Saudi Arabia Market Analysis 2014 to 2021 and Forecast 2022 to 2032

    12.1. Introduction

    12.2. Pricing Analysis

    12.3. Historical Market Size (US$ Million) and Volume Trend Analysis by Market Taxonomy, 2014 to 2021

    12.4. Market Size (US$ Million) and Volume Forecast by Market Taxonomy, 2022 to 2032

        12.4.1. By Product Type

        12.4.2. By Application

    12.5. Market Attractiveness Analysis

        12.5.1. By Product Type

        12.5.2. By Application

    12.6. Drivers and Restraints - Impact Analysis

13. UAE Market Analysis 2014 to 2021 and Forecast 2022 to 2032

    13.1. Introduction

    13.2. Pricing Analysis

    13.3. Historical Market Size (US$ Million) and Volume Trend Analysis by Market Taxonomy, 2014 to 2021

    13.4. Market Size (US$ Million) and Volume Forecast by Market Taxonomy, 2022 to 2032

        13.4.1. By Product Type

        13.4.2. By Application

    13.5. Market Attractiveness Analysis

        13.5.1. By Product Type

        13.5.2. By Application

    13.6. Drivers and Restraints - Impact Analysis

14. Qatar Market Analysis 2014 to 2021 and Forecast 2022 to 2032

    14.1. Introduction

    14.2. Pricing Analysis

    14.3. Historical Market Size (US$ Million) and Volume Trend Analysis by Market Taxonomy, 2014 to 2021

    14.4. Market Size (US$ Million) and Volume Forecast by Market Taxonomy, 2022 to 2032

        14.4.1. By Product Type

        14.4.2. By Application

    14.5. Market Attractiveness Analysis

        14.5.1. By Product Type

        14.5.2. By Application

    14.6. Drivers and Restraints - Impact Analysis

15. Kuwait Market Analysis 2014 to 2021 and Forecast 2022 to 2032

    15.1. Introduction

    15.2. Pricing Analysis

    15.3. Historical Market Size (US$ Million) and Volume Trend Analysis by Market Taxonomy, 2014 to 2021

    15.4. Market Size (US$ Million) and Volume Forecast by Market Taxonomy, 2022 to 2032

        15.4.1. By Product Type

        15.4.2. By Application

    15.5. Market Attractiveness Analysis

        15.5.1. By Product Type

        15.5.2. By Application

    15.6. Key Market Participants - Intensity Mapping

    15.7. Drivers and Restraints - Impact Analysis

16. Oman Market Analysis 2014 to 2021 and Forecast 2022 to 2032

    16.1. Introduction

    16.2. Pricing Analysis

    16.3. Historical Market Size (US$ Million) and Volume Trend Analysis by Market Taxonomy, 2014 to 2021

    16.4. Market Size (US$ Million) and Volume Forecast by Market Taxonomy, 2022 to 2032

        16.4.1. By Product Type

        16.4.2. By Application

    16.5. Market Attractiveness Analysis

        16.5.1. By Product Type

        16.5.2. By Application

    16.6. Key Market Participants - Intensity Mapping

    16.7. Drivers and Restraints - Impact Analysis

17. Bahrain Market Analysis 2014 to 2021 and Forecast 2022 to 2032

    17.1. Introduction

    17.2. Pricing Analysis

    17.3. Historical Market Size (US$ Million) and Volume Trend Analysis by Market Taxonomy, 2014 to 2021

    17.4. Market Size (US$ Million) and Volume Forecast by Market Taxonomy, 2022 to 2032

        17.4.1. By Product Type

        17.4.2. By Application

    17.5. Market Attractiveness Analysis

        17.5.1. By Product Type

        17.5.2. By Application

    17.6. Key Market Participants - Intensity Mapping

    17.7. Drivers and Restraints - Impact Analysis

18. Market Structure Analysis

    18.1. Market Analysis by Tier of Companies (Industrial Air Filtration)

    18.2. Market Share Analysis of Top Players

    18.3. Market Presence Analysis

19. Competition Analysis

    19.1. Competition Dashboard

    19.2. Competition Benchmarking

    19.3. Competition Deep Dive

        19.3.1. Esta Extraction Technology

            19.3.1.1. Overview

            19.3.1.2. Product Portfolio

            19.3.1.3. Profitability by Market Segments (Product / Channel / Region)

            19.3.1.4. Sales Footprint

            19.3.1.5. Strategy Overview

        19.3.2. Intensive Filter Himenviro

            19.3.2.1. Overview

            19.3.2.2. Product Portfolio

            19.3.2.3. Profitability by Market Segments (Product / Channel / Region)

            19.3.2.4. Sales Footprint

            19.3.2.5. Strategy Overview

        19.3.3. Wam Group

            19.3.3.1. Overview

            19.3.3.2. Product Portfolio

            19.3.3.3. Profitability by Market Segments (Product / Channel / Region)

            19.3.3.4. Sales Footprint

            19.3.3.5. Strategy Overview

        19.3.4. Tama Aernova

            19.3.4.1. Overview

            19.3.4.2. Product Portfolio

            19.3.4.3. Profitability by Market Segments (Product / Channel / Region)

            19.3.4.4. Sales Footprint

            19.3.4.5. Strategy Overview

        19.3.5. Absolent Air Care Group

            19.3.5.1. Overview

            19.3.5.2. Product Portfolio

            19.3.5.3. Profitability by Market Segments (Product / Channel / Region)

            19.3.5.4. Sales Footprint

            19.3.5.5. Strategy Overview

        19.3.6. Hanza Environment Technology Factory

            19.3.6.1. Overview

            19.3.6.2. Product Portfolio

            19.3.6.3. Profitability by Market Segments (Product / Channel / Region)

            19.3.6.4. Sales Footprint

            19.3.6.5. Strategy Overview

        19.3.7. CAMFIL GROUP

            19.3.7.1. Overview

            19.3.7.2. Product Portfolio

            19.3.7.3. Profitability by Market Segments (Product / Channel / Region)

            19.3.7.4. Sales Footprint

            19.3.7.5. Strategy Overview

        19.3.8. Donaldson Company, Inc

            19.3.8.1. Overview

            19.3.8.2. Product Portfolio

            19.3.8.3. Profitability by Market Segments (Product / Channel / Region)

            19.3.8.4. Sales Footprint

            19.3.8.5. Strategy Overview

        19.3.9. INC.

            19.3.9.1. Overview

            19.3.9.2. Product Portfolio

            19.3.9.3. Profitability by Market Segments (Product / Channel / Region)

            19.3.9.4. Sales Footprint

            19.3.9.5. Strategy Overview

        19.3.10. AGET Manufacturing

            19.3.10.1. Overview

            19.3.10.2. Product Portfolio

            19.3.10.3. Profitability by Market Segments (Product / Channel / Region)

            19.3.10.4. Sales Footprint

            19.3.10.5. Strategy Overview

        19.3.11. Filter Concept Pvt. Ltd.

            19.3.11.1. Overview

            19.3.11.2. Product Portfolio

            19.3.11.3. Profitability by Market Segments (Product / Channel / Region)

            19.3.11.4. Sales Footprint

            19.3.11.5. Strategy Overview

20. Assumptions and Acronyms Used

21. Research Methodology

Don't pay for what you don't need

Customize your report by selecting specific countries or regions and save 30%!

List of Tables

Table 01: Market Value (US$ Million) and Volume (Units) Historical Data 2017 to 2021 and Forecast 2022 to 2032 By Product Type

Table 02: Market Value Volume (Units) Historical Data 2017 to 2021 and Forecast 2022 to 2032 By Application

Table 03: Market Value (US$ Million) Historical Data 2017 to 2021 and Forecast 2022 to 2032 By Application

Table 04: Market Value (US$ Million) and Volume ('000 Units) Historical Data 2017 to 2021 and Forecast 2022 to 2032 by Country

Table 05: Saudi Arabia Market Value (US$ Million) and Volume (Units) Historical Data 2017 to 2021 and Forecast 2022 to 2032 By Product Type

Table 06: Saudi Arabia Market Value Volume (Units) Historical Data 2017 to 2021 and Forecast 2022 to 2032 By Application

Table 07: Saudi Arabia Market Value (US$ Million) Historical Data 2017 to 2021 and Forecast 2022 to 2032 By Application

Table 08: UAE Market Value (US$ Million) and Volume (Units) Historical Data 2017 to 2021 and Forecast 2022 to 2032 By Product Type

Table 09: UAE Market Value Volume (Units) Historical Data 2017 to 2021 and Forecast 2022 to 2032 By Application

Table 10: UAE Market Value (US$ Million) Historical Data 2017 to 2021 and Forecast 2022 to 2032 By Application

Table 11: Qatar Market Value (US$ Million) and Volume (Units) Historical Data 2017 to 2021 and Forecast 2022 to 2032 By Product Type

Table 12: Qatar Market Value Volume (Units) Historical Data 2017 to 2021 and Forecast 2022 to 2032 By Application

Table 13: Qatar Market Value (US$ Million) Historical Data 2017 to 2021 and Forecast 2022 to 2032 By Application

Table 14: Kuwait Market Value (US$ Million) and Volume (Units) Historical Data 2017 to 2021 and Forecast 2022 to 2032 By Product Type

Table 15: Kuwait Market Value Volume (Units) Historical Data 2017 to 2021 and Forecast 2022 to 2032 By Application

Table 16: Kuwait Market Value (US$ Million) Historical Data 2017 to 2021 and Forecast 2022 to 2032 By Application

Table 17: Oman Market Value (US$ Million) and Volume (Units) Historical Data 2017 to 2021 and Forecast 2022 to 2032 By Product Type

Table 18: Oman Market Value Volume (Units) Historical Data 2017 to 2021 and Forecast 2022 to 2032 By Application

Table 19: Oman Market Value (US$ Million) Historical Data 2017 to 2021 and Forecast 2022 to 2032 By Application

Table 20: Bahrain Market Value (US$ Million) and Volume (Units) Historical Data 2017 to 2021 and Forecast 2022 to 2032 By Product Type

Table 21: Bahrain Market Value Volume (Units) Historical Data 2017 to 2021 and Forecast 2022 to 2032 By Application

Table 22: Bahrain Market Value (US$ Million) Historical Data 2017 to 2021 and Forecast 2022 to 2032 By Application
Nikhil Kaitwade
Nikhil Kaitwade

Principal Consultant

Talk to Analyst

Find your sweet spots for generating winning opportunities in this market.

List of Charts

Figure 01: Market Historical Volume (Units), 2017 to 2021

Figure 02: Market Volume (Units) Forecast, 2022 to 2032

Figure 03: Market Value (US$ Million) and Y-o-Y Growth Rate From 2022 to 2032

Figure 04: Market Absolute $ Opportunity Analysis, 2022 to 2032

Figure 05: Market Share and BPS Analysis by Product Type 2022 to 2032

Figure 06: Market Y-o-Y Growth Projections by Product Type, 2021 to 2032

Figure 07: Market Attractiveness by Product Type, 2022 to 2032

Figure 08: Market Absolute $ Opportunity, 2021 to 2032, by Dust Collectors segment

Figure 09: Market Absolute $ Opportunity, 2021 to 2032, by Baghouse Filters segment

Figure 10: Market Absolute $ Opportunity, 2021 to 2032, by Odour Control Units segment

Figure 11: Market Absolute $ Opportunity, 2021 to 2032, by Paint & blasting booth Filters segment

Figure 12: Market Share and BPS Analysis by Application 2022 to 2032

Figure 13: Market Y-o-Y Growth Projections by Application, 2021 to 2032

Figure 14: Market Attractiveness by Application, 2022 to 2032

Figure 15: Market Absolute $ Opportunity 2021 to 2032, by Cement segment

Figure 16: Market Absolute $ Opportunity 2021 to 2032, by Food segment

Figure 17: Market Absolute $ Opportunity 2021 to 2032, by Metals segment

Figure 18: Market Absolute $ Opportunity 2021 to 2032, by Power segment

Figure 19: Market Absolute $ Opportunity 2021 to 2032, by Pharmaceuticals segment

Figure 20: Market Absolute $ Opportunity 2021 to 2032, by Others segment

Figure 21: Market Share and BPS Analysis by Country 2022 to 2032

Figure 22: Market Y-o-Y Growth Projections by Country, 2021 to 2032

Figure 23: Market Attractiveness by Country, 2022 to 2032

Figure 24: Saudi Arabia Market Absolute $ Opportunity, 2021 to 2032

Figure 25: UAE Market Absolute $ Opportunity, 2021 to 2032

Figure 26: Qatar Market Absolute $ Opportunity, 2021 to 2032

Figure 27: Kuwait Market Absolute $ Opportunity, 2021 to 2032

Figure 28: Oman Market Absolute $ Opportunity, 2021 to 2032

Figure 29: Bahrain Market Absolute $ Opportunity, 2021 to 2032

Figure 30: Saudi Arabia Market Share and BPS Analysis by Product Type 2022 to 2032

Figure 31: Saudi Arabia Market Y-o-Y Growth Projections by Product Type, 2021 to 2032

Figure 32: Saudi Arabia Market Attractiveness by Product Type, 2022 to 2032

Figure 33: Saudi Arabia Market Share and BPS Analysis by Application 2022 to 2032

Figure 34: Saudi Arabia Market Y-o-Y Growth Projections by Application, 2021 to 2032

Figure 35: Saudi Arabia Market Attractiveness by Application, 2022 to 2032

Figure 36: UAE Market Share and BPS Analysis by Product Type 2022 to 2032

Figure 37: UAE Market Y-o-Y Growth Projections by Product Type, 2021 to 2032

Figure 38: UAE Market Attractiveness by Product Type, 2022 to 2032

Figure 39: UAE Market Share and BPS Analysis by Application 2022 to 2032

Figure 40: UAE Market Y-o-Y Growth Projections by Application, 2021 to 2032

Figure 41: UAE Market Attractiveness by Application, 2022 to 2032

Figure 42: Qatar Market Share and BPS Analysis by Product Type 2022 to 2032

Figure 43: Qatar Market Y-o-Y Growth Projections by Product Type, 2021 to 2032

Figure 44: Qatar Market Attractiveness by Product Type, 2022 to 2032

Figure 45: Qatar Market Share and BPS Analysis by Application 2022 to 2032

Figure 46: Qatar Market Y-o-Y Growth Projections by Application, 2021 to 2032

Figure 47: Qatar Market Attractiveness by Application, 2022 to 2032

Figure 48: Kuwait Market Share and BPS Analysis by Product Type 2022 to 2032

Figure 49: Kuwait Market Y-o-Y Growth Projections by Product Type, 2021 to 2032

Figure 50: Kuwait Market Attractiveness by Product Type, 2022 to 2032

Figure 51: Kuwait Market Share and BPS Analysis by Application 2022 to 2032

Figure 52: Kuwait Market Y-o-Y Growth Projections by Application, 2021 to 2032

Figure 53: Kuwait Market Attractiveness by Application, 2022 to 2032

Figure 54: Oman Market Share and BPS Analysis by Product Type 2022 to 2032

Figure 55: Oman Market Y-o-Y Growth Projections by Product Type, 2021 to 2032

Figure 56: Oman Market Attractiveness by Product Type, 2022 to 2032

Figure 57: Oman Market Share and BPS Analysis by Application 2022 to 2032

Figure 58: Oman Market Y-o-Y Growth Projections by Application, 2021 to 2032

Figure 59: Oman Market Attractiveness by Application, 2022 to 2032

Figure 60: Bahrain Market Share and BPS Analysis by Product Type 2022 to 2032

Figure 61: Bahrain Market Y-o-Y Growth Projections by Product Type, 2021 to 2032

Figure 62: Bahrain Market Attractiveness by Product Type, 2022 to 2032

Figure 63: Bahrain Market Share and BPS Analysis by Application 2022 to 2032

Figure 64: Bahrain Market Y-o-Y Growth Projections by Application, 2021 to 2032

Figure 65: Bahrain Market Attractiveness by Application, 2022 to 2032

Recommendations

Food and Beverage

Food And Beverage Air Filtration Market

Published : June 2023

Industrial Automation

Compressed Air Filtration and Dryer System Market

Published : May 2023

Industrial Automation

Industrial Air Filtration Market

Published : May 2023

Explore Industrial Automation Insights

View Reports

GCC Industrial Air Filtration Market