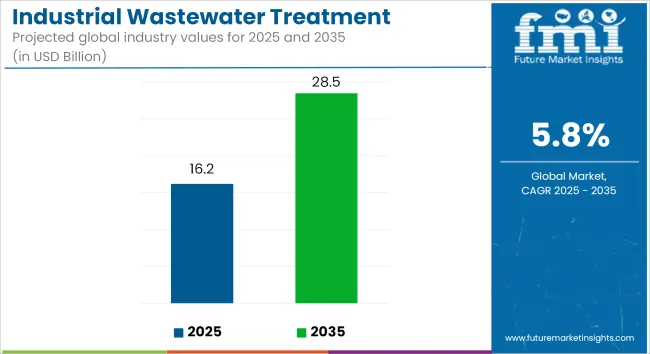
The global industrial wastewater treatment chemicals market is estimated to be valued at USD 16.2 billion in 2025 and is forecast to grow to USD 28.5 billion by 2035, advancing at a CAGR of 5.8% during the forecast period. Market growth is being supported by stricter discharge regulations, rising industrial water reuse targets, and increasing adoption of chemical-based treatment across sectors including oil & gas, power generation, and manufacturing.

| Metrics | Values |
|---|---|
| Industry Size (2025E) | USD 16.2 billion |
| Industry Value (2035F) | USD 28.5 billion |
| CAGR | 5.8% |
Chemical treatments are being employed to remove suspended solids, neutralize biological contaminants, and mitigate corrosion and scaling in industrial effluent systems. Coagulants and flocculants are being used extensively to improve solids settling and enhance membrane performance, particularly in high-load and zero-liquid discharge (ZLD) operations. Their effectiveness in total suspended solids (TSS) removal is maintaining their dominance in the chemical treatment segment.
Biocides are being applied under tighter microbial standards enforced through EU wastewater directives and international standards such as ISO 5667. Pathogen control programs have been implemented across food, petrochemical, and pharmaceutical industries. For example, Dow’s chlorination-based biocide systems were introduced into UK food processing lines following microbial contamination incidents in 2023.
In the oil & gas industry, refiners and upstream operators are employing chemical solutions to comply with discharge mandates under the USA Clean Water Act and India’s ZLD policy. Petrobras in Brazil has reduced suspended solids by over 90% using a coagulant-flocculant dosing scheme, while BASF in Germany upgraded its membrane facilities by integrating flocculant-based pretreatment stages to support internal reuse systems.
Automation and real-time monitoring are gaining momentum. EDF in France has deployed automated Coagulant Dosing Units equipped with pH and turbidity sensors, enabling real-time adjustments that reduce chemical consumption and align with ESG goals.
Sustainability pressures are promoting the shift toward green chemical alternatives. Kemira’s biomass-balanced flocculants and Veolia’s Ecolabel-certified “eco-floc” line are being adopted by clients focused on minimizing environmental impact while meeting compliance standards.
With water scarcity intensifying and discharge compliance becoming more rigorous, industrial wastewater treatment chemicals are projected to remain essential to operational continuity, environmental stewardship, and regulatory alignment through 2035.
Coagulants & flocculants are projected to capture around 35% of market share in 2025, growing at a CAGR of 6.0% through 2035. These chemicals are essential in clarifying water by aggregating suspended particles and enabling sedimentation or filtration. Widely used in municipal treatment and industrial sectors like mining, oil refining, and paper manufacturing, these agents improve treatment efficacy and reduce downstream processing load.
Emerging trends such as bio-based and low-sludge coagulants are enhancing performance and aligning with environmental sustainability mandates. Demand is growing in Asia-Pacific and the Middle East, where expanding industrialization is creating higher influent volumes with complex contaminants.

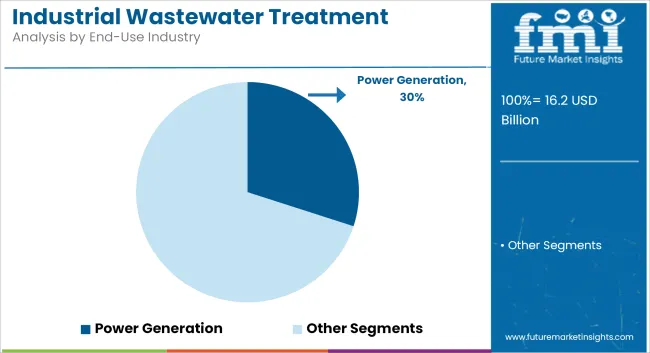
The power generation sector is expected to lead demand, holding approximately 30% share in 2025, and is forecast to grow at a CAGR of 6.1% through 2035. Power plants, especially thermal and coal-based, require substantial water for cooling and steam production. Chemicals are used to treat boiler feed water, manage scaling, and ensure safe discharge of effluents.
As the industry shifts toward more sustainable practices and higher water recovery ratios, chemical demand is expanding for both treatment and recycling processes. Regulatory requirements like those from the USA EPA and EU Water Framework Directive are also contributing to higher consumption of compliant and efficient treatment solutions.
| Risk | Probability & Impact |
|---|---|
| Regulatory Changes | High probability, high impact due to stricter environmental standards worldwide. |
| Raw Material Price Fluctuations | Medium probability, high impact as price increases could affect profitability. |
| Technological Disruptions | Medium probability, medium impact, as rapid tech changes could alter chemical formulations. |
1-Year Executive Watchlist
| Priority | Immediate Action |
|---|---|
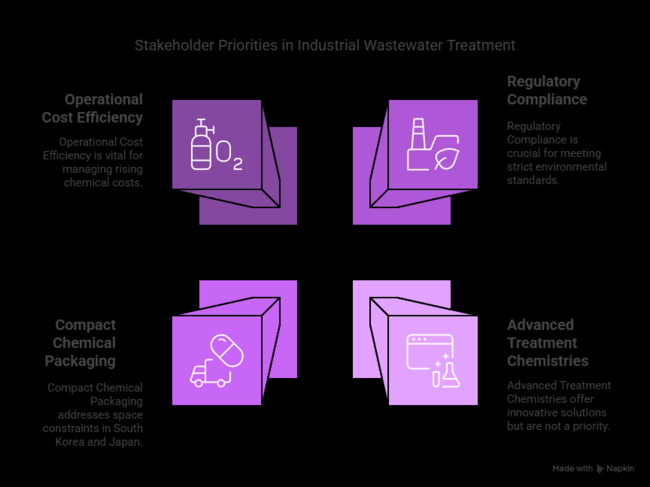
| Evaluate Sustainable Formulations | Run feasibility studies on biodegradable and non-toxic chemical alternatives. |
| Strengthen Regulatory Readiness | Initiate proactive audits and compliance alignment for upcoming wastewater discharge norms. |
| Expand Emerging Industry Access | Launch distributor partnerships and localized industry campaigns in Southeast Asia and Latin America. |
In order to benefit from the fast-expanding industrial wastewater treatment chemicals industry, the company needs to focus on enhancing its product line to include sustainable and highly effective treatment chemicals, especially coagulants and flocculants.

Expansion of regional partnerships and strategic investment in acquisition-based growth in future industries such as Southeast Asia will further bolster competitive advantage. Supporting sustainability efforts and regulatory trends will also be central to sustaining long-term growth while complying with shifting global standards.
| Country/Region | Policy & Regulatory Impact + Certifications |
|---|---|
| United States | Strict enforcement of the Clean Water Act (CWA) and the National Pollutant Discharge Elimination System (NPDES) drives demand for advanced treatment chemicals. Some states, like California, impose additional rules under the State Water Resources Control Board. Products often need EPA registration for biocides and antimicrobials. |
| Western Europe (EU) | The EU Urban Wastewater Treatment Directive and Water Framework Directive (WFD) mandate nutrient and pollutant removal limits, pushing industries toward low-phosphate and biodegradable chemicals. Chemicals must comply with REACH and CLP Regulation for classification and labelling. |
| Germany | Enforces stricter chemical compliance under Federal Water Act (WHG), and wastewater is monitored under Abwasserverordnung. Products must meet REACH standards and are subject to UBA eco-labels for eco-friendliness. |
| France | Water discharge limits are governed by the Code de environment. Chemical use in treatment must be declared to French Water Agencies. Biocidal products require registration under (French Agency for Food, Environmental and Occupational Health & Safety. |
| United Kingdom | Post-Brexit alignment with UK REACH and strict adherence to Environmental Permitting Regulations (EPR) for industrial discharge. Chemicals must also meet DEFRA (Department for Environment, Food & Rural Affairs) standards. |
| China | The Water Pollution Prevention and Control Action Plan and Discharge Standard of Pollutants for Municipal Wastewater Treatment Plants (GB 18918-2002) guide chemical use. Mandatory certification via the China National Environmental Product Certification (CNEPC) applies for many treatment additives. |
| Japan | Governed by the Water Pollution Control Law and supplementary guidelines under the Ministry of the Environment. Biocides and specialty chemicals must comply with the Chemical Substances Control Law (CSCL) and receive approval from NITE (National Institute of Technology and Evaluation). |
| South Korea | Overseen by the Water Quality and Aquatic Ecosystem Conservation Act. Chemical manufacturers must register under K-REACH (Korean REACH equivalent) for industry entry and adhere to MOE (Ministry of Environment) guidelines. |
| Australia & New Zealand | Managed under the National Water Quality Management Strategy (NWQMS), which sets water discharge standards. Chemical formulations must align with NICNAS (Australia) or EPA New Zealand for environmental safety compliance. |

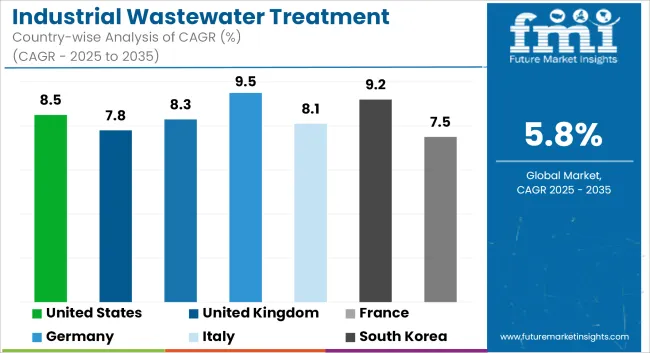
The United States industrial wastewater treatment chemical industry is expected to grow at a CAGR of 8.5% between 2025 and 2035. The USA industry is very attractive due to strict environmental regulation under the Clean Water Act and state-mandated water reuse requirements such as California's Title 22 regulations.
USA industries - particularly manufacturing, oil and gas, and food processing - are increasingly implementing advanced chemical formulations to achieve Zero Liquid Discharge (ZLD) and PFAS (forever chemicals) regulations. The move towards intelligent wastewater monitoring systems and chemical dosing automation is also growing chemical consumption across industrial facilities.
Additionally, the sustained momentum of upgrading outdated water infrastructure using federal support like the Bipartisan Infrastructure Law is building long-term tailwinds for chemical providers.
Pressure from both corporate ESG requirements and federal mandates on sustainability is driving demand for biodegradable and low-toxicity formulations. Chemical producers in the USA are also emphasizing circular economy models, so the nation is a central growth region for innovation in this area. With regulatory momentum, capital investments, and replacement cycles considered, the United States remains a rich ground for premium and performance-oriented wastewater treatment chemicals.
The United Kingdom's industrial wastewater treatment chemicals industry is estimated to grow at a CAGR of 7.8% between 2025 and 2035. The UK industry path is defined by its rigorous regulatory environment post-Brexit, such as UK REACH compliance, which replicates EU chemical regulation with national-level nuance.
Demand is also being further underpinned by continued modernization in wastewater treatment plants across the sectors of pharmaceuticals, food & beverages, and chemicals, all subject to tightening scrutiny by the Environment Agency.
There is also a high growth towards green chemistry solutions in the form of phosphate-free coagulants and biodegradable flocculants, prompted both by regulation and pressure from society to safeguard water bodies. Expansion is further supplemented by the nation's efforts towards CSO reductions and stricter discharge restrictions under the Water Industry National Environment Programme (WINEP).
Industrial customers are proactively implementing precision dosing and intelligent monitoring to maximize the use of chemicals, which positions the UK as a significant industry for high-margin products. Though the industry is mature, the strong rate of replacement of aging systems guarantees constant chemical demand over the decade.
The French industrial wastewater treatment chemical industry is anticipated to develop at a CAGR of 8.3% during the period 2025 to 2035. The emphasis of France on water resource conservation, particularly through the SDAGE regional planning framework, is forcing industries to implement environmentally friendly chemical solutions. Tax incentives for water recycling and water efficiency enhancements by the French government are fueling demand for performance-enhanced treatment chemicals.
Industrial sectors such as automobile, agro-processing, and special chemicals are major drivers for this increasing demand because they are subjected to stricter discharge limits under the Code de environment.
Moreover, France's active role in the EU's "Zero Pollution Action Plan" puts pressure on industries to use low-phosphate and biodegradable substitutes for traditional chemical blends. The industry is also seeing development in specialty chemicals, such as anti-foaming agents and chemicals for membrane cleaning, spurred by growing water reuse plants.
The industry for industrial wastewater treatment chemicals in Germany is estimated to grow with a CAGR of 9.5% during the years 2025 to 2035. Germany has a leadership in industrial water management based on the robust regulatory system, especially the Federal Water Act (WHG) and discharge regulations of Abwasserverordnung that impose strict treatment practices across the board.
The German industry is strongly shifting towards the use of carbon-neutral production of chemicals, with demand for low-energy coagulants and flocculants that conform to national climate policy objectives on the rise. The chemicals, metal, food and beverages, and automotive industries are refitting chemical formulations, as well as dosing systems, to meet EU-wide and federal water discharge regulations.
Circular economy regulations and computerized water treatment control systems are driving the shift from traditional treatment chemicals to multifunctional and biodegradable alternatives. Increasing adoption of AI-based monitoring solutions further underpins demand for matching, precision-grade chemicals. Supported by Germany's strong green technology funding and its drive for EU-compliant water quality, the industry is poised for continued, high-value growth through 2035.
Italy's industrial chemical industry for wastewater treatment is projected to follow a CAGR of 8.1% from 2025 to 2035. Italian industries, such as textiles, tanneries, and food processing facilities, are subjected to stricter national laws under Decree 152/2006 (Consolidated Environmental Act) that regulates water pollution and discharge standards. Expanded regulatory control, particularly in the northern and central sections, is pressuring industrial plants to embrace chemical products that adhere to stringent levels of nutrient and heavy metal elimination.
Italy's efforts to comply with EU deadlines for water recycling, particularly agricultural and urban land use, are encouraging sales for coagulants, flocculants, and corrosion inhibitors suited to membrane-compatible treatments. In addition, industrial operators are increasingly turning to decentralized treatment systems, which use chemical conditioning for stability and efficiency, particularly in water-scarce areas.
South Korea's industrial wastewater treatment chemical industry is expected to expand at a CAGR of 9.2% during the period from 2025 to 2035. Industrial development, particularly in the electronics, semiconductor, petrochemical, and shipbuilding industries, is driving demand for sophisticated chemical treatment systems capable of achieving the high-water purity levels necessary for discharge and reuse. Government-driven strengthening of the Water Quality and Aquatic Ecosystem Conservation Act and efforts to curb microplastics and chemical contamination are redefining procurement strategies.
Companies are increasingly turning towards high-performance chemicals like antiscalants and biocides that can be used with ultra-filtration and reverse osmosis technology. In addition, South Korea's aggressive carbon-neutral plan is encouraging domestic industries to adopt biodegradable and energy-efficient chemical products as alternatives to old-generation products.
Japan's chemical industry for wastewater treatment is forecast to achieve a CAGR of 7.5% from 2025 to 2035. Though Japan has long had strict environmental regulations thanks to its Water Pollution Control Law, a mature industrial base coupled with the high cost of upgrading facilities has created a conservative but consistent demand for wastewater treatment chemicals. The transition to precision dosing systems and membrane treatment plants is promoting the application of high-tech chemical formulations, particularly in food processing, electronics, and heavy industry.
Cost sensitivity and the strong focus on long-life, durable chemicals, however, are keeping the adoption of newer chemical types behind Western industries. Japan's Chemical Substances Control Law (CSCL) also has stringent approval timelines, which delay the introduction of foreign-supplied innovative solutions.
The Chinese industry for industrial wastewater treatment chemicals is predicted to grow at a CAGR of 10.2% from 2025 to 2035. China continues to be the largest growth driver of the global industry due to wide-ranging industrial expansion and strict implementation of the Water Pollution Prevention and Control Action Plan and local GB standards for the discharge of pollutants. Industry sectors like electronics, mining, textiles, and manufacturing are boosting chemical consumption very fast as China gives priority to pollution control and water reuse.
The government's aggressive drive toward closed-loop recycling and water efficiency improvements in industrial areas and megacities is driving high-capacity demand for coagulants, advanced flocculants, anti-scalants, and biocides. China National Environmental Product Certification (CNEPC)-Domestic producers are also realigning with a view to gaining government orders and export approvals.
The Australian and New Zealand industrial wastewater treatment chemical industry is expected to grow at a CAGR of 8.7% from 2025 to 2035. Australia and New Zealand are highly reliant on water-intensive processes such as mining, food processing, and pulp & paper, which are subject to stringent environmental discharge regulations under the National Water Quality Management Strategy (NWQMS).
Regulatory authorities like EPA Victoria in Australia and EPA New Zealand mandate strict guidelines, and chemical producers are expected to adhere to stringent levels of safety, biodegradability, and eco-toxicity. Scarcities of water in industries, particularly in Australian inland industries, are driving investment in sophisticated chemical solutions that facilitate water recycling and Zero Liquid Discharge (ZLD) systems.
The industry also increasingly utilizes intelligent monitoring and exact dosing in order to reduce chemical wastage and decrease the costs of operation. Expansion is supplemented by government funding and incentives towards upgrading water treatment facilities in both countries.
The industrial wastewater treatment chemical market is moderately consolidated with major players including Kemira Oyj, Ecolab Inc., BASF SE, SNF Floerger, Solenis LLC, and DuPont Water Solutions. These companies are investing in product innovation, automation integration, and customized chemical formulations to meet diverse industrial effluent requirements.
Strategic collaborations with industrial utilities, government-backed wastewater projects, and decentralized treatment service providers are helping suppliers enhance their market reach. Sustainability is a key focus, with R&D centered on bio-based coagulants, low-toxicity corrosion inhibitors, and multifunctional blends. Regional players in Asia and Latin America are scaling operations to support fast-growing industrial clusters and compliance with newer effluent discharge norms.
Coagulants Flocculants, Corrosion Inhibitors, Scale Inhibitors, Biocides Disinfectants, Chelating Agents, Anti-foaming Agents, pH Adjusters and Stabilizers, Others
Power Generation, Oil Gas, Mining, Chemical, Food Beverage, Others
North America, Latin America, Europe, South Asia, East Asia, Oceania, The Middle East and Africa (MEA)
Tightening environmental regulations and rising industrial water reuse are boosting chemical consumption globally.
The power generation industry will lead adoption, driven by stricter discharge norms and water recycling needs.
Manufacturers are focusing on bio-based and low-toxicity formulations to meet eco-compliance and circular economy goals.
East Asia is poised for strong expansion, fueled by rapid industrialization and stricter pollutant discharge rules.
Integration with smart monitoring and dosing systems will enhance chemical efficiency and regulatory compliance.


Our Research Products

The "Full Research Suite" delivers actionable market intel, deep dives on markets or technologies, so clients act faster, cut risk, and unlock growth.

The Leaderboard benchmarks and ranks top vendors, classifying them as Established Leaders, Leading Challengers, or Disruptors & Challengers.

Locates where complements amplify value and substitutes erode it, forecasting net impact by horizon

We deliver granular, decision-grade intel: market sizing, 5-year forecasts, pricing, adoption, usage, revenue, and operational KPIs—plus competitor tracking, regulation, and value chains—across 60 countries broadly.

Spot the shifts before they hit your P&L. We track inflection points, adoption curves, pricing moves, and ecosystem plays to show where demand is heading, why it is changing, and what to do next across high-growth markets and disruptive tech

Real-time reads of user behavior. We track shifting priorities, perceptions of today’s and next-gen services, and provider experience, then pace how fast tech moves from trial to adoption, blending buyer, consumer, and channel inputs with social signals (#WhySwitch, #UX).

Partner with our analyst team to build a custom report designed around your business priorities. From analysing market trends to assessing competitors or crafting bespoke datasets, we tailor insights to your needs.
Supplier Intelligence
Discovery & Profiling
Capacity & Footprint
Performance & Risk
Compliance & Governance
Commercial Readiness
Who Supplies Whom
Scorecards & Shortlists
Playbooks & Docs
Category Intelligence
Definition & Scope
Demand & Use Cases
Cost Drivers
Market Structure
Supply Chain Map
Trade & Policy
Operating Norms
Deliverables
Buyer Intelligence
Account Basics
Spend & Scope
Procurement Model
Vendor Requirements
Terms & Policies
Entry Strategy
Pain Points & Triggers
Outputs
Pricing Analysis
Benchmarks
Trends
Should-Cost
Indexation
Landed Cost
Commercial Terms
Deliverables
Brand Analysis
Positioning & Value Prop
Share & Presence
Customer Evidence
Go-to-Market
Digital & Reputation
Compliance & Trust
KPIs & Gaps
Outputs
Full Research Suite comprises of:
Market outlook & trends analysis
Interviews & case studies
Strategic recommendations
Vendor profiles & capabilities analysis
5-year forecasts
8 regions and 60+ country-level data splits
Market segment data splits
12 months of continuous data updates
DELIVERED AS:
PDF EXCEL ONLINE
Bioelectrochemical Systems For Wastewater Treatment Market Size and Share Forecast Outlook 2025 to 2035
Industrial Chemical Packaging Market Size and Share Forecast Outlook 2025 to 2035
Wastewater Treatment Aerators Market Size and Share Forecast Outlook 2025 to 2035
Market Positioning & Share in Industrial Chemical Packaging
Industrial Dust Treatment System Market Size and Share Forecast Outlook 2025 to 2035
Industrial Water Treatment Market Size and Share Forecast Outlook 2025 to 2035
Soil Treatment Chemicals Market
Water Treatment Chemical Market Size and Share Forecast Outlook 2025 to 2035
Algae Treatment Chemical Market Forecast and Outlook 2025 to 2035
Wastewater Heavy Metal Treatment Agent Market Size and Share Forecast Outlook 2025 to 2035
Industrial Grade Electrochemical CO Sensor Market Size and Share Forecast Outlook 2025 to 2035
Sludge Treatment Chemicals Market Growth - Trends & Forecast 2025 to 2035
Surface Treatment Chemicals Market Size and Share Forecast Outlook 2025 to 2035
Water and Wastewater Treatment Equipment Market Size and Share Forecast Outlook 2025 to 2035
Boiler Water Treatment Chemicals Market Size and Share Forecast Outlook 2025 to 2035
Industrial and Institutional Cleaning Chemical Market Analysis - Size, Share, and Forecast Outlook 2025 to 2035
Cooling Water Treatment Chemicals Market Growth - Trends & Forecast 2025 to 2035
Industrial and Institutional Hand Hygiene Chemicals Market - Trends & Forecast 2025 to 2035
Concrete Surface Treatment Chemicals Market Size and Share Forecast Outlook 2025 to 2035
Advanced Surface Treatment Chemicals Market Analysis by Chemical, Surface, End-Use Industry and Region: Forecast from 2025 to 2035

Thank you!
You will receive an email from our Business Development Manager. Please be sure to check your SPAM/JUNK folder too.
Chat With
MaRIA