The global industrial tubes market is expected to grow from USD 701.8 billion in 2025 to USD 1.52 trillion by 2035, expanding at a CAGR of 7.7% over the forecast period. North America and Asia Pacific are the leading regions, driven by massive infrastructure projects, energy diversification, and industrial expansion. Steel remains the preferred material due to its affordability and tensile strength, with seamless tubes gaining importance for high-pressure applications in the oil & gas and petrochemical sectors.
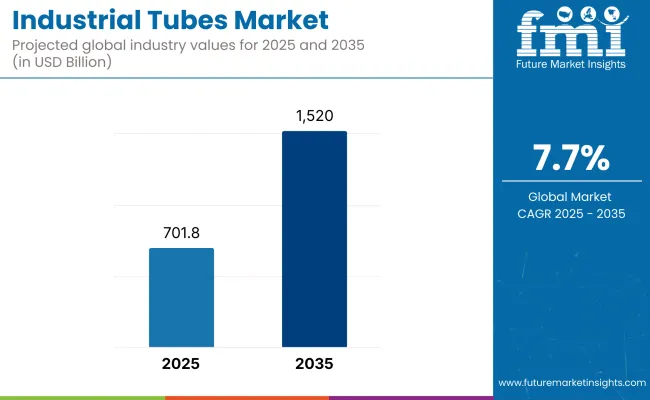
Key drivers for this growth include a global push toward infrastructure modernization, electrification in automotive manufacturing, and increasing demand for high-performance tubing in aerospace, chemical, and mechanical engineering. Lightweight materials such as aluminum are gaining momentum in electric vehicles (EVs), while advanced coatings and composite solutions are becoming popular for durability and corrosion resistance.
However, the industry is challenged by rising raw material costs, regulatory complexities, and fragmented global supply chains.
Looking ahead, manufacturers are increasingly investing in automation, AI-enabled quality control, and sustainability-compliant materials. The market is also shifting toward recyclable and low-carbon tubing in response to ESG mandates, particularly in Western Europe.
Strategic partnerships, supply chain diversification, and digitized production are key imperatives. Countries like China and India will lead in high-volume production, while Japan and Germany will focus on precision and advanced alloy tubing. The next decade will be shaped by region-specific strategies that balance performance, cost-efficiency, and regulatory alignment.
Moreover, policy-driven investments and industrial incentive schemes are expected to further accelerate market growth across both developed and emerging economies. The USA Infrastructure Investment and Jobs Act (IIJA), China's Made in China 2025 strategy, and the EU’s Green Deal are catalyzing large-scale adoption of next-generation tubing technologies.
These include smart tubing integrated with IoT sensors for predictive maintenance and corrosion monitoring. At the same time, demand for modular and multi-use tubing is rising to support the dynamic needs of sectors like renewable energy, EV manufacturing, and high-tech fabrication. As a result, companies that can deliver both volume scalability and material innovation will be best positioned to lead in this highly competitive and rapidly evolving industrial landscape.
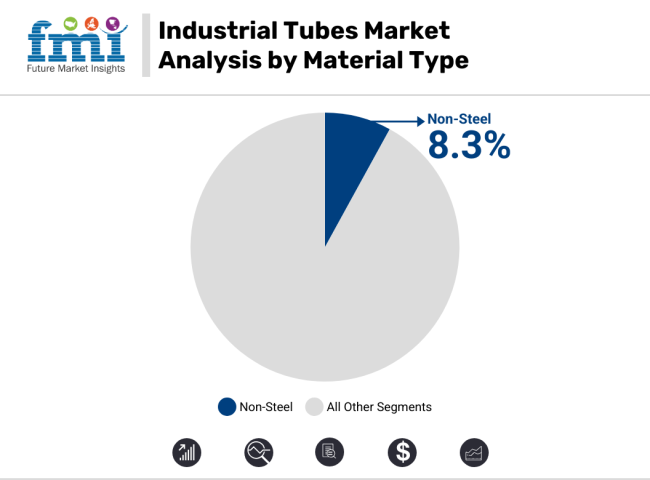
Steel will continue to dominate the industrial tubes market from 2025 to 2035, thanks to its high tensile strength, thermal resistance, and affordability. Its widespread use in oil & gas pipelines, construction scaffolding, automotive frames, and industrial machinery makes it indispensable across heavy industries.
However, aluminum and other non-steel alternatives-like composites and copper-are gaining traction, especially in electric vehicles, aerospace, and renewable energy projects where weight reduction and corrosion resistance are paramount.
Europe is witnessing a shift toward green steel due to stringent ESG norms, while Asia prefers cost-efficient carbon steel. The growing need for lightweight yet high-performance materials will drive up the use of non-steel tubes, especially in EV cooling systems and solar structures.
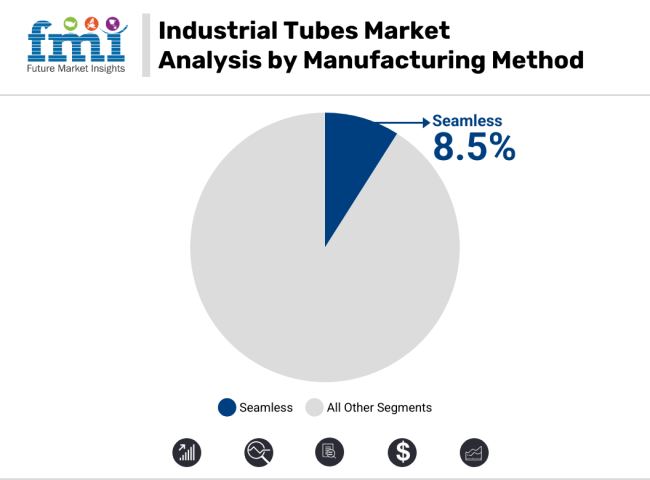
Welded tubes currently account for a significant share due to cost-effectiveness, ease of production, and broad utility in construction, mechanical engineering, and automotive applications. However, seamless tubes are forecast to grow faster, driven by their superior mechanical strength, high-pressure resistance, and integrity in harsh environments.
Seamless tubes are increasingly used in oil & gas drilling, petrochemical refining, and aerospace hydraulic systems, where failure risk must be minimized. Innovations in extrusion and rotary piercing methods, coupled with digitized quality control, are improving seamless tube yield and dimensional precision. As offshore exploration and chemical processing industries demand higher reliability, seamless tubes are poised to outpace welded variants.
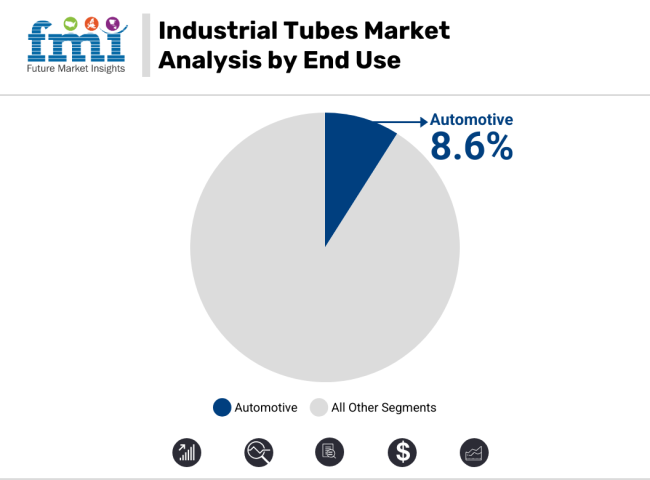
The oil & gas and petrochemical sectors will remain the largest consumers of industrial tubes, especially seamless and corrosion-resistant varieties for pipeline transport, offshore rigs, and refinery applications. However, the automotive sector is set to be the fastest-growing segment, driven by the rapid shift toward electric and hybrid vehicles.
EV platforms require lightweight, high-strength tubes for battery cooling systems, fluid transfer, structural reinforcements, and hydrogen fuel storage. Regulatory pressure to reduce vehicular emissions is pushing OEMs to replace traditional steel with aluminum and composite tubing. Meanwhile, mechanical & engineering industries will drive demand for precision-engineered tubes in robotics, automation, and industrial equipment.
The industrial tubes industry is developing at a rapid pace. The industry is fuelled by factors such as increasing demand from energy, construction, and automotive industries, with a 7.7% CAGR up to 2035. Major gainers are producers of high-performance and sustainable tubing solutions, especially in Asia and North America, while raw material shortage-hit regions could be impacted. Firms that invest in automation and green materials are likely to have a competitive advantage as infrastructure upgrades and electrification trends gain momentum worldwide.
Invest in Advanced Manufacturing & Automation
Executives should prioritize automation and precision engineering in tube manufacturing to enhance efficiency, reduce costs, and improve product consistency. Investing in smart factories and AI-driven quality control can help companies scale production while maintaining high standards.
Align with Sustainability & Regulatory Trends
With rising demand for eco-friendly materials, companies must develop recyclable and low-emission industrial tubes. Strengthening compliance with global carbon reduction policies and leveraging green manufacturing incentives will be key to gaining a competitive advantage.
Expand Strategic Partnerships & Supply Chain Resilience
To mitigate risks from raw material shortages and geopolitical disruptions, firms should diversify supplier networks and form alliances with regional distributors. Exploring vertical integration or M&A opportunities in key growth markets like Asia and Africa can ensure long-term stability and industry expansion.
| Risk | Probability & Impact |
|---|---|
| Raw Material Price Volatility | High probability - Increased production costs and margin pressures |
| Supply Chain Disruptions | Medium-High probability - Delays in manufacturing & project timelines |
| Regulatory & ESG Compliance | Medium probability - Potential fines, industry restrictions, and loss of eco-conscious customers |
| Priority | Immediate Action |
|---|---|
| Supply Chain Resilience | Assess and diversify raw material sourcing to mitigate price volatility. |
| Sustainability & ESG Compliance | Conduct lifecycle analysis and invest in low-carbon tube manufacturing. |
| Industry Expansion & Partnerships | Identify strategic M&A or joint ventures in high-growth regions. |
To stay competitive, the companies must speed up automation investments, broaden raw material sourcing, and align with sustainability requirements. This insight foresees a shift to high-performance, environmentally friendly tubing and robust supply chains, necessitating immediate actions on strategic partnerships and regional presence. Highlights for a flexible roadmap may be to be recognized for M&A in high-growth industries, embedding ESG compliance throughout the business, and digitizing manufacturing to maintain the momentum achieved and not get disrupted by the industry.
Future Market Insights Survey with Industrial Tubes Market Stakeholders
(Surveyed Q4 2024, n=500 stakeholder participants across manufacturers, distributors, and industrial buyers in the USA, Western Europe, China, India, and Japan.)
Global Priorities
Regional Variance
High Variance in Automation & Smart Tubing
Return on Investment (ROI) Perspective
Global Consensus
Regional Variance
Price Sensitivity Trends
Manufacturers
Distributors
End-Users (Industrial Buyers)
Alignment in Investment Areas
Regional Variances
Regulatory & ESG Impact
Global Consensus
Key Variances
A regionalized approach is crucial-companies must tailor product offerings to cost-driven, sustainability-led, or automation-focused industries to succeed.
| Country/Region | Policies, Regulations & Mandatory Certifications |
|---|---|
| United States | Infrastructure Investment and Jobs Act (IIJA) driving demand for industrial tubing in construction and energy sectors. - The Buy America Act mandates domestic sourcing for federally funded projects. - OSHA & ASME Standards (e.g., ASME B31 for pressure piping) required for compliance. |
| European Union | EU Green Deal & Carbon Border Adjustment Mechanism (CBAM) imposing strict sustainability regulations on steel and aluminium tubing. - CE Marking is required for industrial tubes used in construction and manufacturing. - EN 10255 & EN 10219 standards regulate tube specifications for structural and pressure applications. |
| China | Made in China 2025 policy supports domestic industrial tubing production with subsidies for high-tech and sustainable materials. - GB/T Standards (e.g., GB/T 9711 for pipeline tubes) mandatory for local and export industries. - Environmental Protection Law imposing stricter emissions controls on steel and aluminium manufacturing. |
| India | National Steel Policy 2017 promoting self-sufficiency in tube manufacturing and raw material sourcing. - BIS Certification (IS 1239 & IS 1161) is mandatory for industrial tubes in construction and infrastructure. PLI Scheme for Specialty Steel offering financial incentives for advanced and sustainable tube production. |
| Japan | JIS Standards (Japanese Industrial Standards) (e.g., JIS G3444 for carbon steel tubes) required for manufacturing compliance. - Energy Efficiency Act pushing companies toward low-emission and high-efficiency tubing solutions. - Building Standards Act requiring certified materials for infrastructure and industrial projects. |
| South Korea | Green New Deal Policies encouraging sustainable tube production through tax incentives and R&D grants. - KS Standards (Korean Standards, e.g., KS D3566 for steel tubes) required for compliance. - Strict Import Regulations for non-certified foreign tubing products. |
| Brazil | ABNT Standards (e.g., ABNT NBR 5590 for steel tubes) regulate industrial tubing specifications. - Government Infrastructure Programs increasing demand for locally produced tubes in oil & gas projects. - Mercosur Trade Agreements influencing import/export duties on industrial tubes. |
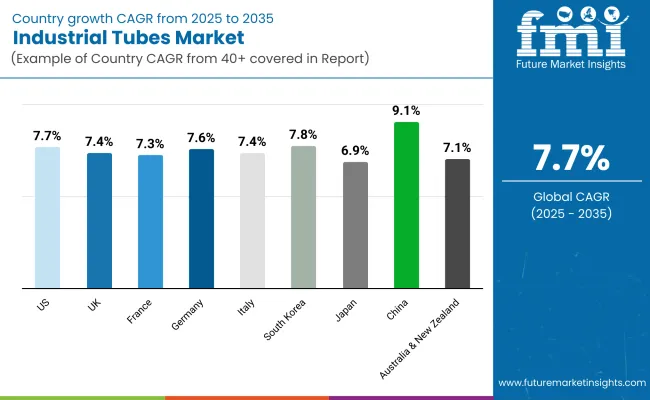
The USA industry for industrial tubes is projected to grow at a significant pace during 2025 to 2035, surpassing the overall global average of 7.7%. Infrastructure Investment and Jobs Act (IIJA) is a key driver of growth, investing money into construction, oil & gas pipelines, and transport infrastructure.
Growing offshore wind and renewable energy investment is also fuelling demand for corrosion-resistant and high-performance tubes. Domestic production incentives from the Buy America Act are increasing local manufacturing and decreasing dependence on imports.
FMI opines that the United States industrial tube sales will grow at nearly 8.2% CAGR through 2025 to 2035.
The UK industrial tubes industry is expected to expand rapidly by 2035. Supply chain vagaries, following post-Brexit trade policies, are dampening expansion, but higher infrastructure modernization and renewable energy investments are supporting demand.
The Net Zero Strategy is compelling the use of low-carbon steel and aluminium tubes, while offshore wind facilities are driving corrosion-resistant tubing demand. The requirement for CE marking continues to be obligatory for construction and energy sector compliance. Increased labour costs and steel import tariffs may restrict the industry growth.
FMI opines that the United Kingdom industrial tube sales will grow at nearly 7.4% CAGR through 2025 to 2035.
The State-led programs such as the France 2030 Industrial Investment Plan are fueling transportation, aerospace, and defence industries' industrial tube demand in France. Carbon neutrality by 2050 for France is influencing the use of green steel and aluminium tubing in the construction and auto industries.
The EU Carbon Border Adjustment Mechanism (CBAM) will have an effect on steel imports, pushing local manufacturers to embrace low-emission manufacturing processes. The nuclear power industry, a key stimulus for high-performance tubes, is seeing new investment, further solidifying industry potential.
FMI opines that France's industrial tube sales will grow at nearly 7.3% CAGR through 2025 to 2035.
Germany is one of the top European manufacturing centres, there is high demand for precision and high-performance tubing in automotive, industrial machinery, and construction industries.
The EU Green Industrial Plan and Germany's Hydrogen Strategy are major drivers for advanced alloy and stainless steel tubing used in hydrogen transportation and storage. Germany has been at the forefront of robotic welding and tube processing automation, which improves productivity and minimizes labour dependency.
FMI opines that Germany's industrial tube sales will grow at nearly 7.6% CAGR through 2025 to 2035.
Italy's industrial tubes industry shall develop at a CAGR of 7.4% during 2025 to 2035, marginally lower than the international rate. Italy is a significant world exporter of precision steel and aluminium tubes, especially for automotive, construction, and energy industries. Italy's PNRR (National Recovery and Resilience Plan) is investing predominantly in smart manufacturing and infrastructure, stimulating demand for structural and pipeline tubing.
Energy prices and supply chain disruptions are major challenges, though, since Italy is heavily dependent on imported raw materials. The transition towards electric vehicles (EVs) is also affecting demand, with lightweight aluminium tubing becoming more prevalent. Italian producers are prioritizing sustainable manufacturing practices to comply with EU environmental regulations.
FMI opines that Italy’s industrial tube sales will grow at nearly 7.3% CAGR through 2025 to 2035.
The industrial tubes industry in South Korea is driven by high demand across the shipbuilding, automotive, and semiconductor sectors. The Korean Green New Deal is pushing investments in carbon-free steel and high-aluminium alloy production, and the hydrogen economy roadmap is boosting demand for high-pressure tubing for clean hydrogen transportation and storage.
South Korea is at the forefront of developing automated and robotic tube processing, which maximizes manufacturing efficiency. The KS standards (Korean Standards, e.g., KS D3566 for steel tubes) verify quality and safety compliance. Though rising energy prices and international trade tensions threaten growth, the government's initiative to upgrade infrastructure is a major opportunity for the tubing industry.
FMI opines that South Korean industrial tube sales will grow at nearly 7.8% CAGR through 2025 to 2035.
Japan’s industrial tubes sector has been expanding. The nation has expertise in precision, corrosion-resistant tubing for the electronics, aerospace, and nuclear power industries. The Energy Efficiency Act is propelling demand for lightweight aluminium and composite tubing in equipment for industry and transport. However, the country is constrained by high labour costs and an ageing population, which puts a ceiling on production capacity.
JIS standards (for example, JIS G3444 for carbon steel tubes) guarantee product quality but contribute to higher manufacturing cost. Emphasis on smart factories and AI-based processing of tubes is enabling Japanese manufacturers to remain competitive in overseas industrs.
FMI opines that Japan's industrial tube sales will grow at nearly 6.9% CAGR through 2025 to 2035.
China's industrial tube industry is driven by huge infrastructure development and industrialization. Domestic tube production is supported by the Made in China 2025 policy, with subsidies for high-end steel and aluminium production by the government. Industry specifications are governed by the GB/T standards (such as GB/T 9711 for pipeline tubes).
China excels in robotic welding and artificial intelligence-driven quality monitoring, enhancing the efficiency of high-volume production. Export bans and environmental laws with the Dual Carbon Strategy are stimulating a move to low-carbon and recyclable materials.
FMI opines that the China industrial tube sales will grow at nearly 9.1% CAGR through 2025 to 2035.
The Australian and New Zealand industrial tubes industry is spurred by investments in mining, energy, and construction. Demand is rising for structural and pipeline tubing for LNG and water transportation due to Australia's infrastructure pipeline projects. NZ's sustainability initiatives are driving demand for reusable aluminium and steel tubes.
However, both nations depend significantly on Chinese, USA, and European imports, and so are susceptible to supply chain problems. Use locally is only permissible if the material complies with AS/NZS standards (such as AS 1074 for steel tubes). The Australian transition towards hydrogen energy schemes is opening up new ies for industrial tubing of high performance.
FMI found that the Australia-NZ industrial tube sales will grow at nearly 7.1% CAGR through 2025 to 2035.
The industrial tube industry is moderately fragmented. It is led by established industry participants along with new entrants. Most have been implementing strategic pricing, innovation, partnerships, and expansion initiatives to keep up with top companies.
In November 2024, Vallourec, a French steel tube manufacturer, declared it would pay its first 10-year dividend after slashing net debt to €240M from €1.49B within two years. It also signed major contracts with TotalEnergies, Petrobras and Eneva, and closed its first acquisition since 2016.
Steel and non-steel
Wired and seamless
Oil & gas petrochemical, automotive, mechanical & engineering, chemical and others
North America, Latin America, Western Europe, Eastern Europe, South Asia and Pacific, East Asia and Middle East and Africa
Growing infrastructure, energy transition, automation, and lightweight material adoption are major factors.
Oil & gas, automotive, mechanical engineering, chemical processing, and renewable energy sectors lead usage.
Advancements in automation, corrosion-resistant coatings, and precision manufacturing are enhancing efficiency.
Raw material costs, regulatory compliance, and supply chain disruptions impact production and distribution.
High-strength steel, aluminium, composites, and nickel alloys are increasingly preferred for durability and performance.


Full Research Suite comprises of:
Market outlook & trends analysis
Interviews & case studies
Strategic recommendations
Vendor profiles & capabilities analysis
5-year forecasts
8 regions and 60+ country-level data splits
Market segment data splits
12 months of continuous data updates
DELIVERED AS:
PDF EXCEL ONLINE
Industrial Precision Oven Market Size and Share Forecast Outlook 2025 to 2035
Industrial Water Chiller for PCB Market Size and Share Forecast Outlook 2025 to 2035
Industrial & Commercial HVLS Fans Market Size and Share Forecast Outlook 2025 to 2035
Industrial Robot Controller Market Size and Share Forecast Outlook 2025 to 2035
Industrial Wired Routers Market Size and Share Forecast Outlook 2025 to 2035
Industrial Evaporative Condensers Market Size and Share Forecast Outlook 2025 to 2035
Industrial Energy Management System Market Size and Share Forecast Outlook 2025 to 2035
Industrial Insulation Market Size and Share Forecast Outlook 2025 to 2035
Industrial Safety Gloves Market Size and Share Forecast Outlook 2025 to 2035
Industrial Cleaner Market Size and Share Forecast Outlook 2025 to 2035
Industrial Dust Treatment System Market Size and Share Forecast Outlook 2025 to 2035
Industrial Vertical Washing Tower Market Size and Share Forecast Outlook 2025 to 2035
Industrial Pepper Market Size and Share Forecast Outlook 2025 to 2035
Industrial Electronics Packaging Market Forecast and Outlook 2025 to 2035
Industrial Absorbent Market Forecast and Outlook 2025 to 2035
Industrial Furnace Industry Analysis in Europe Forecast and Outlook 2025 to 2035
Industrial Denox System Market Size and Share Forecast Outlook 2025 to 2035
Industrial Electronic Pressure Switch Market Size and Share Forecast Outlook 2025 to 2035
Industrial WiFi Module Market Size and Share Forecast Outlook 2025 to 2035
Industrial Security System Market Forecast Outlook 2025 to 2035

Thank you!
You will receive an email from our Business Development Manager. Please be sure to check your SPAM/JUNK folder too.
Chat With
MaRIA