The global industrial paper sacks market is valued at USD 6.8 billion in 2025 and is set to reach USD 13.3 billion by 2035, recording an absolute increase of USD 6.4 billion over the forecast period. This translates into a total growth of 94.1%, with the market forecast to expand at a compound annual growth rate (CAGR) of 6.9% between 2025 and 2035.
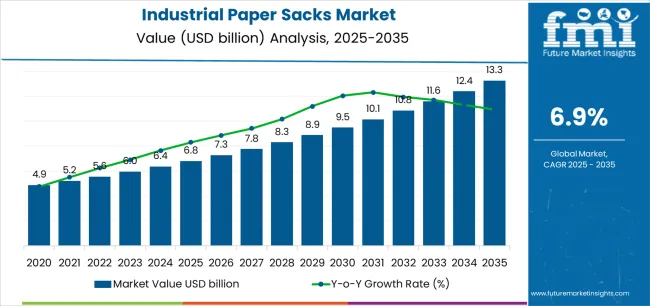
FMI’s industry-backed packaging intelligence, used across supply chain and sustainability frameworks, shows that the overall market size is expected to grow by approximately 1.9X during the same period, supported by increasing demand for recyclable packaging solutions, growing adoption of moisture-resistant containers, and rising requirements for cost-effective bulk packaging across cement, agricultural feed, chemical, and food ingredient sectors.
Between 2025 and 2030, the industrial paper sacks market is projected to expand from USD 6.8 billion to USD 9.4 billion, resulting in a value increase of USD 2.6 billion, which represents 40.6% of the total forecast growth for the decade.
This phase of development will be shaped by increasing demand for heavy-duty packaging solutions, rising bulk material handling patterns enabling efficient storage formats, and growing availability of advanced kraft paper manufacturing technologies across commercial bagging operations and specialty container production facilities.
Between 2030 and 2035, the market is forecast to grow from USD 9.4 billion to USD 13.3 billion, adding another USD 3.8 billion, which constitutes 59.4% of the overall ten-year expansion. This period is expected to be characterized by the advancement of high-strength formulations, the integration of barrier coating technologies for moisture protection, and the development of premium valve closure systems across diverse packaging categories.
The growing emphasis on circular economy principles and paper recycling infrastructure will drive demand for advanced sack varieties with enhanced tensile properties, improved environmental credentials, and superior functionality characteristics.
Between 2020 and 2024, the industrial paper sacks market experienced robust growth, driven by increasing user demand for biodegradable packaging formats and growing recognition of paper sacks' effectiveness in supporting safe bulk material storage across construction and agricultural sectors.
The market developed as businesses recognized the potential for industrial paper sacks to deliver structural integrity while meeting modern requirements for tear resistance properties and cost-effective production patterns.
Technological advancement in paper manufacturing and lamination practices began emphasizing the critical importance of maintaining load-bearing performance while enhancing fill speed efficiency and improving material utilization.
From 2030 to 2035, the market is forecast to grow from USD 9.4 billion to USD 13.3 billion, adding another USD 3.8 billion, which constitutes 59.4% of the overall ten-year expansion. This period is expected to be characterized by the advancement of integrated valve designs, the integration of tear-resistant reinforcement layers for material handling protection, and the development of specialized barrier treatments for moisture-sensitive applications.
The growing emphasis on packaging functionality and manufacturing precision will drive demand for premium varieties with enhanced puncture resistance credentials, improved chemical compatibility options, and superior performance characteristics.
Between 2020 and 2024, the industrial paper sacks market experienced significant growth, driven by increasing awareness of compostable packaging benefits and growing recognition of paper sacks' effectiveness in supporting efficient palletization operations across distribution segments and industrial applications.
The market developed as users recognized the potential for industrial paper sacks to deliver economic advantages while meeting modern requirements for stacking stability and reliable closure practices. Technological advancement in printing technologies and quality control systems began emphasizing the critical importance of maintaining dimensional accuracy while extending product shelf life capabilities and improving customer satisfaction across diverse bulk packaging categories.
| Metric | Value |
|---|---|
| Estimated Value in (2025E) | USD 6.8 billion |
| Forecast Value in (2035F) | USD 13.3 billion |
| Forecast CAGR (2025 to 2035) | 6.90% |
Market expansion is being supported by the increasing global demand for environmentally-preferable packaging solutions and the corresponding shift toward renewable containers that can provide superior bulk handling characteristics while meeting user requirements for product protection and material-efficient production processes.
Modern businesses are increasingly focused on incorporating packaging formats that can enhance warehouse efficiency while satisfying demands for consistent, reliably performing containers and optimized material flow practices. Industrial paper sacks' proven ability to deliver mechanical strength, breathability properties, and diverse application possibilities makes them essential packaging for building materials manufacturers and quality-conscious industrial suppliers.
The growing emphasis on cost-effective bulk packaging and production scalability is driving demand for high-performance industrial paper sack systems that can support distinctive product positioning and comprehensive brand differentiation across cement products, animal feed, and chemical powder categories.
User preference for containers that combine functional excellence with manufacturing flexibility is creating opportunities for innovative implementations in both traditional and emerging industrial packaging applications. The rising influence of automated filling systems and modern warehouse infrastructure is also contributing to increased adoption of industrial paper sacks that can provide authentic performance benefits and reliable supply characteristics.
The market is segmented by product type, closure type, capacity, end-use application, and region. By product type, the market is divided into multi-ply paper sacks, single-ply paper sacks, gusseted paper sacks, and pinch bottom sacks. Based on closure type, the market is categorized into open mouth sacks, valve sacks, pasted valve sacks, and sewn open mouth sacks.
By capacity, the market includes up to 25 kg, 25-50 kg, and above 50 kg. By end-use application, the market encompasses building & construction, agriculture & animal feed, chemicals & fertilizers, food ingredients, and other applications. Regionally, the market is divided into North America, Europe, Asia Pacific, Latin America, Middle East & Africa, and other regions.
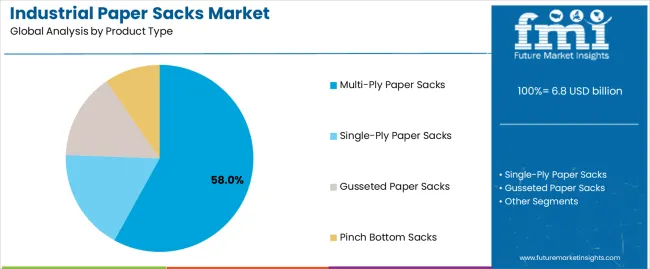
The multi-ply paper sacks segment is projected to account for 58% of the industrial paper sacks market in 2025, reaffirming its position as the leading product category. Businesses and packaging facilities increasingly utilize multi-ply paper sacks for their superior strength characteristics, established load-bearing efficiency, and essential functionality in heavy-duty packaging applications across multiple material categories.
Multi-ply paper sacks' standardized manufacturing characteristics and proven durability directly address user requirements for reliable bulk packaging and optimal material handling value in industrial applications.
This product segment forms the foundation of modern industrial paper sack production patterns, as it represents the format with the greatest commercial scalability potential and established compatibility across multiple filling systems.
Business investments in layer optimization and tensile enhancement continue to strengthen adoption among performance-conscious manufacturers. With users prioritizing load capacity and puncture resistance, multi-ply paper sacks align with both economic objectives and performance requirements, making them the central component of comprehensive bulk packaging strategies.
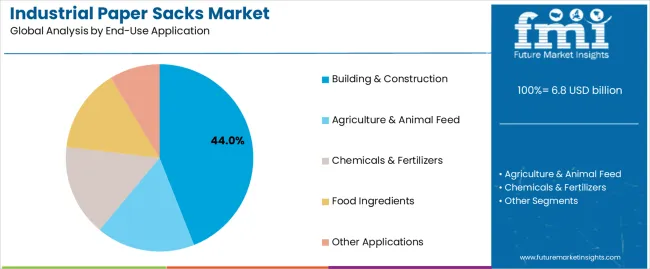
Building & construction is projected to represent 44% of the industrial paper sacks market in 2025, underscoring its critical role as the primary application for quality-focused businesses seeking superior material containment benefits and enhanced handling convenience credentials.
Commercial users and cement manufacturers prefer building & construction applications for their established bulk handling patterns, proven jobsite acceptance, and ability to maintain exceptional moisture barrier profiles while supporting versatile material offerings during diverse construction experiences. Positioned as essential applications for discerning material suppliers, building & construction offerings provide both market penetration excellence and material positioning advantages.
The segment is supported by continuous improvement in kraft paper technology and the widespread availability of established technical specifications that enable construction material compliance and premium positioning at the contractor level. Additionally, bagging companies are optimizing sack designs to support material differentiation and competitive pricing strategies.
As packaging technology continues to advance and contractors seek convenient handling formats, building & construction applications will continue to drive market growth while supporting brand recognition and customer loyalty strategies.
The industrial paper sacks market is advancing rapidly due to increasing packaging efficiency consciousness and growing need for biodegradable container choices that emphasize superior material performance outcomes across construction segments and agricultural applications. The market faces challenges, including competition from synthetic packaging materials, moisture sensitivity limitations, and raw material price volatility affecting production economics. Innovation in barrier coating integration and advanced manufacturing systems continues to influence market development and expansion patterns.
The growing adoption of industrial paper sacks in cement packaging and agricultural feed handling is enabling businesses to develop distribution patterns that provide distinctive material protection benefits while commanding contractor acceptance positioning and enhanced handling characteristics. Construction applications provide superior breathability properties while allowing more sophisticated stacking features across various material categories. Users are increasingly recognizing the functional advantages of paper sack positioning for premium bulk material protection and efficiency-conscious logistics integration.
Modern industrial paper sack manufacturers are incorporating advanced barrier coating technologies, moisture-resistant treatments, and specialized liner systems to enhance material protection credentials, improve weather resistance outcomes, and meet commercial demands for reliable bulk packaging solutions. These systems improve storage effectiveness while enabling new applications, including outdoor storage capability and extended shelf life programs. Advanced barrier integration also allows manufacturers to support performance leadership positioning and specification compliance beyond traditional packaging operations.
| Country | CAGR (2025-2035) |
|---|---|
| USA | 6.1 |
| Germany | 6.4 |
| UK | 5.8 |
| China | 8.3 |
| Japan | 5.5 |
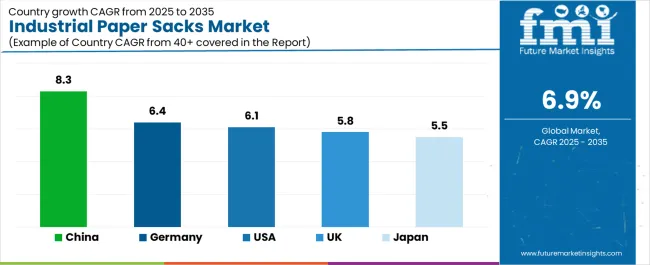
The industrial paper sacks market is experiencing robust growth globally, with China leading at an 8.3% CAGR through 2035, driven by the expanding construction industry, growing agricultural production, and increasing adoption of bulk material handling solutions.
The USA follows at 6.1%, supported by rising construction activity trends, expanding warehouse infrastructure, and growing acceptance of renewable packaging solutions. Germany shows growth at 6.4%, emphasizing established paper manufacturing capabilities and comprehensive packaging development. The UK records 5.8%, focusing on construction material packaging and distribution expansion. Japan demonstrates 5.5% growth, prioritizing quality packaging solutions and technological advancement.
The report covers an in-depth analysis of 40+ countries, the top-performing countries are highlighted below.
Revenue from industrial paper sacks consumption and sales in the USA is projected to exhibit exceptional growth with a CAGR of 6.1% through 2035, driven by the country's rapidly expanding construction sector, favorable contractor attitudes toward recyclable packaging, and initiatives promoting material handling optimization across major production regions.
The USA's position as a leading building materials market and increasing focus on renewable packaging development are creating substantial demand for high-quality industrial paper sacks in both commercial and specialty markets. Major cement manufacturers and agricultural feed producers are establishing comprehensive bagging capabilities to serve growing demand and emerging market opportunities.
Revenue from industrial paper sacks products in Germany is expanding at a CAGR of 6.4%, supported by rising packaging sophistication, growing chemical industry requirements, and expanding bagging infrastructure. The country's developing paper recycling capabilities and increasing commercial investment in advanced manufacturing are driving demand for industrial paper sacks across both imported and domestically produced applications.
International packaging companies and domestic converters are establishing comprehensive operational networks to address growing market demand for quality industrial paper sacks and efficient bulk container solutions.
Revenue from industrial paper sacks products in the UK is projected to grow at a CAGR of 5.8% through 2035, supported by the country's mature construction market, established distribution culture, and leadership in packaging specifications.
Britain's sophisticated supply chain infrastructure and strong support for paper recycling are creating steady demand for both traditional and innovative industrial paper sack varieties. Leading building material brands and specialty converters are establishing comprehensive operational strategies to serve both domestic markets and growing export opportunities.
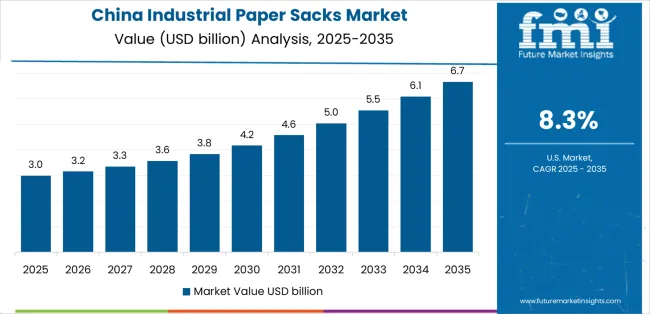
Revenue from industrial paper sacks products in China is projected to grow at a CAGR of 8.3% through 2035, driven by the country's emphasis on construction expansion, manufacturing leadership, and sophisticated production capabilities for containers requiring specialized paper varieties.
Chinese manufacturers and distributors consistently seek commercial-grade packaging that enhances material differentiation and supports construction operations for both traditional and innovative bulk material applications. The country's position as an Asian manufacturing leader continues to drive innovation in specialty industrial paper sack applications and commercial production standards.
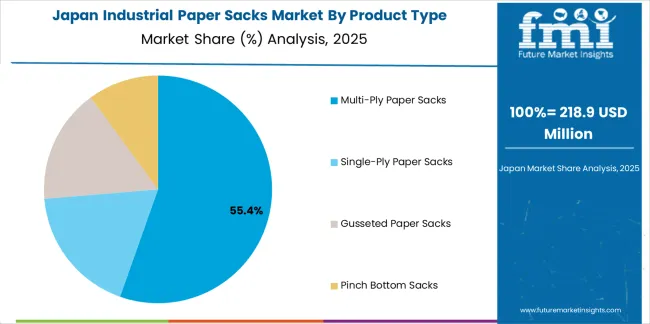
Revenue from industrial paper sacks products in Japan is projected to grow at a CAGR of 5.5% through 2035, supported by the country's emphasis on quality manufacturing, packaging standards, and advanced technology integration requiring efficient bulk container solutions.
Japanese businesses and industrial brands prioritize material performance and manufacturing precision, making industrial paper sacks essential packaging for both traditional and modern material handling applications. The country's comprehensive quality excellence and advancing packaging patterns support continued market expansion.
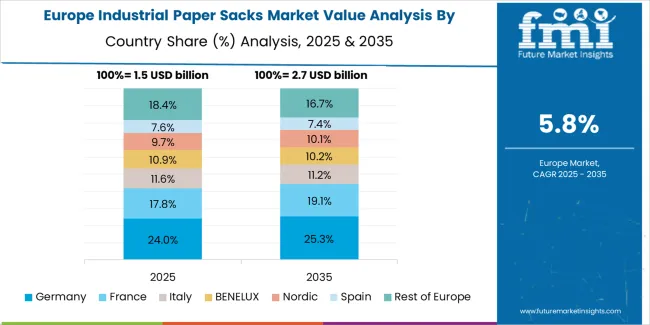
The Europe industrial paper sacks market is projected to grow from USD 2.3 billion in 2025 to USD 4.5 billion by 2035, recording a CAGR of 6.8% over the forecast period. Germany leads the region with a 39% share in 2025, moderating slightly to 38.5% by 2035, supported by its strong paper manufacturing base and demand for premium, technically advanced bulk packaging products. The United Kingdom follows with 19% in 2025, easing to 18.5% by 2035, driven by a sophisticated construction market and emphasis on recycling and material efficiency standards.
France accounts for 16.5% in 2025, rising to 17% by 2035, reflecting steady adoption of high-strength packaging solutions and logistics optimization. Italy holds 12% in 2025, expanding to 12.5% by 2035 as construction material innovation and specialty container applications grow.
Spain contributes 8% in 2025, growing to 8.5% by 2035, supported by expanding agricultural sector and bulk material handling. The Nordic countries rise from 3.5% in 2025 to 3.7% by 2035 on the back of strong paper recycling adoption and advanced kraft paper technologies. BENELUX remains at 2% share across both 2025 and 2035, reflecting mature, efficiency-focused markets.
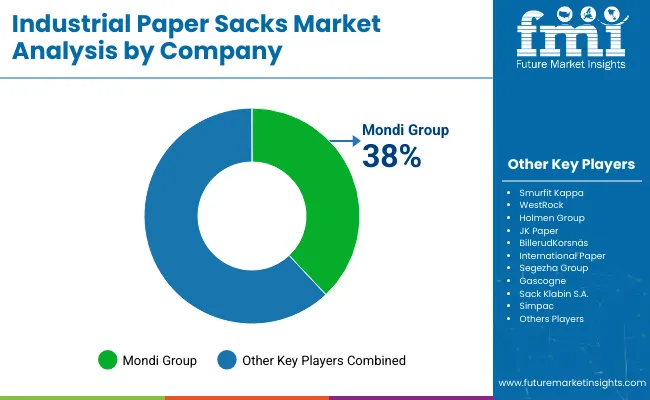
The industrial paper sacks market is characterized by competition among established paper packaging manufacturers, specialized converter operations, and integrated material solution companies. Companies are investing in kraft paper technologies, advanced lamination systems, product innovation capabilities, and comprehensive distribution networks to deliver consistent, high-quality, and reliable industrial paper sack systems.
Innovation in strength enhancement, barrier coating methods, and application-specific product development is central to strengthening market position and customer satisfaction.
Mondi Group leads the market with a strong focus on paper packaging innovation and comprehensive industrial paper sack solutions, offering commercial bulk container systems with emphasis on manufacturing excellence and technological heritage.
Smurfit Kappa provides specialized packaging capabilities with a focus on European market applications and material engineering networks. WestRock Company delivers integrated paper packaging solutions with a focus on construction material positioning and operational efficiency.
Segezha Group specializes in comprehensive kraft paper manufacturing with an emphasis on commercial applications. Hood Packaging Corporation focuses on comprehensive industrial and agricultural containers with advanced design and premium positioning capabilities.
The success of industrial paper sacks in meeting commercial bulk packaging demands, contractor-driven handling requirements, and performance integration will not only enhance material protection outcomes but also strengthen global paper packaging manufacturing capabilities.
It will consolidate emerging regions' positions as hubs for efficient container production and align advanced economies with commercial bulk packaging systems. This calls for a concerted effort by all stakeholders - governments, industry bodies, manufacturers, distributors, and investors. Each can be a crucial enabler in preparing the market for its next phase of growth.
| Items | Values |
|---|---|
| Quantitative Units (2025) | USD 6.8 billion |
| Product Type | Multi-Ply Paper Sacks, Single-Ply Paper Sacks, Gusseted Paper Sacks, Pinch Bottom Sacks |
| Closure Type | Open Mouth Sacks, Valve Sacks, Pasted Valve Sacks, Sewn Open Mouth Sacks |
| Capacity | Up to 25 kg, 25-50 kg, Above 50 kg |
| End-Use Application | Building & Construction, Agriculture & Animal Feed, Chemicals & Fertilizers, Food Ingredients, Other Applications |
| Regions Covered | North America, Europe, Asia Pacific, Latin America, Middle East & Africa, Other Regions |
| Countries Covered | United States, Germany, United Kingdom, China, Japan, and 40+ countries |
| Key Companies Profiled | Mondi Group, Smurfit Kappa, WestRock Company, Segezha Group, Hood Packaging Corporation, and other leading industrial paper sack companies |
| Additional Attributes | Dollar sales by product type, closure type, capacity, end-use application, and region; regional demand trends, competitive landscape, technological advancements in kraft paper engineering, barrier coating integration initiatives, strength enhancement programs, and premium product development strategies |
The global industrial paper sacks market is estimated to be valued at USD 6.8 billion in 2025.
The market size for the industrial paper sacks market is projected to reach USD 13.3 billion by 2035.
The industrial paper sacks market is expected to grow at a 6.9% CAGR between 2025 and 2035.
The key product types in industrial paper sacks market are multi-ply paper sacks, single-ply paper sacks, gusseted paper sacks and pinch bottom sacks.
In terms of end-use application, building & construction segment to command 44.0% share in the industrial paper sacks market in 2025.


Full Research Suite comprises of:
Market outlook & trends analysis
Interviews & case studies
Strategic recommendations
Vendor profiles & capabilities analysis
5-year forecasts
8 regions and 60+ country-level data splits
Market segment data splits
12 months of continuous data updates
DELIVERED AS:
PDF EXCEL ONLINE
Market Share Insights of Industrial Paper Sacks Providers
Industrial Electronics Packaging Market Forecast and Outlook 2025 to 2035
Industrial Absorbent Market Forecast and Outlook 2025 to 2035
Industrial Furnace Industry Analysis in Europe Forecast and Outlook 2025 to 2035
Industrial Denox System Market Size and Share Forecast Outlook 2025 to 2035
Industrial Electronic Pressure Switch Market Size and Share Forecast Outlook 2025 to 2035
Industrial WiFi Module Market Size and Share Forecast Outlook 2025 to 2035
Industrial Security System Market Forecast Outlook 2025 to 2035
Industrial Film Market Forecast Outlook 2025 to 2035
Industrial Floor Mat Market Forecast Outlook 2025 to 2035
Industrial Insulation Market Forecast and Outlook 2025 to 2035
Industrial Process Water Coolers Market Forecast and Outlook 2025 to 2035
Industrial Grade Ammonium Hydrogen Fluoride Market Forecast and Outlook 2025 to 2035
Industrial Grade Sodium Bifluoride Market Forecast and Outlook 2025 to 2035
Industrial Evaporative Condenser Market Size and Share Forecast Outlook 2025 to 2035
Industrial Power Supply Market Size and Share Forecast Outlook 2025 to 2035
Industrial Crystallizer Market Size and Share Forecast Outlook 2025 to 2035
Industrial Counterweight Market Size and Share Forecast Outlook 2025 to 2035
Industrial Gas Market Size and Share Forecast Outlook 2025 to 2035
Industrial Furnace Market Size and Share Forecast Outlook 2025 to 2035

Thank you!
You will receive an email from our Business Development Manager. Please be sure to check your SPAM/JUNK folder too.
Chat With
MaRIA