Gas Telecom Generator Market Size and Share Forecast Outlook 2025 to 2035

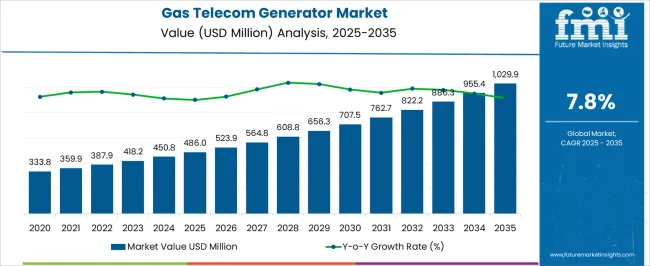
The gas telecom generator market is projected to reach USD 486.0 million in 2025 and anticipated to expand to USD 1,029.9 million by 2035, progressing at a CAGR of 7.8%. A Growth Contribution Index analysis reveals how different phases of the forecast period contribute unevenly to total expansion. Between 2025 and 2028, the market grows from USD 486.0 million to USD 564.8 million, accounting for an early contribution of around 19% to the total decade-long growth, primarily supported by rural telecom installations and grid reliability challenges.

From 2029 to 2032, expansion accelerates sharply, with the market moving past USD 762.7 million, contributing nearly 35% of cumulative growth during this mid-cycle. This interval reflects the surge in data traffic, expansion of 5G towers, and telecom operators upgrading backup systems to meet demand. The final stage, spanning 2033 to 2035, adds USD 243.6 million in growth, contributing about 27% of the total, largely driven by replacement demand, hybrid power solutions, and regulatory shifts favoring gas-based generators over diesel.

The Growth Contribution Index underscores that while early growth is foundational, mid-cycle expansion represents the most intensive contribution to overall market advancement, with late-cycle growth consolidating gains through technology renewal and compliance-driven adoption.
Quick Stats for Gas Telecom Generator Market

  • Gas Telecom Generator Market Value (2025): USD 486.0 million
  • Gas Telecom Generator Market Forecast Value (2035): USD 1029.9 million
  • Gas Telecom Generator Market Forecast CAGR: 7.8%
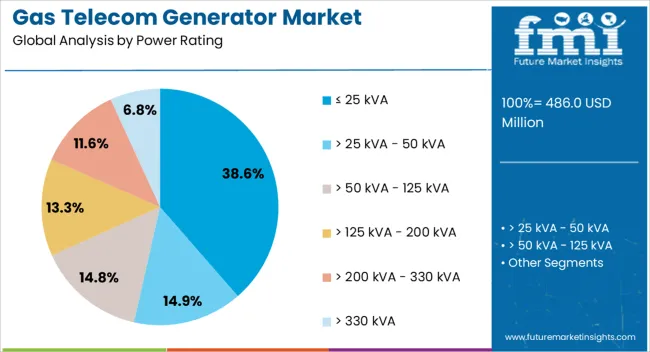
  • Leading Segment in Gas Telecom Generator Market in 2025: ≤ 25 kVA (38.6%)
  • Key Growth Regions in Gas Telecom Generator Market: North America, Asia-Pacific, Europe
  • Top Key Players in Gas Telecom Generator Market: AGG POWER TECHNOLOGY (UK) CO., LTD, Aggreko, Atlas Copco AB, Caterpillar, Chroma Power Systems India Private Limited, Cshpower, Cummins, Inc., Generac Power Systems, Inc., Green Power Systems s.r.l., HIMOINSA, Kohler Energy, MAHINDRA POWEROL, SWT, The Pai Kane Group, Total Energy Solutions

Gas Telecom Generator Market Market Value Analysis

Gas Telecom Generator Market Key Takeaways

Metric Value
Gas Telecom Generator Market Estimated Value in (2025 E) USD 486.0 million
Gas Telecom Generator Market Forecast Value in (2035 F) USD 1029.9 million
Forecast CAGR (2025 to 2035) 7.8%

The gas telecom generator market is shaped by five interconnected parent markets, each contributing uniquely to its expansion. The telecom infrastructure and tower deployment market holds the largest share at 36%, as operators rely on gas-powered backup generators to ensure continuous service in areas with unstable or limited grid access. The data centers and network facilities segment contributes 24%, with generators playing a crucial role in maintaining uninterrupted operations for critical IT systems and high-volume traffic management.

The rural connectivity and off-grid telecom projects account for 18%, where gas generators provide reliable power solutions for remote towers, especially in emerging economies. The industrial and commercial energy backup sector holds a 12% share, as enterprises and public services integrate gas generators to support communications during outages. Finally, the government and regulatory-driven initiatives market represents 10%, where mandates for clean, efficient, and reliable backup solutions support the adoption of gas generators over diesel alternatives.

Telecom infrastructure, data centers, and rural connectivity projects account for 78% of the overall share, underscoring that uninterrupted communication, grid reliability, and network expansion remain the primary growth drivers, while industrial and government-backed programs provide consistent support for long-term global adoption.

Why is the Gas Telecom Generator Market Growing?

The gas telecom generator market is gaining strong momentum as telecom operators prioritize uninterrupted power supply across remote and urban networks. Growing mobile connectivity, increased data consumption, and the deployment of 5G infrastructure have raised the need for reliable backup power systems.

Gas generators are being increasingly preferred due to their lower emissions, fuel efficiency, and compatibility with hybrid and renewable energy systems. In regions where grid instability remains a challenge, telecom providers are investing in decentralized, low-maintenance energy solutions that ensure tower uptime and service continuity.

Additionally, regulatory efforts focused on reducing diesel dependency and lowering operational carbon footprints are further supporting the transition toward gas powered alternatives. The market outlook remains optimistic with heightened demand driven by network expansion in off-grid zones, infrastructure modernization, and stricter telecom service reliability standards.

Segmental Analysis

The gas telecom generator market is segmented by power rating, application, and geographic regions. By power rating, gas telecom generator market is divided into ≤ 25 kVA, > 25 kVA - 50 kVA, > 50 kVA - 125 kVA, > 125 kVA - 200 kVA, > 200 kVA - 330 kVA, and > 330 kVA. In terms of application, gas telecom generator market is classified into Standby and Prime/Continuous. Regionally, the gas telecom generator industry is classified into North America, Latin America, Western Europe, Eastern Europe, Balkan & Baltic Countries, Russia & Belarus, Central Asia, East Asia, South Asia & Pacific, and the Middle East & Africa.
Insights into the ≤ 25 kVA Power Rating Segment

Gas Telecom Generator Market Analysis By Power Rating

The ≤ 25 kVA segment is anticipated to account for 38.60% of the overall market revenue by 2025, making it the most prominent power rating category. This dominance is attributed to the rising demand for compact and efficient generator systems that cater to single or small cluster telecom tower sites.

These systems are particularly well suited for rural or semi urban installations where energy requirements are moderate, but reliability is critical. Their smaller footprint, ease of transport, and relatively lower operational cost make them ideal for geographically dispersed tower locations.

The segment’s popularity is further supported by advancements in remote monitoring and control features, enabling telecom operators to manage energy usage efficiently and ensure minimal service disruption. These advantages have contributed to the leadership of the ≤ 25 kVA segment in the gas telecom generator market.
Insights into the Standby Application Segment

Gas Telecom Generator Market Analysis By Application

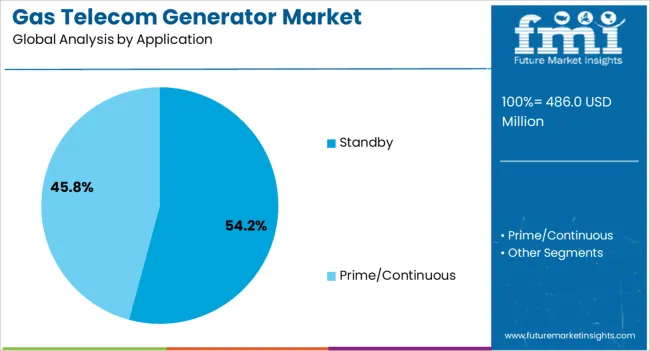
The standby segment is projected to hold 54.20% of total market revenue by 2025, establishing it as the leading application area. The segment’s strength is being driven by the increasing requirement for emergency power support across telecom sites, especially in regions with unreliable grid infrastructure.

As network reliability becomes a top operational priority, telecom companies are investing in backup systems that activate automatically during outages, ensuring uninterrupted connectivity. Standby generators powered by gas offer cleaner emissions and quicker response times compared to traditional diesel units.

Their integration with intelligent power management systems enhances operational readiness and energy efficiency. These factors have solidified the standby segment’s leadership position in the market, as telecom networks seek robust and sustainable backup power solutions.

What are the Drivers, Restraints, and Key Trends of the Gas Telecom Generator Market?

The gas telecom generator market is driven by telecom tower expansion, data center reliability, a shift toward gas-based alternatives, and regulatory compliance. These dynamics highlight efficiency, reliability, and compliance as central growth forces.

Expansion of Telecom Infrastructure and Towers

The gas telecom generator market is heavily influenced by the rapid buildout of telecom infrastructure, especially in developing economies where grid power is unreliable. Tower companies and mobile operators are investing in backup power solutions to guarantee uninterrupted service for voice, data, and 5G networks. Gas generators offer a dependable alternative to diesel units, delivering stable output while meeting evolving efficiency expectations. Rising smartphone penetration and growing internet usage increase the number of telecom towers being deployed, particularly in rural and semi-urban regions. This infrastructure expansion directly drives the adoption of gas generators, which are often chosen for their reliability, lower emissions, and long-term operating cost advantages in telecom applications.

Growing Demand from Data and Network Centers

Data centers and network hubs are becoming significant contributors to gas telecom generator adoption as these facilities require uninterrupted operations. With the surge in video streaming, cloud services, and enterprise data use, network facilities cannot afford outages. Gas generators are being integrated as part of redundant backup systems, ensuring smooth operations when grid failures occur. Telecom operators are also expanding central switching and processing facilities, where gas-based power support enhances stability. Unlike diesel, gas options are preferred for their longer refueling cycles and adaptability to hybrid systems. This demand highlights how the digital economy and its supporting infrastructure are reinforcing the importance of reliable telecom backup power solutions.

Shift Toward Cleaner and Reliable Alternatives

Telecom companies are steadily shifting from diesel-based solutions to gas-powered generators, as these systems are perceived to be more reliable and cost-efficient in long-term use. Gas generators provide smoother operation with reduced maintenance requirements, making them suitable for continuous telecom operations. Regulatory support in many regions encourages telecom operators to adopt backup solutions that produce fewer emissions and improve energy efficiency. Hybrid systems combining gas generators with renewable inputs such as solar are also gaining traction. This transition signals a structural change in the way backup power is procured, where gas-powered systems are being prioritized for their operational reliability, compliance with standards, and ability to support large telecom networks effectively.

Influence of Regulations and Efficiency Standards

The regulatory environment plays a decisive role in shaping demand for gas telecom generators, with many governments enforcing stricter efficiency and emission norms. Telecom operators are responding by replacing outdated backup systems with compliant gas units that meet certification requirements. This trend is particularly strong in regions with significant telecom expansion, where reliability and compliance must work hand in hand. Efficiency standards also encourage investment in advanced models that deliver both performance and cost benefits over time. The industry is further shaped by global efforts to ensure uninterrupted communications during power disruptions, reinforcing the need for regulatory-compliant, durable, and high-performance gas generator solutions in the telecom sector.
Analysis of Gas Telecom Generator Market By Key Countries

Gas Telecom Generator Market Cagr Analysis By Country

Country CAGR
China 10.5%
India 9.8%
Germany 9.0%
France 8.2%
UK 7.4%
USA 6.6%
Brazil 5.9%

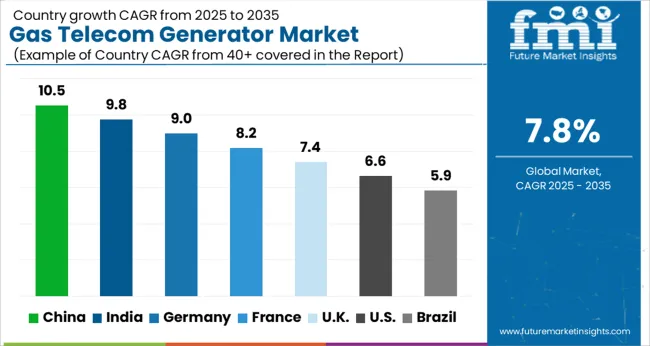
The global gas telecom generator market is projected to grow at a CAGR of 7.8% from 2025 to 2035. China leads with 10.5%, followed by India at 9.8% and Germany at 9.0%, while France records 8.2%, the UK posts 7.4%, and the USA trails at 6.6%. Growth in Asia, particularly China and India, is driven by large-scale telecom tower deployments, rural connectivity projects, and the ongoing 5G rollout, which demands uninterrupted backup power. Germany and France emphasize compliance with efficiency standards, hybrid backup integration, and adoption in both urban and semi-urban telecom hubs. The UK and USA show steady but slower expansion, shaped by modernization of legacy telecom sites, rising data traffic, and adoption of cleaner alternatives to diesel. Collectively, Asia demonstrates the strongest contribution to market growth, while Europe and North America sustain demand through compliance-driven procurement and advanced hybridized solutions. The analysis spans over 40+ countries, with the leading markets shown below.

Expansion of Gas Telecom Generator Market in China

The gas telecom generator market in China is projected to grow at a CAGR of 10.5% from 2025 to 2035. Demand is being pulled by dense tower rollout, 5G core upgrades, and capacity additions across metro clusters and provincial corridors. Backup power for base transceiver stations has been prioritized by tower companies that seek longer runtime, lower particulate output, and stable OPEX. Natural gas access across industrial parks offers an advantage for continuous backup and hybrid pairing with battery banks. Procurement is being shaped by certification requests on noise, emissions, and remote monitoring. In my view, China will keep setting the pace as operators standardize gas sets for Tier 2 and Tier 3 sites and extend lifecycle service contracts with predictive maintenance baked in.

  • Network densification and 5G upgrades driving installs
  • Gas grid access improving runtime economics
  • Remote monitoring and service contracts prioritized

Sales Outlook of Gas Telecom Generators in India

The gas telecom generator market in India is expected to expand at a CAGR of 9.8% from 2025 to 2035. Rollout of towers across rural and semi urban belts has required dependable backup to counter grid fluctuations and fuel logistics issues. Gas sets are being adopted where PNG or CNG supply is available, with hybrid sites pairing PV, batteries, and gas engines for improved uptime. Operators seek quieter operation for dense neighborhoods and hospital campuses, which favors gas over diesel. TSPs and towercos have been negotiating multi site service SLAs that emphasize parts availability and remote diagnostics. This market is judged to continue its rise as spectrum auctions, fiber backhaul, and data growth expand the addressable base for reliable prime and standby power.
  • Rural connectivity and fiber backhaul supporting demand
  • Hybrid PV battery gas sites gaining traction
  • Service SLAs and spares access influencing awards

Adoption Trajectory of Gas Telecom Generators in Germany

Gas Telecom Generator Market Europe Country Market Share Analysis, 2025 & 2035

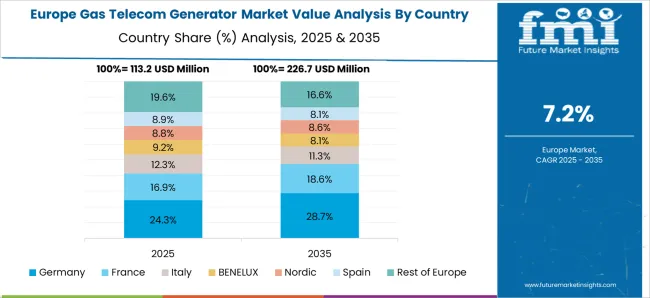
Germany is anticipated to post a 9.0% CAGR from 2025 to 2035. Telecom hubs, edge data nodes, and indoor DAS sites have been insisting on cleaner backup with strict conformity to noise and emissions codes. Municipal permits favor gas units where pipeline access exists, while utilities and neutral host providers require telemetry hooks for SNMP or API based monitoring. Replacement of aging diesel sets has been moving in phases within city cores and transport corridors. My view is that vendors with certified acoustic enclosures, cold start reliability, and long maintenance intervals will capture share as operators consolidate suppliers. Integration with UPS and lithium storage at switching centers will anchor consistent orders.

  • Permit friendly acoustics and emissions compliance
  • Telemetry integration required for fleet oversight
  • Diesel replacement cycles supporting upgrades

Deployment Pattern of Gas Telecom Generators Market in the United Kingdom

The UK market is projected to rise at a CAGR of 7.4% from 2025 to 2035. Estate owners for rooftops, small cells, and macro sites have been evaluating gas sets for quieter operation and predictable fueling in dense districts. Network resilience targets for emergency services networks and rail telecoms add steady demand. Procurement frameworks give weight to total lifecycle cost, enclosure footprint, and theft resistant designs. Pipeline access varies by region, so containerized gas sets with interchangeable fuel trains are preferred for flexibility. It is believed that steady modernization of legacy exchanges and edge POPs will keep orders flowing, with remote condition monitoring written into most contracts.
  • Resilience targets for public safety networks
  • Compact, quiet enclosures for urban rooftops
  • Lifecycle cost and security features prioritized

Market Perspective of Gas Telecom Generators in the United States

Gas Telecom Generator Market Country Value Analysis

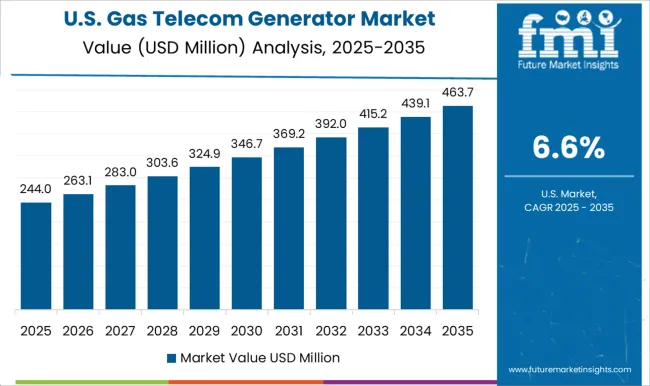
The USA market is expected to grow at a CAGR of 6.6% from 2025 to 2035. Macro sites, edge data facilities, and enterprise campuses require extended backup to handle storms and grid instability in select regions. Gas units are being specified for long runtime, cleaner operation, and quick refueling via pipeline where available. Carriers continue to harden networks after major outages, which supports dual source power with ATS, UPS, and gas generators. Decision makers focus on EPA compliance, acoustic ratings, and remote diagnostics that tie into NOC dashboards. My assessment is that growth will stay steady as operators retire older diesel fleets, improve uptime metrics, and secure multi year maintenance with guaranteed parts pools.
  • Network hardening after outage events
  • EPA compliant systems with remote diagnostics
  • Diesel retirement and multiyear maintenance deals

Competitive Landscape of Gas Telecom Generator Market

Gas Telecom Generator Market Analysis By Company

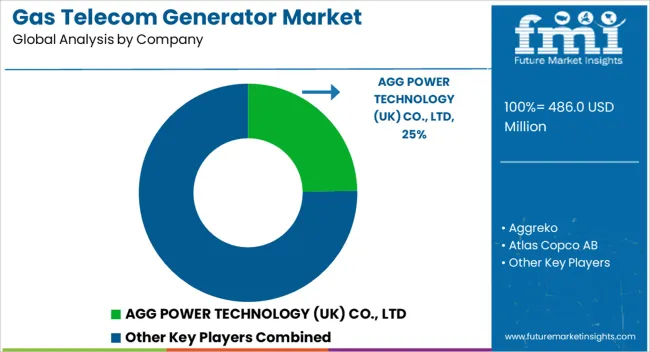
The gas telecom generator market has been characterized by moderate to high competition, driven by the demand from telecom tower operators seeking reliable off-grid and backup power solutions. The market features a mix of multinational power equipment companies and regional generator manufacturers.

Global players such as Caterpillar Inc., Cummins Inc., Generac Power Systems, and Kohler Co. dominate the premium segment by offering advanced natural gas and propane-powered generator models with remote monitoring, low-emission engines, and high fuel efficiency. Their competitive edge comes from brand reputation, global distribution networks, and after-sales service capabilities.

Regional and local companies like Jakson Group, Mahindra Powerol, and Greaves Cotton compete on cost, customization, and quicker delivery timelines. They often secure contracts in price-sensitive markets by offering flexible maintenance packages and localized technical support. Competition has intensified due to telecom network expansions in rural and remote regions, prompting suppliers to focus on hybrid gas-diesel designs, longer service intervals, and compact enclosures suited to limited site space. Price competition remains strong in developing markets, while premium performance and reliability are key differentiators in mature regions.

Key Players in the Gas Telecom Generator Market

  • AGG POWER TECHNOLOGY (UK) CO., LTD
  • Aggreko
  • Atlas Copco AB
  • Caterpillar
  • Chroma Power Systems India Private Limited
  • Cshpower
  • Cummins, Inc.
  • Generac Power Systems, Inc.
  • Green Power Systems s.r.l.
  • HIMOINSA
  • Kohler Energy
  • MAHINDRA POWEROL
  • SWT
  • The Pai Kane Group
  • Total Energy Solutions

Scope of the Report

Item Value
Quantitative Units USD 486.0 Million
Power Rating ≤ 25 kVA, > 25 kVA - 50 kVA, > 50 kVA - 125 kVA, > 125 kVA - 200 kVA, > 200 kVA - 330 kVA, and > 330 kVA
Application Standby and Prime/Continuous
Regions Covered North America, Europe, Asia-Pacific, Latin America, Middle East & Africa
Country Covered United States, Canada, Germany, France, United Kingdom, China, Japan, India, Brazil, South Africa
Key Companies Profiled AGG POWER TECHNOLOGY (UK) CO., LTD, Aggreko, Atlas Copco AB, Caterpillar, Chroma Power Systems India Private Limited, Cshpower, Cummins, Inc., Generac Power Systems, Inc., Green Power Systems s.r.l., HIMOINSA, Kohler Energy, MAHINDRA POWEROL, SWT, The Pai Kane Group, and Total Energy Solutions
Additional Attributes Dollar sales by capacity range, share by telecom tower type, regional adoption hotspots, competitive positioning, pricing benchmarks, regulatory compliance impact, and hybrid integration opportunities.

Gas Telecom Generator Market by Segments

Power Rating:

  • ≤ 25 kVA
  • > 25 kVA - 50 kVA
  • > 50 kVA - 125 kVA
  • > 125 kVA - 200 kVA
  • > 200 kVA - 330 kVA
  • > 330 kVA

Application:

  • Standby
  • Prime/Continuous

Region:

  • North America
    • USA
    • Canada
    • Mexico
  • Latin America
    • Brazil
    • Chile
    • Rest of Latin America
  • Western Europe
    • Germany
    • UK
    • Italy
    • Spain
    • France
    • Nordic
    • BENELUX
    • Rest of Western Europe
  • Eastern Europe
    • Russia
    • Poland
    • Hungary
    • Balkan & Baltic
    • Rest of Eastern Europe
  • East Asia
    • China
    • Japan
    • South Korea
  • South Asia and Pacific
    • India
    • ASEAN
    • Australia & New Zealand
    • Rest of South Asia and Pacific
  • Middle East & Africa
    • Kingdom of Saudi Arabia
    • Other GCC Countries
    • Turkiye
    • South Africa
    • Other African Union
    • Rest of Middle East & Africa

Table of Content

  1. Executive Summary
    • Global Market Outlook
    • Demand-side Trends
    • Supply-side Trends
    • Technology Roadmap Analysis
    • Analysis and Recommendations
  2. Market Overview
    • Market Coverage / Taxonomy
    • Market Definition / Scope / Limitations
  3. Market Background
    • Market Dynamics
      • Drivers
      • Restraints
      • Opportunity
      • Trends
    • Scenario Forecast
      • Demand in Optimistic Scenario
      • Demand in Likely Scenario
      • Demand in Conservative Scenario
    • Opportunity Map Analysis
    • Product Life Cycle Analysis
    • Supply Chain Analysis
    • Investment Feasibility Matrix
    • Value Chain Analysis
    • PESTLE and Porter’s Analysis
    • Regulatory Landscape
    • Regional Parent Market Outlook
    • Production and Consumption Statistics
    • Import and Export Statistics
  4. Global Gas Telecom Generator Market Analysis 2020-2024 and Forecast, 2025-2035
    • Historical Market Size Value (USD Mn) Analysis, 2020-2024
    • Current and Future Market Size Value (USD Mn) Projections, 2025-2035
      • Y-o-Y Growth Trend Analysis
      • Absolute $ Opportunity Analysis
  5. Global Gas Telecom Generator Market Pricing Analysis 2020-2024 and Forecast 2025-2035
  6. Global Gas Telecom Generator Market Analysis 2020-2024 and Forecast 2025-2035, By Power Rating
    • Introduction / Key Findings
    • Historical Market Size Value (USD Mn) Analysis By Power Rating , 2020-2024
    • Current and Future Market Size Value (USD Mn) Analysis and Forecast By Power Rating , 2025-2035
      • ≤ 25 kVA
      • > 25 kVA - 50 kVA
      • > 50 kVA - 125 kVA
      • > 125 kVA - 200 kVA
      • > 200 kVA - 330 kVA
      • > 330 kVA
    • Y-o-Y Growth Trend Analysis By Power Rating , 2020-2024
    • Absolute $ Opportunity Analysis By Power Rating , 2025-2035
  7. Global Gas Telecom Generator Market Analysis 2020-2024 and Forecast 2025-2035, By Application
    • Introduction / Key Findings
    • Historical Market Size Value (USD Mn) Analysis By Application, 2020-2024
    • Current and Future Market Size Value (USD Mn) Analysis and Forecast By Application, 2025-2035
      • Standby
      • Prime/Continuous
    • Y-o-Y Growth Trend Analysis By Application, 2020-2024
    • Absolute $ Opportunity Analysis By Application, 2025-2035
  8. Global Gas Telecom Generator Market Analysis 2020-2024 and Forecast 2025-2035, By Region
    • Introduction
    • Historical Market Size Value (USD Mn) Analysis By Region, 2020-2024
    • Current Market Size Value (USD Mn) Analysis and Forecast By Region, 2025-2035
      • North America
      • Latin America
      • Western Europe
      • Eastern Europe
      • East Asia
      • South Asia and Pacific
      • Middle East & Africa
    • Market Attractiveness Analysis By Region
  9. North America Gas Telecom Generator Market Analysis 2020-2024 and Forecast 2025-2035, By Country
    • Historical Market Size Value (USD Mn) Trend Analysis By Market Taxonomy, 2020-2024
    • Market Size Value (USD Mn) Forecast By Market Taxonomy, 2025-2035
      • By Country
        • USA
        • Canada
        • Mexico
      • By Power Rating
      • By Application
    • Market Attractiveness Analysis
      • By Country
      • By Power Rating
      • By Application
    • Key Takeaways
  10. Latin America Gas Telecom Generator Market Analysis 2020-2024 and Forecast 2025-2035, By Country
    • Historical Market Size Value (USD Mn) Trend Analysis By Market Taxonomy, 2020-2024
    • Market Size Value (USD Mn) Forecast By Market Taxonomy, 2025-2035
      • By Country
        • Brazil
        • Chile
        • Rest of Latin America
      • By Power Rating
      • By Application
    • Market Attractiveness Analysis
      • By Country
      • By Power Rating
      • By Application
    • Key Takeaways
  11. Western Europe Gas Telecom Generator Market Analysis 2020-2024 and Forecast 2025-2035, By Country
    • Historical Market Size Value (USD Mn) Trend Analysis By Market Taxonomy, 2020-2024
    • Market Size Value (USD Mn) Forecast By Market Taxonomy, 2025-2035
      • By Country
        • Germany
        • UK
        • Italy
        • Spain
        • France
        • Nordic
        • BENELUX
        • Rest of Western Europe
      • By Power Rating
      • By Application
    • Market Attractiveness Analysis
      • By Country
      • By Power Rating
      • By Application
    • Key Takeaways
  12. Eastern Europe Gas Telecom Generator Market Analysis 2020-2024 and Forecast 2025-2035, By Country
    • Historical Market Size Value (USD Mn) Trend Analysis By Market Taxonomy, 2020-2024
    • Market Size Value (USD Mn) Forecast By Market Taxonomy, 2025-2035
      • By Country
        • Russia
        • Poland
        • Hungary
        • Balkan & Baltic
        • Rest of Eastern Europe
      • By Power Rating
      • By Application
    • Market Attractiveness Analysis
      • By Country
      • By Power Rating
      • By Application
    • Key Takeaways
  13. East Asia Gas Telecom Generator Market Analysis 2020-2024 and Forecast 2025-2035, By Country
    • Historical Market Size Value (USD Mn) Trend Analysis By Market Taxonomy, 2020-2024
    • Market Size Value (USD Mn) Forecast By Market Taxonomy, 2025-2035
      • By Country
        • China
        • Japan
        • South Korea
      • By Power Rating
      • By Application
    • Market Attractiveness Analysis
      • By Country
      • By Power Rating
      • By Application
    • Key Takeaways
  14. South Asia and Pacific Gas Telecom Generator Market Analysis 2020-2024 and Forecast 2025-2035, By Country
    • Historical Market Size Value (USD Mn) Trend Analysis By Market Taxonomy, 2020-2024
    • Market Size Value (USD Mn) Forecast By Market Taxonomy, 2025-2035
      • By Country
        • India
        • ASEAN
        • Australia & New Zealand
        • Rest of South Asia and Pacific
      • By Power Rating
      • By Application
    • Market Attractiveness Analysis
      • By Country
      • By Power Rating
      • By Application
    • Key Takeaways
  15. Middle East & Africa Gas Telecom Generator Market Analysis 2020-2024 and Forecast 2025-2035, By Country
    • Historical Market Size Value (USD Mn) Trend Analysis By Market Taxonomy, 2020-2024
    • Market Size Value (USD Mn) Forecast By Market Taxonomy, 2025-2035
      • By Country
        • Kingdom of Saudi Arabia
        • Other GCC Countries
        • Turkiye
        • South Africa
        • Other African Union
        • Rest of Middle East & Africa
      • By Power Rating
      • By Application
    • Market Attractiveness Analysis
      • By Country
      • By Power Rating
      • By Application
    • Key Takeaways
  16. Key Countries Gas Telecom Generator Market Analysis
    • USA
      • Pricing Analysis
      • Market Share Analysis, 2024
        • By Power Rating
        • By Application
    • Canada
      • Pricing Analysis
      • Market Share Analysis, 2024
        • By Power Rating
        • By Application
    • Mexico
      • Pricing Analysis
      • Market Share Analysis, 2024
        • By Power Rating
        • By Application
    • Brazil
      • Pricing Analysis
      • Market Share Analysis, 2024
        • By Power Rating
        • By Application
    • Chile
      • Pricing Analysis
      • Market Share Analysis, 2024
        • By Power Rating
        • By Application
    • Germany
      • Pricing Analysis
      • Market Share Analysis, 2024
        • By Power Rating
        • By Application
    • UK
      • Pricing Analysis
      • Market Share Analysis, 2024
        • By Power Rating
        • By Application
    • Italy
      • Pricing Analysis
      • Market Share Analysis, 2024
        • By Power Rating
        • By Application
    • Spain
      • Pricing Analysis
      • Market Share Analysis, 2024
        • By Power Rating
        • By Application
    • France
      • Pricing Analysis
      • Market Share Analysis, 2024
        • By Power Rating
        • By Application
    • India
      • Pricing Analysis
      • Market Share Analysis, 2024
        • By Power Rating
        • By Application
    • ASEAN
      • Pricing Analysis
      • Market Share Analysis, 2024
        • By Power Rating
        • By Application
    • Australia & New Zealand
      • Pricing Analysis
      • Market Share Analysis, 2024
        • By Power Rating
        • By Application
    • China
      • Pricing Analysis
      • Market Share Analysis, 2024
        • By Power Rating
        • By Application
    • Japan
      • Pricing Analysis
      • Market Share Analysis, 2024
        • By Power Rating
        • By Application
    • South Korea
      • Pricing Analysis
      • Market Share Analysis, 2024
        • By Power Rating
        • By Application
    • Russia
      • Pricing Analysis
      • Market Share Analysis, 2024
        • By Power Rating
        • By Application
    • Poland
      • Pricing Analysis
      • Market Share Analysis, 2024
        • By Power Rating
        • By Application
    • Hungary
      • Pricing Analysis
      • Market Share Analysis, 2024
        • By Power Rating
        • By Application
    • Kingdom of Saudi Arabia
      • Pricing Analysis
      • Market Share Analysis, 2024
        • By Power Rating
        • By Application
    • Turkiye
      • Pricing Analysis
      • Market Share Analysis, 2024
        • By Power Rating
        • By Application
    • South Africa
      • Pricing Analysis
      • Market Share Analysis, 2024
        • By Power Rating
        • By Application
  17. Market Structure Analysis
    • Competition Dashboard
    • Competition Benchmarking
    • Market Share Analysis of Top Players
      • By Regional
      • By Power Rating
      • By Application
  18. Competition Analysis
    • Competition Deep Dive
      • AGG POWER TECHNOLOGY (UK) CO., LTD
        • Overview
        • Product Portfolio
        • Profitability by Market Segments (Product/Age /Sales Channel/Region)
        • Sales Footprint
        • Strategy Overview
          • Marketing Strategy
          • Product Strategy
          • Channel Strategy
      • Aggreko
      • Atlas Copco AB
      • Caterpillar
      • Chroma Power Systems India Private Limited
      • Cshpower
      • Cummins, Inc.
      • Generac Power Systems, Inc.
      • Green Power Systems s.r.l.
      • HIMOINSA
      • Kohler Energy
      • MAHINDRA POWEROL
      • SWT
      • The Pai Kane Group
      • Total Energy Solutions
  19. Assumptions & Acronyms Used
  20. Research Methodology

List of Tables

  • Table 1: Global Gas Telecom Generator Market Value (USD Mn) Forecast by Region, 2020-2035
  • Table 2: Global Gas Telecom Generator Market Value (USD Mn) Forecast by Power Rating , 2020-2035
  • Table 3: Global Gas Telecom Generator Market Value (USD Mn) Forecast by Application, 2020-2035
  • Table 4: North America Gas Telecom Generator Market Value (USD Mn) Forecast by Country, 2020-2035
  • Table 5: North America Gas Telecom Generator Market Value (USD Mn) Forecast by Power Rating , 2020-2035
  • Table 6: North America Gas Telecom Generator Market Value (USD Mn) Forecast by Application, 2020-2035
  • Table 7: Latin America Gas Telecom Generator Market Value (USD Mn) Forecast by Country, 2020-2035
  • Table 8: Latin America Gas Telecom Generator Market Value (USD Mn) Forecast by Power Rating , 2020-2035
  • Table 9: Latin America Gas Telecom Generator Market Value (USD Mn) Forecast by Application, 2020-2035
  • Table 10: Western Europe Gas Telecom Generator Market Value (USD Mn) Forecast by Country, 2020-2035
  • Table 11: Western Europe Gas Telecom Generator Market Value (USD Mn) Forecast by Power Rating , 2020-2035
  • Table 12: Western Europe Gas Telecom Generator Market Value (USD Mn) Forecast by Application, 2020-2035
  • Table 13: Eastern Europe Gas Telecom Generator Market Value (USD Mn) Forecast by Country, 2020-2035
  • Table 14: Eastern Europe Gas Telecom Generator Market Value (USD Mn) Forecast by Power Rating , 2020-2035
  • Table 15: Eastern Europe Gas Telecom Generator Market Value (USD Mn) Forecast by Application, 2020-2035
  • Table 16: East Asia Gas Telecom Generator Market Value (USD Mn) Forecast by Country, 2020-2035
  • Table 17: East Asia Gas Telecom Generator Market Value (USD Mn) Forecast by Power Rating , 2020-2035
  • Table 18: East Asia Gas Telecom Generator Market Value (USD Mn) Forecast by Application, 2020-2035
  • Table 19: South Asia and Pacific Gas Telecom Generator Market Value (USD Mn) Forecast by Country, 2020-2035
  • Table 20: South Asia and Pacific Gas Telecom Generator Market Value (USD Mn) Forecast by Power Rating , 2020-2035
  • Table 21: South Asia and Pacific Gas Telecom Generator Market Value (USD Mn) Forecast by Application, 2020-2035
  • Table 22: Middle East & Africa Gas Telecom Generator Market Value (USD Mn) Forecast by Country, 2020-2035
  • Table 23: Middle East & Africa Gas Telecom Generator Market Value (USD Mn) Forecast by Power Rating , 2020-2035
  • Table 24: Middle East & Africa Gas Telecom Generator Market Value (USD Mn) Forecast by Application, 2020-2035

List of Figures

  • Figure 1: Global Gas Telecom Generator Market Pricing Analysis
  • Figure 2: Global Gas Telecom Generator Market Value (USD Mn) Forecast 2020–2035
  • Figure 3: Global Gas Telecom Generator Market Value Share and BPS Analysis by Power Rating , 2025 and 2035
  • Figure 4: Global Gas Telecom Generator Market Y-o-Y Growth Comparison by Power Rating , 2025–2035
  • Figure 5: Global Gas Telecom Generator Market Attractiveness Analysis by Power Rating
  • Figure 6: Global Gas Telecom Generator Market Value Share and BPS Analysis by Application, 2025 and 2035
  • Figure 7: Global Gas Telecom Generator Market Y-o-Y Growth Comparison by Application, 2025–2035
  • Figure 8: Global Gas Telecom Generator Market Attractiveness Analysis by Application
  • Figure 9: Global Gas Telecom Generator Market Value (USD Mn) Share and BPS Analysis by Region, 2025 and 2035
  • Figure 10: Global Gas Telecom Generator Market Y-o-Y Growth Comparison by Region, 2025–2035
  • Figure 11: Global Gas Telecom Generator Market Attractiveness Analysis by Region
  • Figure 12: North America Gas Telecom Generator Market Incremental Dollar Opportunity, 2025–2035
  • Figure 13: Latin America Gas Telecom Generator Market Incremental Dollar Opportunity, 2025–2035
  • Figure 14: Western Europe Gas Telecom Generator Market Incremental Dollar Opportunity, 2025–2035
  • Figure 15: Eastern Europe Gas Telecom Generator Market Incremental Dollar Opportunity, 2025–2035
  • Figure 16: East Asia Gas Telecom Generator Market Incremental Dollar Opportunity, 2025–2035
  • Figure 17: South Asia and Pacific Gas Telecom Generator Market Incremental Dollar Opportunity, 2025–2035
  • Figure 18: Middle East & Africa Gas Telecom Generator Market Incremental Dollar Opportunity, 2025–2035
  • Figure 19: North America Gas Telecom Generator Market Value Share and BPS Analysis by Country, 2025 and 2035
  • Figure 20: North America Gas Telecom Generator Market Value Share and BPS Analysis by Power Rating , 2025 and 2035
  • Figure 21: North America Gas Telecom Generator Market Y-o-Y Growth Comparison by Power Rating , 2025–2035
  • Figure 22: North America Gas Telecom Generator Market Attractiveness Analysis by Power Rating
  • Figure 23: North America Gas Telecom Generator Market Value Share and BPS Analysis by Application, 2025 and 2035
  • Figure 24: North America Gas Telecom Generator Market Y-o-Y Growth Comparison by Application, 2025–2035
  • Figure 25: North America Gas Telecom Generator Market Attractiveness Analysis by Application
  • Figure 26: Latin America Gas Telecom Generator Market Value Share and BPS Analysis by Country, 2025 and 2035
  • Figure 27: Latin America Gas Telecom Generator Market Value Share and BPS Analysis by Power Rating , 2025 and 2035
  • Figure 28: Latin America Gas Telecom Generator Market Y-o-Y Growth Comparison by Power Rating , 2025–2035
  • Figure 29: Latin America Gas Telecom Generator Market Attractiveness Analysis by Power Rating
  • Figure 30: Latin America Gas Telecom Generator Market Value Share and BPS Analysis by Application, 2025 and 2035
  • Figure 31: Latin America Gas Telecom Generator Market Y-o-Y Growth Comparison by Application, 2025–2035
  • Figure 32: Latin America Gas Telecom Generator Market Attractiveness Analysis by Application
  • Figure 33: Western Europe Gas Telecom Generator Market Value Share and BPS Analysis by Country, 2025 and 2035
  • Figure 34: Western Europe Gas Telecom Generator Market Value Share and BPS Analysis by Power Rating , 2025 and 2035
  • Figure 35: Western Europe Gas Telecom Generator Market Y-o-Y Growth Comparison by Power Rating , 2025–2035
  • Figure 36: Western Europe Gas Telecom Generator Market Attractiveness Analysis by Power Rating
  • Figure 37: Western Europe Gas Telecom Generator Market Value Share and BPS Analysis by Application, 2025 and 2035
  • Figure 38: Western Europe Gas Telecom Generator Market Y-o-Y Growth Comparison by Application, 2025–2035
  • Figure 39: Western Europe Gas Telecom Generator Market Attractiveness Analysis by Application
  • Figure 40: Eastern Europe Gas Telecom Generator Market Value Share and BPS Analysis by Country, 2025 and 2035
  • Figure 41: Eastern Europe Gas Telecom Generator Market Value Share and BPS Analysis by Power Rating , 2025 and 2035
  • Figure 42: Eastern Europe Gas Telecom Generator Market Y-o-Y Growth Comparison by Power Rating , 2025–2035
  • Figure 43: Eastern Europe Gas Telecom Generator Market Attractiveness Analysis by Power Rating
  • Figure 44: Eastern Europe Gas Telecom Generator Market Value Share and BPS Analysis by Application, 2025 and 2035
  • Figure 45: Eastern Europe Gas Telecom Generator Market Y-o-Y Growth Comparison by Application, 2025–2035
  • Figure 46: Eastern Europe Gas Telecom Generator Market Attractiveness Analysis by Application
  • Figure 47: East Asia Gas Telecom Generator Market Value Share and BPS Analysis by Country, 2025 and 2035
  • Figure 48: East Asia Gas Telecom Generator Market Value Share and BPS Analysis by Power Rating , 2025 and 2035
  • Figure 49: East Asia Gas Telecom Generator Market Y-o-Y Growth Comparison by Power Rating , 2025–2035
  • Figure 50: East Asia Gas Telecom Generator Market Attractiveness Analysis by Power Rating
  • Figure 51: East Asia Gas Telecom Generator Market Value Share and BPS Analysis by Application, 2025 and 2035
  • Figure 52: East Asia Gas Telecom Generator Market Y-o-Y Growth Comparison by Application, 2025–2035
  • Figure 53: East Asia Gas Telecom Generator Market Attractiveness Analysis by Application
  • Figure 54: South Asia and Pacific Gas Telecom Generator Market Value Share and BPS Analysis by Country, 2025 and 2035
  • Figure 55: South Asia and Pacific Gas Telecom Generator Market Value Share and BPS Analysis by Power Rating , 2025 and 2035
  • Figure 56: South Asia and Pacific Gas Telecom Generator Market Y-o-Y Growth Comparison by Power Rating , 2025–2035
  • Figure 57: South Asia and Pacific Gas Telecom Generator Market Attractiveness Analysis by Power Rating
  • Figure 58: South Asia and Pacific Gas Telecom Generator Market Value Share and BPS Analysis by Application, 2025 and 2035
  • Figure 59: South Asia and Pacific Gas Telecom Generator Market Y-o-Y Growth Comparison by Application, 2025–2035
  • Figure 60: South Asia and Pacific Gas Telecom Generator Market Attractiveness Analysis by Application
  • Figure 61: Middle East & Africa Gas Telecom Generator Market Value Share and BPS Analysis by Country, 2025 and 2035
  • Figure 62: Middle East & Africa Gas Telecom Generator Market Value Share and BPS Analysis by Power Rating , 2025 and 2035
  • Figure 63: Middle East & Africa Gas Telecom Generator Market Y-o-Y Growth Comparison by Power Rating , 2025–2035
  • Figure 64: Middle East & Africa Gas Telecom Generator Market Attractiveness Analysis by Power Rating
  • Figure 65: Middle East & Africa Gas Telecom Generator Market Value Share and BPS Analysis by Application, 2025 and 2035
  • Figure 66: Middle East & Africa Gas Telecom Generator Market Y-o-Y Growth Comparison by Application, 2025–2035
  • Figure 67: Middle East & Africa Gas Telecom Generator Market Attractiveness Analysis by Application
  • Figure 68: Global Gas Telecom Generator Market – Tier Structure Analysis
  • Figure 69: Global Gas Telecom Generator Market – Company Share Analysis

Frequently Asked Questions

How big is the gas telecom generator market in 2025?

The global gas telecom generator market is estimated to be valued at USD 486.0 million in 2025.

What will be the size of gas telecom generator market in 2035?

The market size for the gas telecom generator market is projected to reach USD 1,029.9 million by 2035.

How much will be the gas telecom generator market growth between 2025 and 2035?

The gas telecom generator market is expected to grow at a 7.8% CAGR between 2025 and 2035.

What are the key product types in the gas telecom generator market?

The key product types in gas telecom generator market are ≤ 25 kva, > 25 kva - 50 kva, > 50 kva - 125 kva, > 125 kva - 200 kva, > 200 kva - 330 kva and > 330 kva.

Which application segment to contribute significant share in the gas telecom generator market in 2025?

In terms of application, standby segment to command 54.2% share in the gas telecom generator market in 2025.

Explore Similar Insights

Future Market Insights

Gas Telecom Generator Market

Chat With

MaRIA

Hi There, I am MaRIA, Your Market Research Intelligence Assistant. How may I help you?