The global gastroesophageal reflux disease (GERD) device market is projected to grow from USD 1.3 billion in 2025 to approximately USD 1.9 billion by 2035, recording an absolute increase of USD 0.6 billion over the forecast period. This translates into a total growth of 46.2%, with the market forecast to expand at a compound annual growth rate (CAGR) of 3.6% between 2025 and 2035. The overall market size is expected to grow by nearly 1.46X during the same period, supported by rising GERD prevalence, increasing adoption of minimally invasive procedures, and growing demand for advanced diagnostic and treatment solutions.
Between 2025 and 2030, the GERD device market is projected to expand from USD 1.3 billion to USD 1.5 billion, resulting in a value increase of USD 0.2 billion, which represents 33.3% of the total forecast growth for the decade. This phase of growth will be shaped by rising GERD prevalence, increasing adoption of minimally invasive procedures, and growing awareness among healthcare providers about the importance of advanced diagnostic capabilities. Service providers are expanding their device portfolios to address the growing complexity of modern gastroenterology treatment requirements.
From 2030 to 2035, the market is forecast to grow from USD 1.5 billion to USD 1.9 billion, adding another USD 0.4 billion, which constitutes 66.7% of the overall ten-year expansion. This period is expected to be characterized by expansion of magnetic sphincter augmentation devices, integration of advanced diagnostic equipment, and development of standardized treatment protocols across different healthcare institutions. The growing adoption of minimally invasive surgical procedures will drive demand for more sophisticated GERD devices and specialized medical expertise.
Between 2020 and 2025, the GERD device market experienced steady expansion, driven by increasing GERD prevalence rates and growing awareness of advanced treatment options following traditional pharmaceutical approaches. The market developed as healthcare facilities recognized the need for specialized equipment and training to properly service GERD patients with advanced diagnostic and treatment technologies. Healthcare providers and medical institutions began emphasizing proper device utilization procedures to maintain treatment efficacy and patient safety standards.
| Metric | Value |
|---|---|
| Market Value (2025) | USD 1.3 billion |
| Forecast Value (2035) | USD 1.9 billion |
| Forecast CAGR (2025–2035) | 3.6% |
GERD devices' superior diagnostic accuracy, minimally invasive treatment options, and enhanced patient outcomes make them attractive solutions for healthcare providers and patients seeking effective, long-term GERD management alternatives. Their advanced technological features, reduced recovery times, and improved quality of life benefits appeal to physicians prioritizing patient comfort and clinical efficacy over traditional pharmaceutical interventions.
Growing awareness of GERD complications, aging population demographics, and lifestyle-related risk factors is further propelling adoption, especially in hospitals, diagnostic centers, and ambulatory surgical centers. Rising healthcare expenditure, expanding medical device accessibility, and government initiatives supporting advanced medical technologies are also enhancing product availability and market penetration.
As technological innovation trends accelerate across medical specialties and patient-centric care becomes critical, the market outlook remains favorable. With healthcare providers and patients prioritizing treatment effectiveness, procedural safety, and long-term outcomes, GERD devices are well-positioned to expand across various clinical, diagnostic, and therapeutic applications.
The market is segmented by product, procedure, end user, and region. By product, the market is divided into diagnostic devices, manometry systems, pH monitoring systems, esophagoscopes and gastroscopes, treatment devices, ultrasonic surgical endostaplers, fundoplication devices, sphincter augmentation devices, and radiofrequency ablation devices.
Based on procedure, the market is categorized into diagnostic procedures, fundoplication procedures, radiofrequency thermal ablation, and magnetic sphincter augmentation. By end user, the market is divided into hospitals, diagnostic centers, and ambulatory surgical centers. Regionally, the market spans over North America, Europe, Asia Pacific, Latin America, the Middle East & Africa.
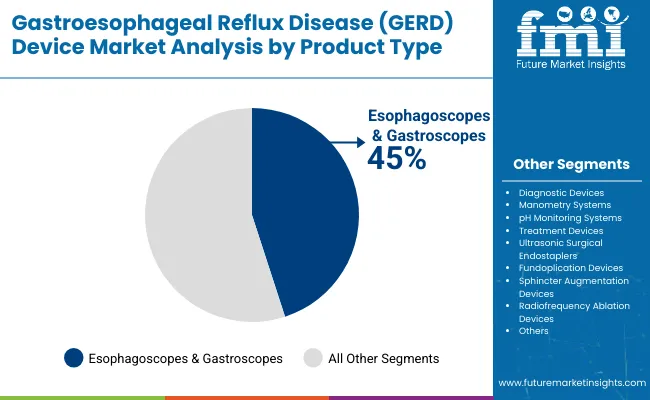
The esophagoscopes and gastroscopes segment holds a dominant position with 45% of the market share in the product category, owing to their superior diagnostic capabilities, advanced imaging technologies, and comprehensive clinical applications. These devices are widely used across diagnostic and treatment procedures due to their high-resolution visualization, minimally invasive nature, and essential role in GERD diagnosis and monitoring that appeal to healthcare providers and gastroenterology specialists alike.
They enable physicians and medical facilities to deliver precise diagnostic outcomes while maintaining patient comfort and procedural efficiency in clinical settings. As demand for accurate, non-invasive, and technologically advanced diagnostic tools grows, esophagoscopes and gastroscopes continue to gain preference in both hospital and outpatient medical environments.
Manufacturers are investing in advanced imaging technologies, artificial intelligence integration, and enhanced visualization systems to improve diagnostic accuracy, procedural outcomes, and clinical workflow efficiency. The segment is positioned to expand further as global healthcare preferences favor precision diagnostics, minimally invasive procedures, and evidence-based clinical decision-making.
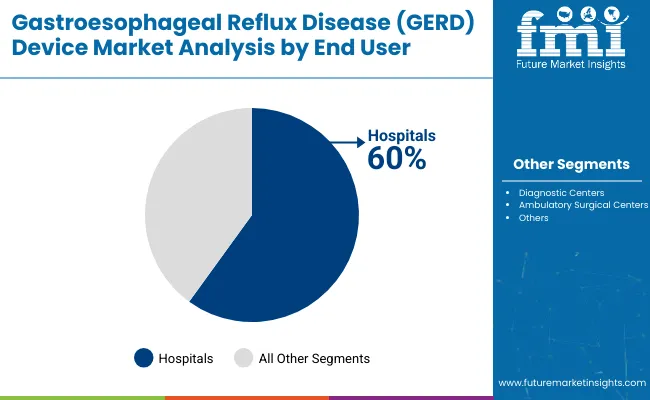
Hospitals remain the core end-user segment with 60% of the market share in 2025, as they provide comprehensive GERD management services, advanced diagnostic capabilities, and specialized treatment infrastructure that supports complex procedural requirements, emergency care, and multidisciplinary treatment approaches. Their extensive medical device infrastructure supports product adoption across diagnostic, therapeutic, and monitoring applications.
Hospitals also offer specialized gastroenterology departments, surgical facilities, and post-operative care capabilities that are essential for comprehensive GERD device utilization. This makes hospitals the dominant channel in modern healthcare delivery for GERD device adoption.
Ongoing demand for integrated healthcare services and the centralization of specialized medical procedures are key trends driving the sustained relevance of hospitals in this market segment.
In 2024, global GERD device adoption grew by 12% year-on-year, with North America taking a 40% share. Applications include advanced diagnostics, minimally invasive treatments, and comprehensive patient monitoring. Manufacturers are introducing specialized device technologies and next-generation therapeutic solutions that deliver superior clinical outcomes and enhanced patient experiences.
Magnetic sphincter augmentation devices now support evidence-based treatment positioning. Health-conscious treatment trends and minimally invasive procedure preferences support physician confidence. Technology providers increasingly supply ready-to-use device systems with integrated monitoring capabilities to reduce procedural complexity.
Advanced Technology Integration Accelerates GERD Device Demand
Healthcare providers and medical institutions are choosing GERD device solutions to achieve superior treatment outcomes, enhance procedural efficiency, and meet patient demands for minimally invasive, technologically advanced therapeutic options. In clinical testing, magnetic sphincter augmentation devices deliver up to 85% symptom reduction compared to traditional surgical approaches at 60-70%. Devices built with advanced technologies maintain efficacy throughout extended treatment cycles and patient follow-up periods.
In ready-to-use formats, integrated device systems help reduce procedural complexity while maintaining treatment effectiveness by up to 40%. GERD device applications are now being deployed for outpatient procedures, increasing adoption in sectors demanding minimally invasive treatment enhancement. These advantages help explain why GERD device adoption rates in gastroenterology practices rose 18% in 2024 across North America and Europe.
Regulatory Complexity, Cost Pressures and Limited Reimbursement Limit Growth
Market expansion faces constraints due to stringent regulatory requirements, high device costs, and limited insurance coverage for advanced GERD treatments. Device development costs can range from USD 2.5 to USD 8.0 million, depending on regulatory approval requirements and clinical trial complexities. These costs impact pricing and can significantly limit accessibility in certain healthcare markets.
FDA approval processes and international regulatory compliance add 18 to 24 months to product development cycles. Specialized training requirements and procedural learning curves extend implementation costs by 30-40% compared to conventional GERD treatments. Limited reimbursement coverage among insurance providers restricts widespread adoption, especially for innovative device technologies. These constraints make GERD device implementation challenging in cost-sensitive healthcare environments despite growing clinical benefits and physician interest.
| Countries | CAGR (2025 to 2035) |
|---|---|
| USA | 5.2% |
| India | 4.5% |
| China | 3.6% |
| Brazil | 3.2% |
| France | 2. 1 % |
| Germany | 2.0% |
| UK | 1.6% |
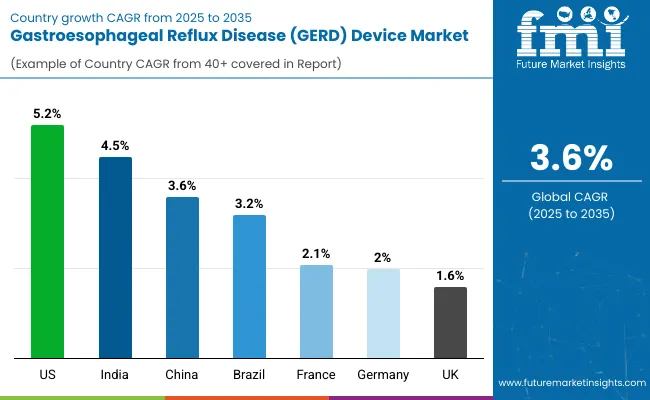
In the GERD device market, the U.S. leads with the highest projected CAGR of 5.2% from 2025 to 2035, driven by advanced healthcare infrastructure and technological innovation adoption. India follows with a CAGR of 4.5%, supported by increasing GERD prevalence and expanding healthcare access. China shows moderate growth at 3.6%, aligning with global average trends.
Brazil demonstrates steady expansion at 3.2%, benefiting from improving medical device accessibility. France shows steady growth at 2.1%, while Germany grows at 2.0%, supported by established healthcare systems and regulatory frameworks. The UK, with a CAGR of 1.6%, experiences gradual expansion influenced by mature market conditions but supported by advanced medical technology integration, reflecting regional differences in healthcare infrastructure and device adoption patterns.
The report covers an in-depth analysis of 40+ countries; seven top-performing OECD countries are highlighted below.
Revenue from GERD devices in the USA is projected to grow at a CAGR of 5.2% from 2025 to 2035, significantly exceeding the global average. Growth is fueled by advanced healthcare infrastructure, high medical device expenditure, and widespread adoption of minimally invasive surgical procedures across major medical centers, including Johns Hopkins, Mayo Clinic, and Cleveland Clinic networks. American healthcare providers are increasingly embracing innovative GERD treatment technologies as clinical evidence demonstrates superior patient outcomes and procedural efficiency. Advanced reimbursement frameworks and medical device innovation support market penetration.
The GERD device market in India is anticipated to expand at a CAGR of 4.5% from 2025 to 2035, exceeding the global rate by 0.9%. Growth is centered on increasing GERD prevalence, expanding healthcare access, and rising medical device adoption in Mumbai, Delhi, and Bangalore metropolitan areas. Advanced medical technologies and international healthcare partnerships are being deployed for specialized gastroenterology applications in both public and private healthcare sectors. Government healthcare initiatives and medical tourism growth support practical GERD device implementation across diverse clinical environments.
Sales of GERD devices in China are slated to grow at a CAGR of 3.6% from 2025 to 2035, matching the global average. Growth has been concentrated in urban healthcare expansion and medical technology adoption in the Beijing, Shanghai, and Guangzhou regions. GERD device utilization is shifting from limited specialty use toward mainstream gastroenterology applications and integrated treatment protocols. Domestic healthcare policy support and international medical device collaborations lead deployment strategies.
The demand for GERD devices in Brazil is expected to increase at a CAGR of 3.2% from 2025 to 2035, underperforming the global average by 0.4%. Demand is driven by improving healthcare infrastructure and expanding access to advanced medical technologies in São Paulo, Rio de Janeiro, and Brasília markets. Healthcare providers and medical institutions are increasingly adopting GERD devices for treatment enhancement and patient outcome improvement. However, economic constraints and limited reimbursement coverage restrict broader market penetration.
Revenue from GERD devices in France is projected to rise at a CAGR of 2.1% from 2025 to 2035, supported by steady demand for advanced gastroenterology treatments and established medical device adoption patterns. Urban medical centers like Paris, Lyon, and Marseille are experiencing consistent growth in specialized GERD treatment capabilities, evidence-based medical protocols, and integrated healthcare delivery systems. Domestic healthcare institutions are leveraging advanced GERD devices to meet clinical excellence standards and regulatory compliance requirements.
The GERD device market in Germany is expected to grow at a CAGR of 2.0% from 2025 to 2035, aligning with European market trends. Growth is driven by established healthcare excellence standards and advanced medical technology integration in Berlin, Munich, and Hamburg medical centers. Premium healthcare facilities and university medical centers are maintaining GERD device accessibility, while medical institutions incorporate these technologies into comprehensive treatment protocols. Healthcare system efficiency and clinical outcome optimization maintain steady adoption levels.
The demand for GERD devices in the UK is projected to expand at a CAGR of 1.6% from 2025 to 2035, below the global average due to established healthcare frameworks and budget optimization priorities. Growth is concentrated in specialized gastroenterology centers, including London, Manchester, and Edinburgh medical facilities, where clinical excellence and treatment innovation are emphasized. NHS guidelines and private healthcare adoption support GERD device integration, while healthcare providers incorporate these technologies into evidence-based treatment protocols.
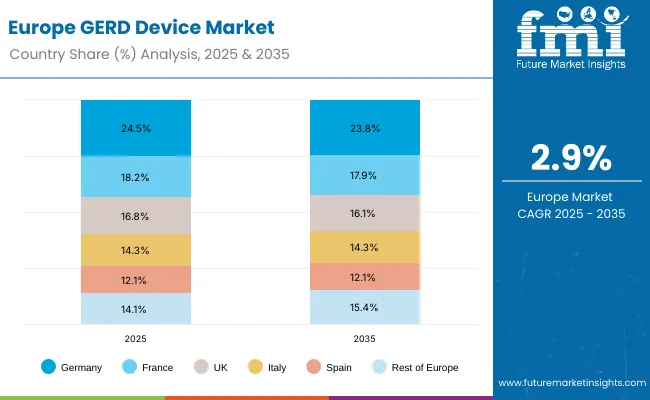 The GERD device market in Europe is projected to grow from USD 315.2 million in 2025 to USD 421.4 million by 2035, registering a CAGR of 2.9% over the forecast period. Germany is expected to maintain its leadership position with a 24.5% market share in 2025, declining slightly to 23.8% by 2035, supported by its advanced healthcare infrastructure and established gastroenterology centers. France follows with an 18.2% share in 2025, projected to ease to 17.9% by 2035, driven by comprehensive medical device adoption in major urban hospitals.
The United Kingdom holds a 16.8% share in 2025, expected to decrease marginally to 16.1% by 2035 due to healthcare budget constraints. Italy commands a 14.3% share in 2025, while Spain accounts for 12.1% in 2025, both maintaining broadly stable positions through the forecast horizon. The Rest of Europe region is anticipated to gain momentum, expanding its collective share from 14.1% in 2025 to 15.4% by 2035, attributed to increasing GERD device adoption in Nordic countries and emerging Eastern European healthcare markets seeking advanced diagnostic capabilities.
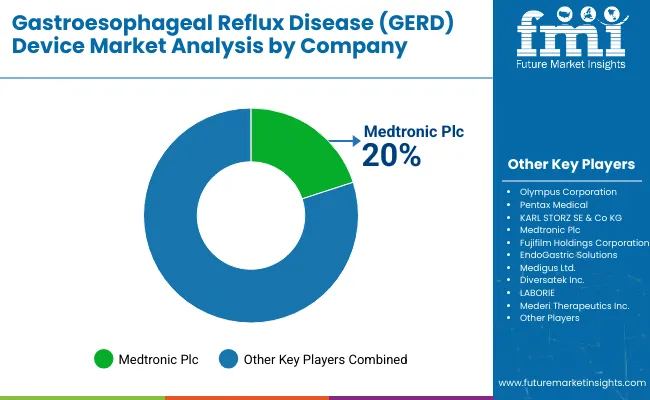
The GERD device market is moderately consolidated, featuring a mix of established medical device manufacturers, specialized gastroenterology technology providers, and innovative treatment solution developers with varying degrees of technological expertise, clinical evidence, and global distribution capabilities. Medtronic Plc leads the market with 20% share, supplying advanced magnetic sphincter augmentation systems, comprehensive treatment portfolios, and established clinical outcomes for hospitals, diagnostic centers, and ambulatory surgical centers. Their strength lies in extensive R&D capabilities, regulatory compliance expertise, and long-standing relationships with gastroenterology specialists.
Olympus Corporation and Pentax Medical differentiate through superior endoscopic technologies, diagnostic imaging innovations, and application-specific device formulations that cater to precision diagnostics and minimally invasive treatment segments. KARL STORZ SE & Co KG and Fujifilm Holdings Corporation focus on specialized surgical instrumentation and advanced imaging solutions, addressing growing demand from surgical centers, medical institutions, and international healthcare markets.
Regional specialists and emerging technology companies emphasize procedural innovation, patient outcome optimization, and next-generation device development, creating value in specialized clinical applications and emerging therapeutic markets.
Entry barriers remain significant, driven by challenges in regulatory approval processes, clinical evidence requirements, and compliance with medical device safety standards across multiple healthcare environments. Competitiveness increasingly depends on technological innovation, clinical efficacy validation, and market access expertise for diverse gastroenterology and surgical applications.
| Items | Value |
|---|---|
| Quantitative Units (2025) | USD 1.3 billion |
| Product Type | Diagnostic Devices, Manometry Systems, pH Monitoring Systems, Esophagoscopes and Gastroscopes, Treatment Devices, Ultrasonic Surgical Endostaplers , Fundoplication Devices, Sphincter Augmentation Devices, Radiofrequency Ablation Devices |
| Procedure | Diagnostic Procedures, Fundoplication Procedures, Radiofrequency Thermal Ablation, Magnetic Sphincter Augmentation |
| End User | Hospitals, Diagnostic Centers, Ambulatory Surgical Centers |
| Regions Covered | North America, Europe, Asia Pacific, Latin America, Middle East & Africa |
| Countries Covered | United States, Canada, United Kingdom, Germany, France, China, Japan, India, Brazil, Australia and 40+ Countries |
| Key Companies Profiled | Olympus Corporation, Pentax Medical, KARL STORZ SE & Co KG, Medtronic Plc, Fujifilm Holdings Corporation, EndoGastric Solutions, Medigus Ltd., Diversatek Inc., LABORIE, Mederi Therapeutics Inc. |
| Additional Attributes | Dollar sales by product and procedure, with regional demand, competition, provider preferences, diagnostic integration, innovations in magnetic sphincter augmentation and ablation, and adoption of smart imaging and monitoring solutions for patient care |
The global GERD device market is estimated to be valued at USD 1.3 billion in 2025.
The market size for GERD device is projected to reach USD 1.9 billion by 2035.
The GERD device market is expected to grow at a CAGR of 3.6% between 2025 and 2035.
The esophagoscopes and gastroscopes segment is projected to lead the GERD device market with a 45% market share in 2025.
In terms of end user, hospitals are expected to command a 60% share in the GERD device market in 2025.


Our Research Products

The "Full Research Suite" delivers actionable market intel, deep dives on markets or technologies, so clients act faster, cut risk, and unlock growth.

The Leaderboard benchmarks and ranks top vendors, classifying them as Established Leaders, Leading Challengers, or Disruptors & Challengers.

Locates where complements amplify value and substitutes erode it, forecasting net impact by horizon

We deliver granular, decision-grade intel: market sizing, 5-year forecasts, pricing, adoption, usage, revenue, and operational KPIs—plus competitor tracking, regulation, and value chains—across 60 countries broadly.

Spot the shifts before they hit your P&L. We track inflection points, adoption curves, pricing moves, and ecosystem plays to show where demand is heading, why it is changing, and what to do next across high-growth markets and disruptive tech

Real-time reads of user behavior. We track shifting priorities, perceptions of today’s and next-gen services, and provider experience, then pace how fast tech moves from trial to adoption, blending buyer, consumer, and channel inputs with social signals (#WhySwitch, #UX).

Partner with our analyst team to build a custom report designed around your business priorities. From analysing market trends to assessing competitors or crafting bespoke datasets, we tailor insights to your needs.
Supplier Intelligence
Discovery & Profiling
Capacity & Footprint
Performance & Risk
Compliance & Governance
Commercial Readiness
Who Supplies Whom
Scorecards & Shortlists
Playbooks & Docs
Category Intelligence
Definition & Scope
Demand & Use Cases
Cost Drivers
Market Structure
Supply Chain Map
Trade & Policy
Operating Norms
Deliverables
Buyer Intelligence
Account Basics
Spend & Scope
Procurement Model
Vendor Requirements
Terms & Policies
Entry Strategy
Pain Points & Triggers
Outputs
Pricing Analysis
Benchmarks
Trends
Should-Cost
Indexation
Landed Cost
Commercial Terms
Deliverables
Brand Analysis
Positioning & Value Prop
Share & Presence
Customer Evidence
Go-to-Market
Digital & Reputation
Compliance & Trust
KPIs & Gaps
Outputs
Full Research Suite comprises of:
Market outlook & trends analysis
Interviews & case studies
Strategic recommendations
Vendor profiles & capabilities analysis
5-year forecasts
8 regions and 60+ country-level data splits
Market segment data splits
12 months of continuous data updates
DELIVERED AS:
PDF EXCEL ONLINE
Gastroesophageal Reflux Disease Therapeutics Market Analysis - Innovations & Forecast 2025 to 2035
Animal Gastroesophageal Reflux Disease Market Size and Share Forecast Outlook 2025 to 2035
Device-Embedded Biometric Authentication Market Size and Share Forecast Outlook 2025 to 2035
Disease Resistant Mask Market Analysis - By Type, Material, End-User, Distribution Channel, and Region - Trends, Growth & Forecast 2025 to 2035
Gastroesophageal Junction Adenocarcinoma Therapeutics Market by Drug, Diagnosis, Treatment, Distribution Channel, and Region through 2035
IoT Device Management Market Size and Share Forecast Outlook 2025 to 2035
IoT Device Management Platform Market Size and Share Forecast Outlook 2025 to 2035
Drug Device Combination Products Market Size and Share Forecast Outlook 2025 to 2035
Rare Disease Clinical Trials Market Size and Share Forecast Outlook 2025 to 2035
The lung disease therapeutics market is segmented by disease type, treatment type and distribution channel from 2025 to 2035
Rare Disease Gene Therapy Market
FBAR Devices Market
Swine Disease Diagnostic Kit Market Size and Share Forecast Outlook 2025 to 2035
Liver Disease Diagnostics Market Size and Share Forecast Outlook 2025 to 2035
Fabry Disease Market Size and Share Forecast Outlook 2025 to 2035
X-Ray Device Market Size and Share Forecast Outlook 2025 to 2035
Power Device Analyzer Market Growth – Trends & Forecast 2025 to 2035
Byler Disease Market
Snare devices Market
C-Arms Devices Market Size and Share Forecast Outlook 2025 to 2035

Thank you!
You will receive an email from our Business Development Manager. Please be sure to check your SPAM/JUNK folder too.
Chat With
MaRIA