C-Arms Devices Market Size and Share Forecast Outlook 2025 to 2035

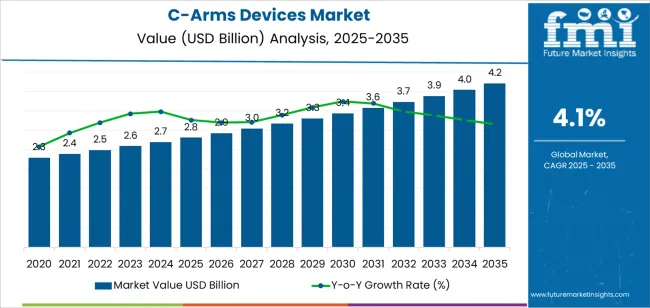
The C-Arms devices market is experiencing sustained growth, fueled by rising surgical procedure volumes and increasing demand for real-time imaging in minimally invasive interventions. Medical equipment manufacturers have reported strong year-over-year demand for C-Arms, particularly in high-throughput clinical environments such as orthopaedics, trauma centers, and cardiovascular operating suites.

Hospital procurement trends have favored systems that provide superior imaging clarity, reduced radiation dose, and compatibility with modern operating room workflows. Additionally, the global expansion of ambulatory surgical centers and specialty clinics has further accelerated market adoption.

Advancements in flat-panel detectors, 3D imaging capability, and digital connectivity have enhanced procedural precision and patient outcomes, reinforcing the importance of C-Arms in image-guided surgeries. Clinical guidelines have increasingly recommended the integration of mobile imaging solutions in orthopaedic and trauma care settings to improve intraoperative decision-making. Looking ahead, the market is expected to benefit from growing adoption of mobile C-Arms in emerging economies, innovations in AI-based image processing, and rising demand for outpatient surgical care across key regions.
Quick Stats for C-Arms Devices Market

  • C-Arms Devices Market Industry Value (2025): USD 2.8 billion
  • C-Arms Devices Market Forecast Value (2035): USD 4.2 billion
  • C-Arms Devices Market Forecast CAGR: 4.1%
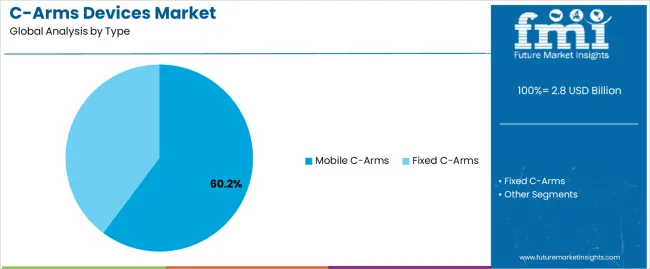
  • Leading Segment in C-Arms Devices Market in 2025: Mobile C-Arms (60.2%)
  • Key Growth Region in C-Arms Devices Market: North America, Asia-Pacific, Europe
  • Top Key Players in C-Arms Devices Market: GE Healthcare Inc., Philips Healthcare, Siemens AG, Hologic Corp, BMI Biomedical International s.r.l., DMS Health Technologies, Medonica Co., Ltd., Gemss Co. Ltd, Shimadzu Corp

C Arms Devices Market Market Value Analysis

Metric Value
C-Arms Devices Market Estimated Value in (2025 E) USD 2.8 billion
C-Arms Devices Market Forecast Value in (2035 F) USD 4.2 billion
Forecast CAGR (2025 to 2035) 4.1%

Segmental Analysis

The market is segmented by Type and Application and region. By Type, the market is divided into Mobile C-Arms and Fixed C-Arms. In terms of Application, the market is classified into Orthopaedics And Trauma, Cardiology, Gastroenterology, Neurology, Oncology, and Other Applications. Regionally, the market is classified into North America, Latin America, Western Europe, Eastern Europe, Balkan & Baltic Countries, Russia & Belarus, Central Asia, East Asia, South Asia & Pacific, and the Middle East & Africa.
Insights into the Type Segment: Mobile C-Arms

C Arms Devices Market Analysis By Type

The Mobile C-Arms segment is projected to account for 60.20% of the C-Arms devices market revenue in 2025, maintaining its leadership in the device type category. Growth in this segment has been driven by the flexibility, portability, and broad clinical utility offered by mobile systems in operating rooms and outpatient care environments.

Medical equipment manufacturers have enhanced mobile C-Arm designs to deliver high-resolution imaging with compact footprints, supporting procedures in constrained clinical spaces. Additionally, mobile C-Arms have enabled rapid deployment in trauma, emergency, and interventional settings without the need for fixed imaging infrastructure.

Hospitals and surgical centers have preferred mobile units for their ability to support a wide range of procedures, including orthopaedics, urology, pain management, and cardiovascular interventions. Continuous upgrades in software integration, radiation dose optimization, and flat-panel detector technology have further increased their clinical value. With the growing shift toward minimally invasive and day-care procedures, the Mobile C-Arms segment is expected to remain the primary driver of market expansion.
Insights into the Application Segment: Orthopaedics and Trauma

C Arms Devices Market Analysis By Application

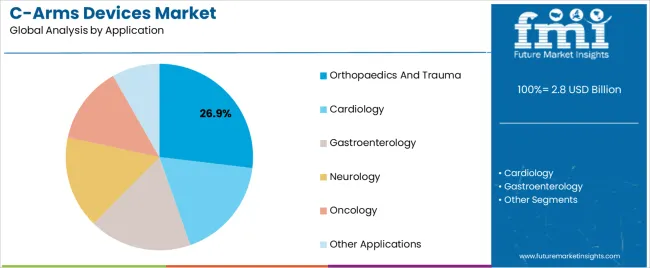
The Orthopaedics and Trauma segment is projected to contribute 26.9% of the C-Arms devices market revenue in 2025, holding the largest share among application areas. This growth has been supported by the increasing global burden of musculoskeletal injuries, age-related fractures, and the rising number of orthopedic surgeries.

Clinical best practices have emphasized the use of intraoperative imaging to ensure alignment accuracy during fracture fixation, joint replacement, and spinal surgeries. Surgeons have relied on C-Arms to visualize bone structures in real time, improving procedural outcomes and reducing post-surgical complications.

Additionally, trauma centers and emergency departments have integrated C-Arms to manage acute injuries requiring immediate imaging support. Equipment procurement data from hospitals has reflected consistent demand for systems optimized for orthopaedic workflows, with features such as enhanced bone contrast and navigation compatibility. As the incidence of road traffic accidents and sports-related injuries continues to rise, the Orthopaedics and Trauma segment is expected to sustain its leading position in driving C-Arms device utilization.

Semi Annual Market Update

The above table presents the expected CAGR for the global C-arm devices market over numerous semi-annual periods spanning from 2025 to 2035. In the first half (H1) of the decade from 2025 to 2035, the industry is predicted to surge at a CAGR of 4.7%, followed by a slightly drop in growth rate of 4.5% in the second half (H2) of the same decade.

Particular Value CAGR
H1 4.7% (2025 to 2035)
H2 4.5% (2025 to 2035)
H1 4.3% (2025 to 2035)
H2 3.9% (2025 to 2035)

Moving into the subsequent period, from H1 2025 to H2 2035, the CAGR is projected to decrease slightly to 4.3% in the first half and remain relatively low at 3.9% in the second half.

Key Industry Highlights

Technological Innovations in C-Arm Devices is likely to Accelerate Market Growth

Continuous innovations in C-Arm technology have helped to drive market growth. Manufacturers are continually inventing to improve image quality, increase functionality, and add new features.

C-Arms systems have seen significant technological improvements. The incorporation of 3D imaging capabilities allows for volumetric reconstruction of anatomical structures, facilitating precise visualization and spatial assessment.

The development of cone beam CT technology provides real time 3D imaging, which is very useful in interventional radiology and orthopedics. Improved image guided navigation, dosage optimization features, and interaction with other imaging modalities all contribute to the improvement of C-arm systems, transforming numerous medical specializations and improving patient outcomes.

High Expenses related to C-Arms Imaging Equipment to Stifle Market Growth

The high cost of C-Arms imaging equipment is a key impediment to their industry adoption. C-Arm equipment is expensive to create, maintain, and upgrade, representing a considerable commitment for healthcare organizations. The high cost may restrict adoption, especially in underdeveloped countries with limited healthcare budgets.

C-Arm systems are complex and require specific training to function properly. Healthcare providers may have difficulties in educating their employees or hiring personnel with the appropriate skills to operate and interpret C-Arm pictures. The intricacy of the technology can impede wider acceptance and use.

C-Arm systems create real time pictures using Xrays, exposing patients and healthcare staff to radiation. Although contemporary C-Arm devices are intended to reduce radiation exposure, worries concerning radiation dangers remain. The considerations may impact the adoption of C-Arm systems and prompt healthcare practitioners to make careful decisions.

C-Arm technology is not standardized among manufacturers. This can lead to compatibility concerns, interoperability issues, and difficulty in connecting C-Arm systems with other medical devices or healthcare information systems. The absence of standards might hamper seamless workflow integration, restraining the market size.

2020 to 2024 Global C-Arms Devices Demand Analysis Compared to Demand Forecasts for 2025 to 2035

Global C-Arms Devices demand increased at a CAGR of 5.1% from 2020 to 2025. For the next ten years (2025 to 2035), projections are that expenditure on C-Arms Devices will reach a CAGR of 4.1%.

During the historical period, the market grew owing to advances in imaging technology and a rising number of minimally invasive operations. C-Arms, which provide real time, high resolution imaging, have proven crucial in a variety of medical specialties, including orthopedics, cardiology, and neurosurgery.

As per C-arms devices market forecast, the industry growth is anticipated to slow down driven by continuous technical progress in C-Arms, such as the incorporation of 3D imaging and digital flat-panel detectors, improves their diagnostic and therapeutic capacities. The advances ensure that C-Arms remain essential equipment in current surgical operations.

The rising frequency of chronic disorders, notably cardiovascular and orthopedic ailments, is predicted to keep demand stable. The aging global population, which is prone to age related health concerns that necessitate diagnostic imaging and surgical intervention, fuels the global industry size.

As healthcare systems throughout the world adjust to the demographic shifts, investment in sophisticated imaging is anticipated to propel the global C-arms devices market size.

Increasing healthcare infrastructure in emerging economies promotes global C-arms devices market size. Governments and corporate entities in the regions are investing in advanced medical equipment to improve healthcare delivery, opening up new C-arms devices market opportunity.

The global C-arms devices market size is likely to slow significantly due to cost cutting initiatives in healthcare spending and the significant initial investment required for new imaging technology.

Industry Concentration

In the dynamic environment of the C-arms devices market, market concentration among competitors is a key factor in determining the market destiny. Over the projection period of 2025 to 2035, the industry is expected to consolidate significantly, with Tier 1 and Tier 2 companies accounting for a sizable percentage of the total revenue of USD 2213.2 million.

Tier 1 businesses are likely to dominate the industry, with a significant 67% share of total income. The industry leaders have vast resources, significant technological skills, and a strong worldwide presence, which allows them to maintain a competitive advantage in the industry.

Tier 1 firms are well positioned to capitalize on new possibilities and maintain industry leadership by prioritizing innovation, strategic alliances, and effective marketing strategies.

Tier 2 players, on the other hand, play an important role, accounting for 23% of total income despite their lesser industry share. The Tier 2 companies frequently specialize in niche markets or locations, providing unique solutions suited to specific consumer requirements.

Despite constraints such as limited resources and fierce competition, Tier 2 firms use their adaptability, and customer centric attitude to strengthen their position in the industry.

The concentration of industry share among Tier 1 and Tier 2 competitors emphasizes the competitive dynamics and the significance of strategic positioning in the C-arms device market.

As industry consolidation proceeds, firms at all levels must stay nimble, adaptive, and customer centric in order to flourish in an increasingly competitive environment. Industry participants may influence the future success of the C-arms devices market by utilizing their strengths, responding to changing client expectations, and embracing innovation.

Country-wise Insights

The section below covers the industry analysis for the C-Arms devices market for different countries. Industry demand analysis on key countries in several regions of the globe, including North America, Asia Pacific, Europe, and others, is provided.

Canada is anticipated to remain at the forefront in North America, with a value share of 4% through 2035. In Asia Pacific, China is projected to witness a CAGR of 5.8% by 2035.

Countries CAGR 2025 to 2035
China 5.8%
India 5.2%
Italy 3.9%
France 3.7%
The United States 3.4%

Growing Demand for Minimally Invasive Treatments in China is Driving the Industry Demand

China is predicted to augment at a CAGR of 5.8% during the projected period. The C-arms devices market in China is expanding rapidly due to rising demand for minimally invasive treatments.

As healthcare in China moves toward more modern and patient friendly treatment choices, there is a rising demand for operations that result in shorter recovery periods, fewer problems, and better patient outcomes. C-arms devices let surgeons do minimally invasive operations by giving real time image guidance throughout the process.

The development in chronic illnesses, such as cardiovascular ailments and orthopedic issues, along with an aging population, is pushing the need for diagnostic and interventional treatments aided by C-Arm equipment. Favorable government efforts and healthcare reforms in China that encourage the use of innovative medical technology drive the regional C-arms market size and growth.

Favorable Reimbursement Regulations are Propelling the Industry Demand in Italy

Italy is expected to thrive at a CAGR of 3.9% during the assessment period. In Italy, favorable reimbursement policies are fueling the growing demand for medical equipment. With a strong healthcare system that prioritizes patient access to novel therapies, Italy has adopted payment rules that encourage the use of modern medical technology, such as C-arm devices.

The laws give financial incentives for healthcare professionals to use cutting-edge imaging technology, allowing for faster diagnosis, more effective treatment, and better patient outcomes.

The reimbursement regulations provide an atmosphere that encourages healthcare institutions to invest in cutting edge medical technology, hence boosting industry growth.

Technological Advancements are likely to Drive the Industry in the United States

The United States is projected to ascend at a CAGR of 3.4% during the forecast period. Technological innovations are a key factor driving the growth of the C-Arms Devices industry in the United States.

Continuous advances in imaging technology, such as the incorporation of digital imaging, and 3D imaging capabilities, have transformed medical imaging and surgical procedures. The developments have greatly improved the accuracy, resolution, and efficiency of C-Arms devices, making them essential instruments in a variety of medical disciplines.

In the United States, healthcare facilities are progressively implementing C-Arms devices with cutting edge capabilities to increase diagnostic accuracy, optimize treatment planning, and improve intraoperative vision.

Advanced C-Arms devices are in great demand in disciplines such as orthopedics, cardiology, neurosurgery, and interventional radiology, where real time imaging is important for guiding complex treatments and delivering the best possible patient results.

Technological improvements have resulted in the creation of hybrid operating rooms, in which C-Arms devices are combined with other imaging modalities and surgical equipment, increasing their utility and boosting industry growth in the United States.

Category-Wise Insights

The section contains information about the leading segments in the industry. By application, the cardiology segment is held an industry share of 36.3% throughout 2025. The Mobile C-Arms segment held an industry share of 60.2% in 2025.

Cardiology Take the Lead in the C-Arms Devices Industry

Application Cardiology
Value Share (2025) 36.3%

The cardiology category is expected to lead the C-arms devices market by 2025, accounting for 36.3%. This growth is due to the increasing importance of improved imaging technology in cardiovascular surgeries.

C-Arms, with their real time imaging capabilities, are critical in detecting and directing treatments for a wide range of cardiovascular disorders, including coronary artery disease and structural heart abnormalities.

The increased frequency of cardiac conditions, along with the growing need for minimally invasive operations, is boosting the use of C-Arms devices in cardiology.

Continuous technical improvements, such as the incorporation of 3D imaging and image guided navigation systems, increase the utility and adaptability of C-Arms devices for complicated cardiac treatments. As a result, the cardiology segment is expected to drive the global C-arms devices market size.

Mobile C-Arms Segment to Drive the Industry Growth

Product Mobile C-Arms
Value Share (2025) 60.2%

In 2025, the Mobile C-Arms segment is predicted to lead the C-arms devices market, with an industry share of 60.2%. This growth is a reflection of the increasing popularity of mobile C-arm systems due to their mobility, portability, and enhanced imaging capabilities.

Mobile C-arms provide versatility in a variety of medical environments, such as operating rooms, emergency departments, and outpatient clinics, allowing for real time imaging during surgical operations and minimally invasive treatments.

Advances in software integration and connection capabilities improve workflow efficiency and picture quality, accelerating acceptance among healthcare providers. The Mobile C-Arms segment is predicted to lead the application segment further propelling the global C-arms devices market size.
Competitive Landscape

C Arms Devices Market Analysis By Company

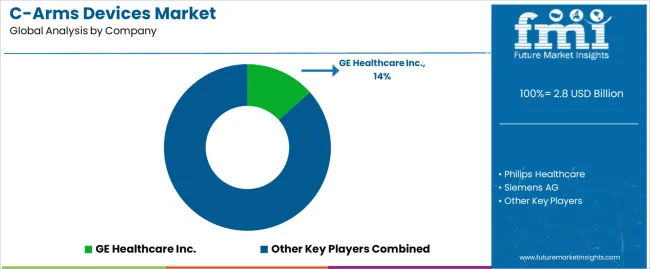
The C-arms devices market is extremely competitive, driven by technological improvements, growing healthcare spending, and the rising frequency of chronic conditions that need diagnostic imaging. The industry is dominated by leading companies who use their vast product portfolios and global distribution networks to stay ahead of the competition.

Innovation is a key competitive aspect, with businesses investing heavily in research and development to produce updated C-arm systems with higher picture quality, lower radiation doses, and more flexibility. The use of artificial intelligence and machine learning into imaging systems is an emerging trend, which improves diagnostic accuracy and efficiency.

Emerging firms and startups are also making significant progress, frequently focusing on specialized niches or offering cost effective solutions customized to emerging markets. Companies frequently get into strategic alliances, mergers, and acquisitions in order to grow their industry presence and technical capabilities.

Recent Developments

  • In May 2025, GE HealthCare, a global leader in medical technology, pharmaceutical diagnostics, and digital solutions, and Medis Medical Imaging, a leading cardiac imaging software company, have announced a collaboration to advance precision care in the diagnosis and treatment of coronary artery disease (CAD).
  • In May 2025, Royal Philips, a global pioneer in health technology, has announced a strategic agreement to integrate smartQare's sophisticated solution, viQtor, with Philips' world-class clinical patient monitoring systems. This collaboration seeks to allow the next generation of continuous patient monitoring both inside and outside of hospitals, beginning in Europe.

Leading C-Arms Devices Brands

  • GE Healthcare Inc.
  • Philips Healthcare
  • Siemens AG
  • Hologiccorp
  • BMI Biomedical International s.r.l.
  • DMS Health Technologies
  • Medonica Co., Ltd.
  • Gemss Co. Ltd
  • Shimadzu Corp

Key Segments of the Report

By Type:

The C-Arms devices industry is classified into Fixed C-Arms and Mobile C-Arms.

By Application:

The C-Arms devices industry is classified into cardiology, gastroenterology, neurology, orthopaedics and trauma, oncology and other applications.

By Region:

Analysis of the C-Arms devices industry has been carried out in key countries of North America, Latin America, Western Europe, South Asia, East Asia, Eastern Europe and Middle East & Africa.

Frequently Asked Questions

How big is the c-arms devices market in 2025?

The global c-arms devices market is estimated to be valued at USD 2.8 billion in 2025.

What will be the size of c-arms devices market in 2035?

The market size for the c-arms devices market is projected to reach USD 4.2 billion by 2035.

How much will be the c-arms devices market growth between 2025 and 2035?

The c-arms devices market is expected to grow at a 4.1% CAGR between 2025 and 2035.

What are the key product types in the c-arms devices market?

The key product types in c-arms devices market are mobile c-arms and fixed c-arms.

Which application segment to contribute significant share in the c-arms devices market in 2025?

In terms of application, orthopaedics and trauma segment to command 26.9% share in the c-arms devices market in 2025.

Table of Content

  1. Executive Summary
    • Global Market Outlook
    • Demand to side Trends
    • Supply to side Trends
    • Technology Roadmap Analysis
    • Analysis and Recommendations
  2. Market Overview
    • Market Coverage / Taxonomy
    • Market Definition / Scope / Limitations
  3. Market Background
    • Market Dynamics
      • Drivers
      • Restraints
      • Opportunity
      • Trends
    • Scenario Forecast
      • Demand in Optimistic Scenario
      • Demand in Likely Scenario
      • Demand in Conservative Scenario
    • Opportunity Map Analysis
    • Product Life Cycle Analysis
    • Supply Chain Analysis
    • Investment Feasibility Matrix
    • Value Chain Analysis
    • PESTLE and Porter’s Analysis
    • Regulatory Landscape
    • Regional Parent Market Outlook
    • Production and Consumption Statistics
    • Import and Export Statistics
  4. Global Market Analysis 2020 to 2024 and Forecast, 2025 to 2035
    • Historical Market Size Value (USD Million) Analysis, 2020 to 2024
    • Current and Future Market Size Value (USD Million) Projections, 2025 to 2035
      • Y to o to Y Growth Trend Analysis
      • Absolute $ Opportunity Analysis
  5. Global Market Pricing Analysis 2020 to 2024 and Forecast 2025 to 2035
  6. Global Market Analysis 2020 to 2024 and Forecast 2025 to 2035, By Type
    • Introduction / Key Findings
    • Historical Market Size Value (USD Million) Analysis By Type , 2020 to 2024
    • Current and Future Market Size Value (USD Million) Analysis and Forecast By Type , 2025 to 2035
      • Mobile C-Arms
      • Fixed C-Arms
    • Y to o to Y Growth Trend Analysis By Type , 2020 to 2024
    • Absolute $ Opportunity Analysis By Type , 2025 to 2035
  7. Global Market Analysis 2020 to 2024 and Forecast 2025 to 2035, By Application
    • Introduction / Key Findings
    • Historical Market Size Value (USD Million) Analysis By Application, 2020 to 2024
    • Current and Future Market Size Value (USD Million) Analysis and Forecast By Application, 2025 to 2035
      • Orthopaedics And Trauma
      • Cardiology
      • Gastroenterology
      • Neurology
      • Oncology
      • Other Applications
    • Y to o to Y Growth Trend Analysis By Application, 2020 to 2024
    • Absolute $ Opportunity Analysis By Application, 2025 to 2035
  8. Global Market Analysis 2020 to 2024 and Forecast 2025 to 2035, By Region
    • Introduction
    • Historical Market Size Value (USD Million) Analysis By Region, 2020 to 2024
    • Current Market Size Value (USD Million) Analysis and Forecast By Region, 2025 to 2035
      • North America
      • Latin America
      • Western Europe
      • Eastern Europe
      • East Asia
      • South Asia and Pacific
      • Middle East & Africa
    • Market Attractiveness Analysis By Region
  9. North America Market Analysis 2020 to 2024 and Forecast 2025 to 2035, By Country
    • Historical Market Size Value (USD Million) Trend Analysis By Market Taxonomy, 2020 to 2024
    • Market Size Value (USD Million) Forecast By Market Taxonomy, 2025 to 2035
      • By Country
        • USA
        • Canada
        • Mexico
      • By Type
      • By Application
    • Market Attractiveness Analysis
      • By Country
      • By Type
      • By Application
    • Key Takeaways
  10. Latin America Market Analysis 2020 to 2024 and Forecast 2025 to 2035, By Country
    • Historical Market Size Value (USD Million) Trend Analysis By Market Taxonomy, 2020 to 2024
    • Market Size Value (USD Million) Forecast By Market Taxonomy, 2025 to 2035
      • By Country
        • Brazil
        • Chile
        • Rest of Latin America
      • By Type
      • By Application
    • Market Attractiveness Analysis
      • By Country
      • By Type
      • By Application
    • Key Takeaways
  11. Western Europe Market Analysis 2020 to 2024 and Forecast 2025 to 2035, By Country
    • Historical Market Size Value (USD Million) Trend Analysis By Market Taxonomy, 2020 to 2024
    • Market Size Value (USD Million) Forecast By Market Taxonomy, 2025 to 2035
      • By Country
        • Germany
        • UK
        • Italy
        • Spain
        • France
        • Nordic
        • BENELUX
        • Rest of Western Europe
      • By Type
      • By Application
    • Market Attractiveness Analysis
      • By Country
      • By Type
      • By Application
    • Key Takeaways
  12. Eastern Europe Market Analysis 2020 to 2024 and Forecast 2025 to 2035, By Country
    • Historical Market Size Value (USD Million) Trend Analysis By Market Taxonomy, 2020 to 2024
    • Market Size Value (USD Million) Forecast By Market Taxonomy, 2025 to 2035
      • By Country
        • Russia
        • Poland
        • Hungary
        • Balkan & Baltic
        • Rest of Eastern Europe
      • By Type
      • By Application
    • Market Attractiveness Analysis
      • By Country
      • By Type
      • By Application
    • Key Takeaways
  13. East Asia Market Analysis 2020 to 2024 and Forecast 2025 to 2035, By Country
    • Historical Market Size Value (USD Million) Trend Analysis By Market Taxonomy, 2020 to 2024
    • Market Size Value (USD Million) Forecast By Market Taxonomy, 2025 to 2035
      • By Country
        • China
        • Japan
        • South Korea
      • By Type
      • By Application
    • Market Attractiveness Analysis
      • By Country
      • By Type
      • By Application
    • Key Takeaways
  14. South Asia and Pacific Market Analysis 2020 to 2024 and Forecast 2025 to 2035, By Country
    • Historical Market Size Value (USD Million) Trend Analysis By Market Taxonomy, 2020 to 2024
    • Market Size Value (USD Million) Forecast By Market Taxonomy, 2025 to 2035
      • By Country
        • India
        • ASEAN
        • Australia & New Zealand
        • Rest of South Asia and Pacific
      • By Type
      • By Application
    • Market Attractiveness Analysis
      • By Country
      • By Type
      • By Application
    • Key Takeaways
  15. Middle East & Africa Market Analysis 2020 to 2024 and Forecast 2025 to 2035, By Country
    • Historical Market Size Value (USD Million) Trend Analysis By Market Taxonomy, 2020 to 2024
    • Market Size Value (USD Million) Forecast By Market Taxonomy, 2025 to 2035
      • By Country
        • Kingdom of Saudi Arabia
        • Other GCC Countries
        • Turkiye
        • South Africa
        • Other African Union
        • Rest of Middle East & Africa
      • By Type
      • By Application
    • Market Attractiveness Analysis
      • By Country
      • By Type
      • By Application
    • Key Takeaways
  16. Key Countries Market Analysis
    • USA
      • Pricing Analysis
      • Market Share Analysis, 2024
        • By Type
        • By Application
    • Canada
      • Pricing Analysis
      • Market Share Analysis, 2024
        • By Type
        • By Application
    • Mexico
      • Pricing Analysis
      • Market Share Analysis, 2024
        • By Type
        • By Application
    • Brazil
      • Pricing Analysis
      • Market Share Analysis, 2024
        • By Type
        • By Application
    • Chile
      • Pricing Analysis
      • Market Share Analysis, 2024
        • By Type
        • By Application
    • Germany
      • Pricing Analysis
      • Market Share Analysis, 2024
        • By Type
        • By Application
    • UK
      • Pricing Analysis
      • Market Share Analysis, 2024
        • By Type
        • By Application
    • Italy
      • Pricing Analysis
      • Market Share Analysis, 2024
        • By Type
        • By Application
    • Spain
      • Pricing Analysis
      • Market Share Analysis, 2024
        • By Type
        • By Application
    • France
      • Pricing Analysis
      • Market Share Analysis, 2024
        • By Type
        • By Application
    • India
      • Pricing Analysis
      • Market Share Analysis, 2024
        • By Type
        • By Application
    • ASEAN
      • Pricing Analysis
      • Market Share Analysis, 2024
        • By Type
        • By Application
    • Australia & New Zealand
      • Pricing Analysis
      • Market Share Analysis, 2024
        • By Type
        • By Application
    • China
      • Pricing Analysis
      • Market Share Analysis, 2024
        • By Type
        • By Application
    • Japan
      • Pricing Analysis
      • Market Share Analysis, 2024
        • By Type
        • By Application
    • South Korea
      • Pricing Analysis
      • Market Share Analysis, 2024
        • By Type
        • By Application
    • Russia
      • Pricing Analysis
      • Market Share Analysis, 2024
        • By Type
        • By Application
    • Poland
      • Pricing Analysis
      • Market Share Analysis, 2024
        • By Type
        • By Application
    • Hungary
      • Pricing Analysis
      • Market Share Analysis, 2024
        • By Type
        • By Application
    • Kingdom of Saudi Arabia
      • Pricing Analysis
      • Market Share Analysis, 2024
        • By Type
        • By Application
    • Turkiye
      • Pricing Analysis
      • Market Share Analysis, 2024
        • By Type
        • By Application
    • South Africa
      • Pricing Analysis
      • Market Share Analysis, 2024
        • By Type
        • By Application
  17. Market Structure Analysis
    • Competition Dashboard
    • Competition Benchmarking
    • Market Share Analysis of Top Players
      • By Regional
      • By Type
      • By Application
  18. Competition Analysis
    • Competition Deep Dive
      • GE Healthcare Inc.
        • Overview
        • Product Portfolio
        • Profitability by Market Segments (Product/Age /Sales Channel/Region)
        • Sales Footprint
        • Strategy Overview
          • Marketing Strategy
          • Product Strategy
          • Channel Strategy
      • Philips Healthcare
      • Siemens AG
      • Hologic Corp
      • BMI Biomedical International s.r.l.
      • DMS Health Technologies
      • Medonica Co., Ltd.
      • Gemss Co. Ltd
      • Shimadzu Corp
  19. Assumptions & Acronyms Used
  20. Research Methodology

List of Tables

  • Table 1: Global Market Value (USD Million) Forecast by Region, 2020 to 2035
  • Table 2: Global Market Value (USD Million) Forecast by Type , 2020 to 2035
  • Table 3: Global Market Value (USD Million) Forecast by Application, 2020 to 2035
  • Table 4: North America Market Value (USD Million) Forecast by Country, 2020 to 2035
  • Table 5: North America Market Value (USD Million) Forecast by Type , 2020 to 2035
  • Table 6: North America Market Value (USD Million) Forecast by Application, 2020 to 2035
  • Table 7: Latin America Market Value (USD Million) Forecast by Country, 2020 to 2035
  • Table 8: Latin America Market Value (USD Million) Forecast by Type , 2020 to 2035
  • Table 9: Latin America Market Value (USD Million) Forecast by Application, 2020 to 2035
  • Table 10: Western Europe Market Value (USD Million) Forecast by Country, 2020 to 2035
  • Table 11: Western Europe Market Value (USD Million) Forecast by Type , 2020 to 2035
  • Table 12: Western Europe Market Value (USD Million) Forecast by Application, 2020 to 2035
  • Table 13: Eastern Europe Market Value (USD Million) Forecast by Country, 2020 to 2035
  • Table 14: Eastern Europe Market Value (USD Million) Forecast by Type , 2020 to 2035
  • Table 15: Eastern Europe Market Value (USD Million) Forecast by Application, 2020 to 2035
  • Table 16: East Asia Market Value (USD Million) Forecast by Country, 2020 to 2035
  • Table 17: East Asia Market Value (USD Million) Forecast by Type , 2020 to 2035
  • Table 18: East Asia Market Value (USD Million) Forecast by Application, 2020 to 2035
  • Table 19: South Asia and Pacific Market Value (USD Million) Forecast by Country, 2020 to 2035
  • Table 20: South Asia and Pacific Market Value (USD Million) Forecast by Type , 2020 to 2035
  • Table 21: South Asia and Pacific Market Value (USD Million) Forecast by Application, 2020 to 2035
  • Table 22: Middle East & Africa Market Value (USD Million) Forecast by Country, 2020 to 2035
  • Table 23: Middle East & Africa Market Value (USD Million) Forecast by Type , 2020 to 2035
  • Table 24: Middle East & Africa Market Value (USD Million) Forecast by Application, 2020 to 2035

List of Figures

  • Figure 1: Global Market Pricing Analysis
  • Figure 2: Global Market Value (USD Million) Forecast 2020-2035
  • Figure 3: Global Market Value Share and BPS Analysis by Type , 2025 and 2035
  • Figure 4: Global Market Y to o to Y Growth Comparison by Type , 2025-2035
  • Figure 5: Global Market Attractiveness Analysis by Type
  • Figure 6: Global Market Value Share and BPS Analysis by Application, 2025 and 2035
  • Figure 7: Global Market Y to o to Y Growth Comparison by Application, 2025-2035
  • Figure 8: Global Market Attractiveness Analysis by Application
  • Figure 9: Global Market Value (USD Million) Share and BPS Analysis by Region, 2025 and 2035
  • Figure 10: Global Market Y to o to Y Growth Comparison by Region, 2025-2035
  • Figure 11: Global Market Attractiveness Analysis by Region
  • Figure 12: North America Market Incremental Dollar Opportunity, 2025-2035
  • Figure 13: Latin America Market Incremental Dollar Opportunity, 2025-2035
  • Figure 14: Western Europe Market Incremental Dollar Opportunity, 2025-2035
  • Figure 15: Eastern Europe Market Incremental Dollar Opportunity, 2025-2035
  • Figure 16: East Asia Market Incremental Dollar Opportunity, 2025-2035
  • Figure 17: South Asia and Pacific Market Incremental Dollar Opportunity, 2025-2035
  • Figure 18: Middle East & Africa Market Incremental Dollar Opportunity, 2025-2035
  • Figure 19: North America Market Value Share and BPS Analysis by Country, 2025 and 2035
  • Figure 20: North America Market Value Share and BPS Analysis by Type , 2025 and 2035
  • Figure 21: North America Market Y to o to Y Growth Comparison by Type , 2025-2035
  • Figure 22: North America Market Attractiveness Analysis by Type
  • Figure 23: North America Market Value Share and BPS Analysis by Application, 2025 and 2035
  • Figure 24: North America Market Y to o to Y Growth Comparison by Application, 2025-2035
  • Figure 25: North America Market Attractiveness Analysis by Application
  • Figure 26: Latin America Market Value Share and BPS Analysis by Country, 2025 and 2035
  • Figure 27: Latin America Market Value Share and BPS Analysis by Type , 2025 and 2035
  • Figure 28: Latin America Market Y to o to Y Growth Comparison by Type , 2025-2035
  • Figure 29: Latin America Market Attractiveness Analysis by Type
  • Figure 30: Latin America Market Value Share and BPS Analysis by Application, 2025 and 2035
  • Figure 31: Latin America Market Y to o to Y Growth Comparison by Application, 2025-2035
  • Figure 32: Latin America Market Attractiveness Analysis by Application
  • Figure 33: Western Europe Market Value Share and BPS Analysis by Country, 2025 and 2035
  • Figure 34: Western Europe Market Value Share and BPS Analysis by Type , 2025 and 2035
  • Figure 35: Western Europe Market Y to o to Y Growth Comparison by Type , 2025-2035
  • Figure 36: Western Europe Market Attractiveness Analysis by Type
  • Figure 37: Western Europe Market Value Share and BPS Analysis by Application, 2025 and 2035
  • Figure 38: Western Europe Market Y to o to Y Growth Comparison by Application, 2025-2035
  • Figure 39: Western Europe Market Attractiveness Analysis by Application
  • Figure 40: Eastern Europe Market Value Share and BPS Analysis by Country, 2025 and 2035
  • Figure 41: Eastern Europe Market Value Share and BPS Analysis by Type , 2025 and 2035
  • Figure 42: Eastern Europe Market Y to o to Y Growth Comparison by Type , 2025-2035
  • Figure 43: Eastern Europe Market Attractiveness Analysis by Type
  • Figure 44: Eastern Europe Market Value Share and BPS Analysis by Application, 2025 and 2035
  • Figure 45: Eastern Europe Market Y to o to Y Growth Comparison by Application, 2025-2035
  • Figure 46: Eastern Europe Market Attractiveness Analysis by Application
  • Figure 47: East Asia Market Value Share and BPS Analysis by Country, 2025 and 2035
  • Figure 48: East Asia Market Value Share and BPS Analysis by Type , 2025 and 2035
  • Figure 49: East Asia Market Y to o to Y Growth Comparison by Type , 2025-2035
  • Figure 50: East Asia Market Attractiveness Analysis by Type
  • Figure 51: East Asia Market Value Share and BPS Analysis by Application, 2025 and 2035
  • Figure 52: East Asia Market Y to o to Y Growth Comparison by Application, 2025-2035
  • Figure 53: East Asia Market Attractiveness Analysis by Application
  • Figure 54: South Asia and Pacific Market Value Share and BPS Analysis by Country, 2025 and 2035
  • Figure 55: South Asia and Pacific Market Value Share and BPS Analysis by Type , 2025 and 2035
  • Figure 56: South Asia and Pacific Market Y to o to Y Growth Comparison by Type , 2025-2035
  • Figure 57: South Asia and Pacific Market Attractiveness Analysis by Type
  • Figure 58: South Asia and Pacific Market Value Share and BPS Analysis by Application, 2025 and 2035
  • Figure 59: South Asia and Pacific Market Y to o to Y Growth Comparison by Application, 2025-2035
  • Figure 60: South Asia and Pacific Market Attractiveness Analysis by Application
  • Figure 61: Middle East & Africa Market Value Share and BPS Analysis by Country, 2025 and 2035
  • Figure 62: Middle East & Africa Market Value Share and BPS Analysis by Type , 2025 and 2035
  • Figure 63: Middle East & Africa Market Y to o to Y Growth Comparison by Type , 2025-2035
  • Figure 64: Middle East & Africa Market Attractiveness Analysis by Type
  • Figure 65: Middle East & Africa Market Value Share and BPS Analysis by Application, 2025 and 2035
  • Figure 66: Middle East & Africa Market Y to o to Y Growth Comparison by Application, 2025-2035
  • Figure 67: Middle East & Africa Market Attractiveness Analysis by Application
  • Figure 68: Global Market - Tier Structure Analysis
  • Figure 69: Global Market - Company Share Analysis
Dashboard
Dashboard
Dashboard
Dashboard
Dashboard
Dashboard

Full Research Suite comprises of:

Market outlook & trends analysis

Market outlook & trends analysis

Interviews & case studies

Interviews & case studies

Strategic recommendations

Strategic recommendations

Vendor profiles & capabilities analysis

Vendor profiles & capabilities analysis

5-year forecasts

5-year forecasts

8 regions and 60+ country-level data splits

8 regions and 60+ country-level data splits

Market segment data splits

Market segment data splits

12 months of continuous data updates

12 months of continuous data updates

DELIVERED AS:

PDF EXCEL ONLINE

Full Research Suite


$5000

$7500

$10000

Buy Report Now
Similar Industry Reports

Similar Industry Reports

FBAR Devices Market
FBAR Devices Market

FBAR Devices Market

Snare devices Market

Snare devices Market

Timing Devices Market

Timing Devices Market Analysis - Size, Growth, & Forecast Outlook 2025 to 2035

Spinal Devices Market

Spinal Devices Market Size and Share Forecast Outlook 2025 to 2035

Hearing Devices 3D Printing Market

Hearing Devices 3D Printing Market Size and Share Forecast Outlook 2025 to 2035

Medical Devices Market

Medical Devices Market Size and Share Forecast Outlook 2025 to 2035

Network Devices Market

Network Devices Market Size and Share Forecast Outlook 2025 to 2035

Medical Devices Secondary Packaging Market

Medical Devices Secondary Packaging Market Analysis by Material and Application Through 2035

Hearable Devices Market

Hearable Devices Market Size and Share Forecast Outlook 2025 to 2035

Lab Chip Devices Market

Lab Chip Devices Market Size and Share Forecast Outlook 2025 to 2035

Orthotic Devices, Casts and Splints Market

Orthotic Devices, Casts and Splints Market Size and Share Forecast Outlook 2025 to 2035

Lacrimal Devices Market

Lacrimal Devices Market Size, Trends, and Forecast 2025 to 2035

Ablation Devices Market

Global Ablation Devices Market Trends - Growth, Innovations & Forecast 2025 to 2035

Orthotic Devices, Orthotic Splints, and Orthopedic Braces and Support Market

Orthotic Devices, Splints & Orthopedic Braces Market Analysis - Trends & Forecast 2024 to 2034

Ear Tube Devices Market

Ear Tube Devices Market

Pathology Devices Market

Pathology Devices Market Size and Share Forecast Outlook 2025 to 2035

Neurotech Devices Market

Neurotech Devices Market Size and Share Forecast Outlook 2025 to 2035

Skin Care Devices Market

Skin Care Devices Market Analysis - Trends & Forecast 2025 to 2035

Strapping Devices Market

Strapping Devices Market Trends - Size, Growth & Forecast 2025 to 2035

Sleep Aid Devices Market

Sleep Aid Devices Market Growth – Industry Insights & Forecast 2022-2032

Future Market Insights

C-Arms Devices Market

Chat With MaRIA

Chat With

MaRIA

Hi There, I am MaRIA, Your Market Research Intelligence Assistant. How may I help you?