Orthotic Devices, Casts and Splints Market
Market Insights on Orthotic Devices, Casts and Splints covering sales outlook, demand forecast & up-to-date key trends
Orthotic Devices, Casts, and Splints Market By Product Type (Casting Supplies & Equipment, Splinting Supplies & Equipment, Orthotics), Distribution Channel (Institutional Sales, Retail Sales) & Region - Forecast 2022 - 2024
Orthotic Devices, Casts, and Splints Market Outlook (2022-2024)
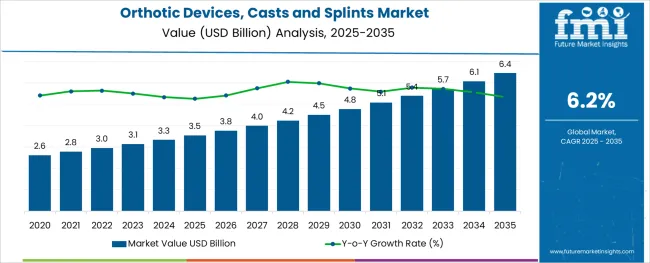
[235 Pages Report] Worldwide demand for orthotic devices, casts, and splints is expected to increase at a CAGR of 6.2% over the forecast period (2022-2024). The global orthotic devices, casts, and splints market is valued at US$ 2.95 Bn in 2022, and is projected to reach US$ 3.32 Bn by the end of 2024.
Orthotic Devices, Casts, and Splints Market Size (2022) |
US$ 2.95 Bn |
Sales Forecast (2024) |
US$ 3.32 Bn |
Global Market Growth Rate (2022 to 2024) |
6.2% CAGR |
North America Region USD Share |
38% |
Sales of orthotic devices, casts, and splints accounted for 28% share of the global fracture fixation products market in 2021.
Let us know your requirement to get
100% FREE customization
How The Market Progressed Till June 2022?
Particulars |
Details |
H1, 2021 |
5.39% |
H1, 2022 Projected |
5.54% |
H1, 2022 Outlook |
5.24% |
BPS Change - H1, 2022 (O) – H1, 2022 (P) |
(-) 30 ↓ |
BPS Change – H1, 2022 (O) – H1, 2021 |
(-) 15 ↓ |
According to Future Market Insights' analysis, the global orthotic devices, casts and splints market expects to drop by 15 Basis Point Share (BPS) in H1-2022 as compared to H1- 2021. Whereas in comparison to H1-2022 projected value, the market during H1-2022 outlook period will show a dip of 30 BPS.
The drop in the BPS values is associated with the costs related to the replacement, repairs, and modifications of orthotic devices. Moreover, significant drawbacks concerning the interaction of orthotic devices, such as, orthosis and prosthetics, with respect to material properties, has further provided a restraint towards the growth in the BPS outlook.
Conversely, with the introduction of 3D printing technology and the adoption of CAD/CAM, the manufacturing costs of orthotic devices, casts and splints will significantly be reduced. This factor is set to propel the growth of the market through the forecasted years.
Key developments in the market include incorporation of neuromuscular signal technology, microprocessor technology, and 3D printing for novel orthotic devices.
Revenue Analysis of Orthotic Devices, Casts, and Splints from 2014 to 2021 Vs Future Market Outlook for 2022 to 2024
“Rising Incidence of Sports Injuries Worldwide Driving Market Growth”
From 2014 to 2021, the market value of the orthotic devices, casts, and splints industry registered a CAGR of 5.8%.
Orthotic devices, casts, and splints are a key management option for various types of injuries. The increase in the number of injuries suffered due to road accidents, as well as during recreational and professional sporting events has remained a key market driver.
As per ASIRT (Association of System Integrators and Retailers in Technology), almost 50 million people get adversely affected by road accidents every single year globally.
Also, per the AAOS (American Academy of Orthopedic Surgeons), over 25% of sports injuries concern lower extremities. The CDC states that close to 9.2 Mn children aged 1 to 19 get admitted to the emergency departments in the wake of sports injuries. Moreover, around 62% of sports injuries occur during practice than during actual games.
Increasing prevalence of age-related osteoporotic fractures, musculoskeletal problems, and trauma caused by road accidents and falls, as well as the growing geriatric population, are likely to drive the global market.
The global orthotic devices, casts, and splints market is projected to rise at a 6.2% CAGR from 2022 to 2024.
What’s Driving Orthotic Devices, Casts, and Splints Market Growth?
“Advancements in 3D Technology to Boost Sales of Orthotic Devices, Casts, and Splints”
The orthotic devices, casts, and splints industry will be revolutionized by rising technologies such as 3D imaging and scanning, CAM/CAD, and so on. These technologies will become more widely available in the future years, allowing patients to 3D print orthotic devices in the comfort of their own homes.
As people seek alternatives to surgical deformity repair and pain management, the use of orthotic devices will be promoted around the world. Furthermore, advancements in orthotic devices are making them more accessible and affordable.
Factors such as continuous technological advancements in 3D technology, increase in the number of people suffering from orthopedic ailments, and requirement for robot-assisted and minimally invasive techniques are offering substantial growth opportunities for orthotic system manufacturers.
Find your sweet spots for generating winning opportunities in this market.
Talk to AnalystWhy is Demand for Orthotic Devices, Casts, and Splints Being Restrained?
“High Cost of Orthotic Devices & Complications with Orthopedic Surgery Hampering Market Expansion”
One of the most significant challenges impeding the market growth is the high cost of orthotic devices.
Inadequately trained medical attendants and nurses apply casts in rural areas. This could result in complications as discomfort on the part of patients could be higher. This factor remains a challenge, especially in developing economies as overcrowding of patients in city-based hospitals makes treatments difficult.
Which Region is Projected to Offer the Largest Opportunity for Manufacturers of Orthotic Devices, Casts, and Splints?
“Continuous Innovations in Orthotics Driving Market Growth in North America”
North America is expected to account 38% share of the orthotic devices, casts, and splints market in 2022. The use of orthotic devices for pain management in the senior population, the increase in sports injuries, the rise in the incidence of spine diseases, and the rise in the incidence of neuromuscular and musculoskeletal illnesses among the population are all driving the market expansion.
Innovations in orthotics and well-planned reimbursement regulations are expected to drive orthotic devices market growth over the coming years.
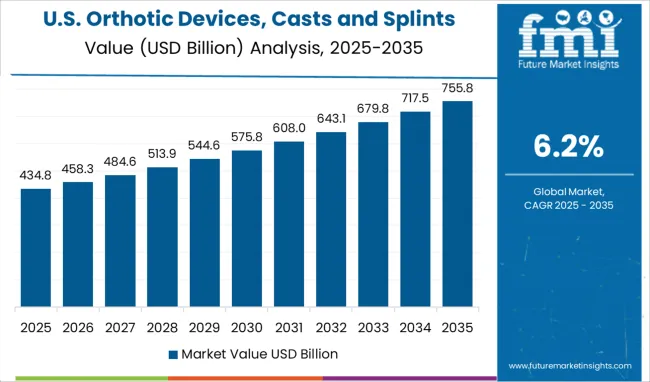
A unified Market Research Subscription Platform, built for today's disparate research needs.
Country-wise Analysis
Where Does the U.S. Orthotic Devices, Casts, and Splints Market Stand?
“High Adoption of Advanced Products Fueling U.S. Market Growth”
Rising adoption of universal health coverage in developed and developing markets, rising product launches, steadily increasing healthcare infrastructure and expenditure, and the presence of key suppliers of orthotic devices, casts, and splints are key factors propelling orthotic systems market growth in the United States.
Skilled professionals, availability of refined and advanced items, and rising demand for advanced products and therapies are driving orthotic equipment market growth in the U.S.
Will China Offer Lucrative Growth Opportunity to Suppliers of Orthotic Devices, Casts, and Splints?
“Favorable Government Initiatives for Improvement of Healthcare Facilities Driving Demand Growth”
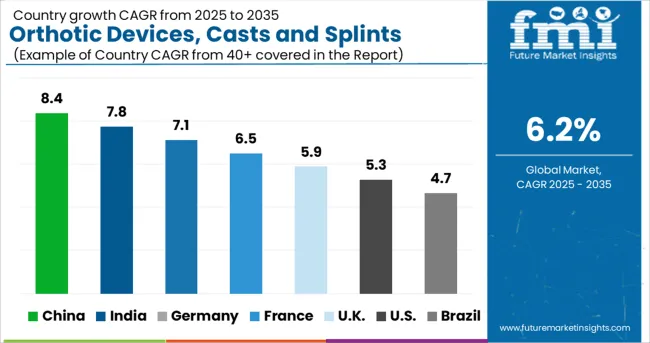
Market growth in China is anticipated to expand at a rapid pace during the forecast period due to the rising rate of urbanization and government attempts to improve healthcare facilities.
Furthermore, propelling medical tourism due to the availability of cost-effective and advanced healthcare treatment alternatives, a rise in disposable income, and increased adoption of novel technology are bolstering the market growth in China.
Category-wise Insights
Which Product Type of Orthotic Devices, Casts, and Splints is Expected to Garner Significant Traction?
“Splinting Supplies & Equipment Gaining Traction Owing to Their Cost-effective Nature”
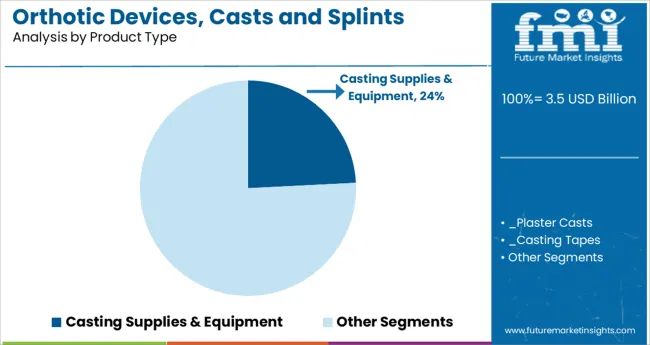
Splinting supplies & equipment are predicted to develop rapidly over the coming years due to advantages such as the simplicity of making plastic splints, which allows for quick customization, and the high adaptability and strength of neoprene splints.
Increased instances of road accidents and musculoskeletal injuries, a growing population base of people over the age of 65, and the frequency of orthopedic complications associated with ageing are driving the demand for orthopedic casts and splints.
The capacity of these products to enhance patient compliance in terms of secured support and comfort over the course of treatment, rising technological advancements, and the use of advanced materials by manufacturers are driving demand for splinting supplies and equipment.
Which Distribution Channel of Orthotic Devices, Casts, and Splints Will Generate Highest Revenue?
“Hospitals to Generate Highest Market Revenue Due to Growing Number of Orthopedic Surgery Operations”
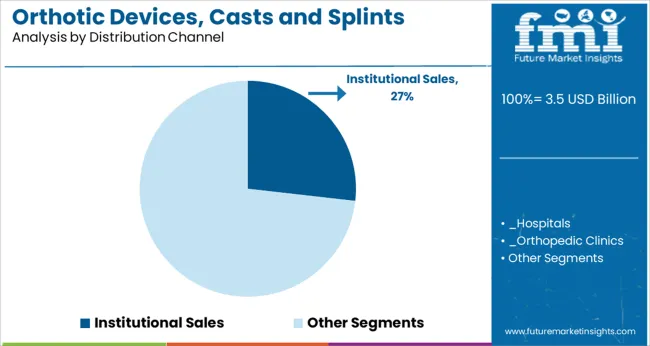
Hospitals have a considerable market share due to an increase in the number of admissions for the treatment of traumatic and spinal injuries, bone fractures, and injuries incurred in car accidents.
Demand for orthotic devices, casts, and splints in hospitals is being driven by an increase in the number of orthopedic surgical operations that require post-operative patient rehabilitation and favorable reimbursement for personalized orthotic devices across major countries.
Hospitals utilize orthotic devices, casts, and splints for a variety of reasons, including preventive, post-operative patient rehabilitation, osteoarthritis treatment, and maxillofacial operations. Orthotic devices, casts, and splints are the most commonly used in hospitals because of their extensive use in the treatment of spinal fusion and delayed union and nonunion bone fractures.
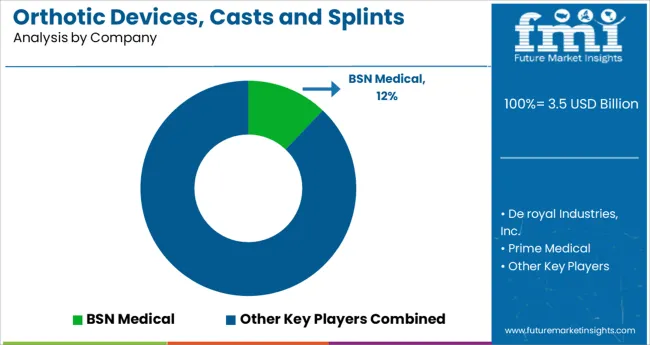
COVID-19 Impact on Orthotic Devices, Casts, and Splints Demand
The COVID-19 pandemic hampered the global economy and brought the closure of thousands of businesses worldwide. Demand for orthotic devices, casts and splints witnessed a drop because of a decline in hospital visits and a decrease in the number of road mishaps and sports activities.
On the other hand, the growing focus on decision-making processes for the treatment of acute pediatric injuries and the large emphasis on the risk/benefit ratio for proceeding with acute fracture surgeries are expected to drive market growth over the coming years.
Competitive Landscape
Shortfalls in conventional manufacturing processes of orthotics imply that it could take ages for patients to acquire the devices that they require. As such, technological advancements are being focused upon. These advancements are likely to create a competitive edge for providers of orthotic devices, casts, and splints during the forecast period.
Companies are continuously coming up with new ways to ramp up production, such as capacity increases and new product development. To boost revenue sales, they are also focusing on partnership-oriented techniques such as acquisitions and mergers.
For instance,
- In February 2021, Breg, Inc. launched Pinnacle and Ascend™, its two new lines of spinal orthoses. 15 new products by the company were created to improve care for individuals with spinal injuries, while also expanding its produced goods offering.
Orthotic Devices, Casts, and Splints Industry Report Scope
Attribute |
Details |
Forecast Period |
2022-2024 |
Historical Data Available for |
2014-2021 |
Market Analysis |
Value in US$ Mn, Volume in Units |
Key Regions Covered |
|
Key Countries Covered |
|
Key Market Segments Covered |
|
Key Companies Profiled |
|
Pricing |
Available upon Request |
Orthotic Devices, Casts, and Splints Industry Survey
Orthotic Devices, Casts, and Splints Market by Product Type:
- Casting Supplies & Equipment
- Plaster Casts
- Casting Tapes
- Cast Cutters
- Casting Tools and Accessories
- Splinting Supplies & Equipment
- Fiberglass Splints
- Plaster Splints
- Other Splints
- Splinting Tools and Accessories
- Orthotics
- Functional Orthotics
- Accommodative Orthotics
Orthotic Devices, Casts, and Splints Market by Distribution Channel:
- Institutional Sales
- Hospitals
- Orthopedic Clinics
- Nursing Facilities
- Retail Sales
- Online Sales
- Retail Pharmacies
- Drug Stores
Orthotic Devices, Casts, and Splints Market by Region:
- North America Orthotic Devices, Casts, and Splints Market
- Latin America Orthotic Devices, Casts, and Splints Market
- Europe Orthotic Devices, Casts, and Splints Market
- East Asia Orthotic Devices, Casts, and Splints Market
- South Asia & Pacific Orthotic Devices, Casts, and Splints Market
- Middle East & Africa (MEA) Orthotic Devices, Casts, and Splints Market
Frequently Asked Questions
What is the forecasted size of the global market for orthotic devices, casts, and splints?
The global orthotic devices, casts, and splints market is expected to reach US$ 3.32 Bn by 2024.
Which region is dominating orthotic devices, casts, and splints market growth?
North America accounts for 38% share of the global orthotic devices, casts, and splints market.
Who are the key players in the global orthotic devices, casts, and splints market?
Fillauer LLC, ComfortFit Orthotic Labs Inc., Hanger Inc., Amfit Inc., and Ascent Meditech Ltd. are prominent manufacturers of orthotic devices, casts, and splints.
At what CAGR is the global orthotic devices, casts, and splints market expected to rise?
The global market for orthotic devices, casts, and splints is estimated to exhibit a CAGR of 6.2% during the forecast period (2022-2024).
What are the key factors driving demand growth of orthotic equipment?
Increasing count of bone diseases along with growing instances of trauma and road accidents are key factors driving orthotic systems market growth.
Table of Content
1. Executive Summary 1.1. Global Market Outlook 1.2. Key Trends & Market Dynamics 1.3. Industry Evolution 1.4. Analysis and Recommendations 2. Market Overview 2.1. Market Coverage / Taxonomy 2.2. Market Definition / Scope / Limitations 3. Key Market Trends 4. Key Success Factors 4.1. Product Adoption / Usage Analysis 4.2. Key Regulations 4.3. Orthotic Devices for Injury Prevention 5. COVID19 Crisis Analysis 5.1. Current COVID19 Statistics 5.2. Current GDP Projection and Probable Impact 6. Global Orthotic Devices, Casts and Splints Market Demand Analysis 2014–2021 and Forecast, 2022-2024 6.1. Historical Market Volume (Units) Analysis, 2014–2021 6.2. Current and Future Market Volume (Units) Projections, 2022-2024 6.3. Y-o-Y Growth Trend Analysis 7. Global Orthotic Devices, Casts and Splints Market - Pricing Analysis 8. Global Orthotic Devices, Casts and Splints Market Demand (in Value or Size in US$ Mn) Analysis 2014–2021 and Forecast, 2022-2024 8.1. Historical Market Value (US$ Mn) Analysis, 2014–2021 8.2. Current and Future Market Value (US$ Mn) Projections, 2022-2024 8.2.1. Y-o-Y Growth Trend Analysis 8.2.2. Absolute $ Opportunity Analysis 9. Market Background 9.1. Macro-Economic Factors 9.1.1. Global aging population 9.1.2. Prevalence of orthopedic related disorders 9.2. Forecast Factors - Relevance & Impact 9.2.1. R&D Activities and Commercialization of New Products 9.2.2. Increased Application in Injury Prevention and Rehabilitation 9.2.3. Regulatory Imposition on Orthotic Devices, Casts and Splints Products 9.2.4. Advancements in Orthotic Devices 9.2.5. Growing Adoption Rate for Orthotic Devices, Casts and Splints 9.3. Market Dynamics 9.3.1. Drivers 9.3.2. Restraints 9.3.3. Opportunity Analysis 10. Global Orthotic Devices, Casts and Splints Market Analysis 2014–2021 and Forecast 2022-2024, by Product Type 10.1. Introduction / Key Findings 10.2. Historical Market Size (US$ Mn) and Volume (Units) Analysis By Product Type, 2014–2021 10.3. Current and Future Market Size (US$ Mn) and Volume (Units) Analysis and Forecast By Product Type, 2022 - 2024 10.3.1. Casting Supplies & Equipment 10.3.1.1. Plaster Casts 10.3.1.2. Casting Tapes 10.3.1.3. Cast Cutters 10.3.1.4. Casting Tools and Accessories 10.3.2. Splinting Supplies & Equipment 10.3.2.1. Fiberglass Splints 10.3.2.2. Plaster Splints 10.3.2.3. Other Splints 10.3.2.4. Splinting Tools and Accessories 10.3.3. Orthotics 10.3.3.1.1. Functional Orthotics 10.3.3.1.2. Accommodative Orthotics 10.4. Market Attractiveness Analysis By Product Type 11. Global Orthotic Devices, Casts and Splints Market Analysis 2014–2021 and Forecast 2022-2024, by Distribution channel 11.1. Introduction / Key Findings 11.2. Historical Market Size (US$ Mn) Analysis By Distribution channel, 2014–2021 11.3. Current and Future Market Size (US$ Mn) Analysis and Forecast By Distribution channel, 2022 - 2024 11.3.1. Institutional Sales 11.3.1.1. Hospitals 11.3.1.2. Orthopedic Clinics 11.3.1.3. Nursing Facilities 11.3.2. Retail Sales 11.3.2.1. Online Sales 11.3.2.2. Retail Pharmacies 11.3.2.3. Drug Stores 11.4. Market Attractiveness Analysis By Distribution channel 12. Global Orthotic Devices, Casts and Splints Market Analysis 2014–2021 and Forecast 2022-2024, by Region 12.1. Introduction / Key Findings 12.2. Historical Market Size (US$ Mn) and Volume (Units) Analysis By Distribution channel, 2014–2021 12.3. Current and Future Market Size (US$ Mn) and Volume (Units) Analysis and Forecast By Distribution channel, 2022 - 2024 12.3.1. North America 12.3.2. Latin America 12.3.3. Europe 12.3.4. Middle East and Africa (MEA) 12.3.5. East Asia 12.3.6. South Asia 12.3.7. Oceania 12.4. Market Attractiveness Analysis By Region 13. North America Orthotic Devices, Casts and Splints Market Analysis 2014–2021 and Forecast 2022-2024 13.1. Pricing Analysis 13.2. Historical Market Size (US$ Mn) and Volume Analysis By Distribution channel, 2014–2021 13.3. Current and Future Market Size (US$ Mn) and Volume Analysis and Forecast By Distribution channel, 2022 - 2024 13.3.1. By Country 13.3.1.1. U.S. 13.3.1.2. Canada 13.3.2. By Product Type 13.3.3. By Distribution channel 13.4. Market Attractiveness Analysis 13.4.1. By Country 13.4.2. By Product Type 13.4.3. By Distribution channel 13.5. Drivers and Restraints - Impact Analysis 14. Latin America Orthotic Devices, Casts and Splints Market Analysis 2014–2021 and Forecast 2022-2024 14.1. Pricing Analysis 14.2. Historical Market Size (US$ Mn) and Volume Analysis By Distribution channel, 2014–2021 14.3. Current and Future Market Size (US$ Mn) and Volume Analysis and Forecast By Distribution channel, 2022 - 2024 14.3.1. By Country 14.3.1.1. Brazil 14.3.1.2. Mexico 14.3.1.3. Rest of Latin America 14.3.2. By Product Type 14.3.3. By Distribution channel 14.4. Market Attractiveness Analysis 14.4.1. By Country 14.4.2. By Product Type 14.4.3. By Distribution channel 14.5. Drivers and Restraints - Impact Analysis 15. Europe Orthotic Devices, Casts and Splints Market Analysis 2014–2021 and Forecast 2022-2024 15.1. Pricing Analysis 15.2. Historical Market Size (US$ Mn) and Volume Analysis By Distribution channel, 2014–2021 15.3. Current and Future Market Size (US$ Mn) and Volume Analysis and Forecast By Distribution channel, 2022 - 2024 15.3.1. By Country 15.3.1.1. Germany 15.3.1.2. Italy 15.3.1.3. France 15.3.1.4. U.K. 15.3.1.5. Spain 15.3.1.6. BENELUX 15.3.1.7. Russia 15.3.1.8. Rest of Europe 15.3.2. By Product Type 15.3.3. By Distribution channel 15.4. Market Attractiveness Analysis 15.4.1. By Country 15.4.2. By Product Type 15.4.3. By Distribution channel 15.5. Drivers and Restraints - Impact Analysis 16. South Asia Orthotic Devices, Casts and Splints Market Analysis 2014–2021 and Forecast 2022-2024 16.1. Pricing Analysis 16.2. Historical Market Size (US$ Mn) and Volume Analysis By Distribution channel, 2014–2021 16.3. Current and Future Market Size (US$ Mn) and Volume Analysis and Forecast By Distribution channel, 2022 - 2024 16.3.1. By Country 16.3.1.1. India 16.3.1.2. Thailand 16.3.1.3. Indonesia 16.3.1.4. Malaysia 16.3.1.5. Rest of South Asia 16.3.2. By Product Type 16.3.3. By Distribution channel 16.4. Market Attractiveness Analysis 16.4.1. By Country 16.4.2. By Product Type 16.4.3. By Distribution channel 16.5. Drivers and Restraints - Impact Analysis 17. East Asia Orthotic Devices, Casts and Splints Market Analysis 2014–2021 and Forecast 2022-2024 17.1. Pricing Analysis 17.2. Historical Market Size (US$ Mn) and Volume Analysis By Distribution channel, 2014–2021 17.3. Current and Future Market Size (US$ Mn) and Volume Analysis and Forecast By Distribution channel, 2022 - 2024 17.3.1. By Country 17.3.1.1. China 17.3.1.2. Japan 17.3.1.3. South Korea 17.3.2. By Product Type 17.3.3. By Distribution channel 17.4. Market Attractiveness Analysis 17.4.1. By Country 17.4.2. By Product Type 17.4.3. By Distribution channel 17.5. Drivers and Restraints - Impact Analysis 18. Oceania Orthotic Devices, Casts and Splints Market Analysis 2014–2021 and Forecast 2022-2024 18.1. Pricing Analysis 18.2. Historical Market Size (US$ Mn) and Volume Analysis By Distribution channel, 2014–2021 18.3. Current and Future Market Size (US$ Mn) and Volume Analysis and Forecast By Distribution channel, 2022 - 2024 18.3.1. By Country 18.3.1.1. Australia 18.3.1.2. New Zealand 18.3.2. By Product Type 18.3.3. By Distribution channel 18.4. Market Attractiveness Analysis 18.4.1. By Country 18.4.2. By Product Type 18.4.3. By Distribution channel 18.5. Drivers and Restraints - Impact Analysis 19. Middle East and Africa Orthotic Devices, Casts and Splints Market Analysis 2014–2021 and Forecast 2022-2024 19.1. Pricing Analysis 19.2. Historical Market Size (US$ Mn) and Volume Analysis By Distribution channel, 2014–2021 19.3. Current and Future Market Size (US$ Mn) and Volume Analysis and Forecast By Distribution channel, 2022 - 2024 19.3.1. By Country 19.3.1.1. GCC Countries 19.3.1.2. Turkey 19.3.1.3. Northern Africa 19.3.1.4. South Africa 19.3.1.5. Rest of Middle East and Africa 19.3.2. By Product Type 19.3.3. By Distribution channel 19.4. Market Attractiveness Analysis 19.4.1. By Country 19.4.2. By Product Type 19.4.3. By Distribution channel 19.5. Drivers and Restraints - Impact Analysis 20. Key and Emerging Countries Respiratory Pathogen Testing Market Analysis 2014-2021 and Forecast 2022-2024 20.1. U.S. Respiratory Pathogen Testing Market Analysis 20.1.1. By Products 20.1.2. By Distribution Channel 20.2. Canada Respiratory Pathogen Testing Market Analysis 20.2.1. By Products 20.2.2. By Distribution Channel 20.3. Mexico Respiratory Pathogen Testing Market Analysis 20.3.1. By Products 20.3.2. By Distribution Channel 20.4. Brazil Respiratory Pathogen Testing Market Analysis 20.4.1. By Products 20.4.2. By Distribution Channel 20.5. U.K. Respiratory Pathogen Testing Market Analysis 20.5.1. By Products 20.5.2. By Distribution Channel 20.6. Germany Respiratory Pathogen Testing Market Analysis 20.6.1. By Products 20.6.2. By Distribution Channel 20.7. France Respiratory Pathogen Testing Market Analysis 20.7.1. By Products 20.7.2. By Distribution Channel 20.8. Italy Respiratory Pathogen Testing Market Analysis 20.8.1. By Products 20.8.2. By Distribution Channel 20.9. Spain Respiratory Pathogen Testing Market Analysis 20.9.1. By Products 20.9.2. By Distribution Channel 20.10. BENELUX Respiratory Pathogen Testing Market Analysis 20.10.1. By Products 20.10.2. By Distribution Channel 20.11. Russia Respiratory Pathogen Testing Market Analysis 20.11.1. By Products 20.11.2. By Distribution Channel 20.12. China Respiratory Pathogen Testing Market Analysis 20.12.1. By Products 20.12.2. By Distribution Channel 20.13. Japan Respiratory Pathogen Testing Market Analysis 20.13.1. By Products 20.13.2. By Distribution Channel 20.14. South Korea Respiratory Pathogen Testing Market Analysis 20.14.1. By Products 20.14.2. By Distribution Channel 20.15. India Respiratory Pathogen Testing Market Analysis 20.15.1. By Products 20.15.2. By Distribution Channel 20.16. ASEAN Respiratory Pathogen Testing Market Analysis 20.16.1. By Products 20.16.2. By Distribution Channel 20.17. Australia Respiratory Pathogen Testing Market Analysis 20.17.1. By Products 20.17.2. By Distribution Channel 20.18. New Zealand Respiratory Pathogen Testing Market Analysis 20.18.1. By Products 20.18.2. By Distribution Channel 20.19. GCC Countries Respiratory Pathogen Testing Market Analysis 20.19.1. By Products 20.19.2. By Distribution Channel 20.20. Turkey Respiratory Pathogen Testing Market Analysis 20.20.1. By Products 20.20.2. By Distribution Channel 20.21. Northern Africa Respiratory Pathogen Testing Market Analysis 20.21.1. By Products 20.21.2. By Distribution Channel 20.22. South Africa Respiratory Pathogen Testing Market Analysis 20.22.1. By Products 20.22.2. By Distribution Channel 21. Market Structure Analysis 21.1. Market Share Analysis of Top Players 21.1.1. Orthotic Devices, Casts and Splints Market Share Analysis 21.1.2. Casting Supplies & Equipment Market Share Analysis 21.1.3. Splinting Supplies & Equipment Market Share Analysis 21.1.4. Orthotics Market Share Analysis 22. Competition Analysis 22.1. Competition Dashboard 22.2. Competition Deep Dive 22.2.1. BSN Medical 22.2.1.1. Overview 22.2.1.2. Product Portfolio 22.2.1.3. Profitability by Market Segments (Product/Channel/Region) 22.2.1.4. Sales Footprint 22.2.1.5. Strategy Overview 22.2.1.5.1. Marketing Strategy 22.2.1.5.2. Product Strategy 22.2.1.5.3. Channel Strategy 22.2.2. De royal Industries, Inc. 22.2.2.1. Overview 22.2.2.2. Product Portfolio 22.2.2.3. Profitability by Market Segments (Product/Channel/Region) 22.2.2.4. Sales Footprint 22.2.2.5. Strategy Overview 22.2.2.5.1. Marketing Strategy 22.2.2.5.2. Product Strategy 22.2.2.5.3. Channel Strategy 22.2.3. Prime Medical 22.2.3.1. Overview 22.2.3.2. Product Portfolio 22.2.3.3. Profitability by Market Segments (Product/Channel/Region) 22.2.3.4. Sales Footprint 22.2.3.5. Strategy Overview 22.2.3.5.1. Marketing Strategy 22.2.3.5.2. Product Strategy 22.2.3.5.3. Channel Strategy 22.2.4. Performance Health Inc. 22.2.4.1. Overview 22.2.4.2. Product Portfolio 22.2.4.3. Profitability by Market Segments (Product/Channel/Region) 22.2.4.4. Sales Footprint 22.2.4.5. Strategy Overview 22.2.4.5.1. Marketing Strategy 22.2.4.5.2. Product Strategy 22.2.4.5.3. Channel Strategy 22.2.5. Össur Hf 22.2.5.1. Overview 22.2.5.2. Product Portfolio 22.2.5.3. Profitability by Market Segments (Product/Channel/Region) 22.2.5.4. Sales Footprint 22.2.5.5. Strategy Overview 22.2.5.5.1. Marketing Strategy 22.2.5.5.2. Product Strategy 22.2.5.5.3. Channel Strategy 22.2.6. DJO, LLC 22.2.6.1. Overview 22.2.6.2. Product Portfolio 22.2.6.3. Profitability by Market Segments (Product/Channel/Region) 22.2.6.4. Sales Footprint 22.2.6.5. Strategy Overview 22.2.6.5.1. Marketing Strategy 22.2.6.5.2. Product Strategy 22.2.6.5.3. Channel Strategy 22.2.7. Zimmer Biomet Holdings, Inc. 22.2.7.1. Overview 22.2.7.2. Product Portfolio 22.2.7.3. Profitability by Market Segments (Product/Channel/Region) 22.2.7.4. Sales Footprint 22.2.7.5. Strategy Overview 22.2.7.5.1. Marketing Strategy 22.2.7.5.2. Product Strategy 22.2.7.5.3. Channel Strategy 22.2.8. Stryker Corporation 22.2.8.1. Overview 22.2.8.2. Product Portfolio 22.2.8.3. Profitability by Market Segments (Product/Channel/Region) 22.2.8.4. Sales Footprint 22.2.8.5. Strategy Overview 22.2.8.5.1. Marketing Strategy 22.2.8.5.2. Product Strategy 22.2.8.5.3. Channel Strategy 22.2.9. 3M Healthcare 22.2.9.1. Overview 22.2.9.2. Product Portfolio 22.2.9.3. Profitability by Market Segments (Product/Channel/Region) 22.2.9.4. Sales Footprint 22.2.9.5. Strategy Overview 22.2.9.5.1. Marketing Strategy 22.2.9.5.2. Product Strategy 22.2.9.5.3. Channel Strategy 22.2.10. Ascent Meditech Ltd. 22.2.10.1. Overview 22.2.10.2. Product Portfolio 22.2.10.3. Profitability by Market Segments (Product/Channel/Region) 22.2.10.4. Sales Footprint 22.2.10.5. Strategy Overview 22.2.10.5.1. Marketing Strategy 22.2.10.5.2. Product Strategy 22.2.10.5.3. Channel Strategy 22.2.11. Fillauer LLC 22.2.11.1. Overview 22.2.11.2. Product Portfolio 22.2.11.3. Profitability by Market Segments (Product/Channel/Region) 22.2.11.4. Sales Footprint 22.2.11.5. Strategy Overview 22.2.11.5.1. Marketing Strategy 22.2.11.5.2. Product Strategy 22.2.11.5.3. Channel Strategy 22.2.12. ComfortFit Orthotic Labs, Inc. 22.2.12.1. Overview 22.2.12.2. Product Portfolio 22.2.12.3. Profitability by Market Segments (Product/Channel/Region) 22.2.12.4. Sales Footprint 22.2.12.5. Strategy Overview 22.2.12.5.1. Marketing Strategy 22.2.12.5.2. Product Strategy 22.2.12.5.3. Channel Strategy 22.2.13. Hanger, Inc. 22.2.13.1. Overview 22.2.13.2. Product Portfolio 22.2.13.3. Profitability by Market Segments (Product/Channel/Region) 22.2.13.4. Sales Footprint 22.2.13.5. Strategy Overview 22.2.13.5.1. Marketing Strategy 22.2.13.5.2. Product Strategy 22.2.13.5.3. Channel Strategy 22.2.14. Amfit Inc. 22.2.14.1. Overview 22.2.14.2. Product Portfolio 22.2.14.3. Profitability by Market Segments (Product/Channel/Region) 22.2.14.4. Sales Footprint 22.2.14.5. Strategy Overview 22.2.14.5.1. Marketing Strategy 22.2.14.5.2. Product Strategy 22.2.14.5.3. Channel Strategy 23. Assumptions and Acronyms Used 24. Research Methodology
Let us know your requirement to get
100% FREE customization
List of Tables
Table 01: Global Orthotic Devices, Casts and Splints Market Value (US$ Mn) Analysis 2014–2021 and Forecast 2022–2024, by Product Table 02: Global Orthotic Devices, Casts and Splints Market Volume (Mn Units) Analysis 2014–2021 and Forecast 2022–2024, by Product Table 03: Global Orthotic Devices, Casts and Splints Market Value (US$ Mn) Analysis 2014–2021 and Forecast 2022–2024, by Distribution Channel Table 04: Global Orthotic Devices, Casts and Splints Market Value (US$ Mn) Analysis 2014–2021 and Forecast 2022–2024, by Region Table 05: North America Orthotic Devices, Casts and Splints Market Value (US$ Mn) Analysis 2014–2021 and Forecast 2022–2024, by Country Table 06: North America Orthotic Devices, Casts and Splints Market Value (US$ Mn) Analysis 2014–2021 and Forecast 2022–2024, by Product Table 07: North America Orthotic Devices, Casts and Splints Market Volume (Mn Units) Analysis 2014–2021 and Forecast 2022–2024, by Product Table 08: North America Orthotic Devices, Casts and Splints Market Value (US$ Mn) Analysis 2014–2021 and Forecast 2022–2024, by Distribution Channel Table 09: Latin America Orthotic Devices, Casts and Splints Market Value (US$ Mn) Analysis 2014–2021 and Forecast 2022–2024, by Country Table 10: Latin America Orthotic Devices, Casts and Splints Market Value (US$ Mn) Analysis 2014–2021 and Forecast 2022–2024, by Product Table 11: Latin America Orthotic Devices, Casts and Splints Market Volume (Mn Units) Analysis 2014–2021 and Forecast 2022–2024, by Product Table 12: Latin America Orthotic Devices, Casts and Splints Market Value (US$ Mn) Analysis 2014–2021 and Forecast 2022–2024, by Distribution Channel Table 13: Europe Orthotic Devices, Casts and Splints Market Value (US$ Mn) Analysis 2014–2021 and Forecast 2022–2024, by Country Table 14: Europe Orthotic Devices, Casts and Splints Market Value (US$ Mn) Analysis 2014–2021 and Forecast 2022–2024, by Product Table 15: Europe Orthotic Devices, Casts and Splints Market Volume (Mn Units)Analysis 2014–2021 and Forecast 2022–2024, by Product Table 16: Europe Orthotic Devices, Casts and Splints Market Value (US$ Mn) Analysis 2014–2021 and Forecast 2022–2024, by Distribution Channel Table 17: South Asia Orthotic Devices, Casts and Splints Market Value (US$ Mn) Analysis 2014–2021 and Forecast 2022–2024, by Country Table 18: South Asia Orthotic Devices, Casts and Splints Market Value (US$ Mn) Analysis 2014–2021 and Forecast 2022–2024, by Product Table 19: South Asia Orthotic Devices, Casts and Splints Market Volume (Mn Units) Analysis 2014–2021 and Forecast 2022–2024, by Product Table 20: South Asia Orthotic Devices, Casts and Splints Market Value (US$ Mn) Analysis 2014–2021 and Forecast 2022–2024, by Distribution Channel Table 21: East Asia Orthotic Devices, Casts and Splints Market Value (US$ Mn) Analysis 2014–2021 and Forecast 2022–2024, by Country Table 22: East Asia Orthotic Devices, Casts and Splints Market Value (US$ Mn) Analysis 2014–2021 and Forecast 2022–2024, by Product Table 23: East Asia Orthotic Devices, Casts and Splints Market Volume (Mn Units) Analysis 2014–2021 and Forecast 2022–2024, by Product Table 24: East Asia Orthotic Devices, Casts and Splints Market Value (US$ Mn) Analysis 2014–2021 and Forecast 2022–2024, by Distribution Channel Table 25: Oceania Orthotic Devices, Casts and Splints Market Value (US$ Mn) Analysis 2014–2021 and Forecast 2022–2024, by Country Table 26: Oceania Orthotic Devices, Casts and Splints Market Value (US$ Mn) Analysis 2014–2021 and Forecast 2022–2024, by Product Table 27: Oceania Orthotic Devices, Casts and Splints Market Volume (Mn Units) Analysis 2014–2021 and Forecast 2022–2024, by Product Table 28: Oceania Orthotic Devices, Casts and Splints Market Value (US$ Mn) Analysis 2014–2021 and Forecast 2022–2024, by Distribution Channel Table 29: MEA Orthotic Devices, Casts and Splints Market Value (US$ Mn) Analysis 2014–2021 and Forecast 2022–2024, by Country Table 30: MEA Orthotic Devices, Casts and Splints Market Value (US$ Mn) Analysis 2014–2021 and Forecast 2022–2024, by Product Table 31: MEA Orthotic Devices, Casts and Splints Market Volume (Mn Units) Analysis 2014–2021 and Forecast 2022–2024, by Product Table 32: MEA Orthotic Devices, Casts and Splints Market Value (US$ Mn) Analysis 2014–2021 and Forecast 2022–2024, by Distribution Channel
Find your sweet spots for generating winning opportunities in this market.
Talk to AnalystList of Charts
Figure 01: Global Orthotic Devices, Casts and Splints Market Value Analysis and Forecast 2022 – 2024 (Mn Units) Figure 02: Global Orthotic Devices, Casts and Splints Pricing Analysis (US$) By Region, 2021 (Per Unit) Figure 03: Global Orthotic Devices, Casts and Splints Pricing Analysis (US$) By Region, 2024 (Per Unit) Figure 04: Global Orthotic Devices, Casts and Splints Market Value Analysis and Forecast 2022 – 2024 (US$ Mn) Figure 05: Global Orthotic Devices, Casts and Splints Market Value (US$ Mn), 2014 – 2021 Figure 06: Global Orthotic Devices, Casts and Splints Market Absolute $ Opportunity (US$ Mn), 2021–2024 Figure 07: Global Orthotic Devices, Casts and Splints Market Share Analysis (%) by Product, 2021 & 2024 Figure 08: Global Orthotic Devices, Casts and Splints Market Y-o-Y Growth (%) by Product, 2022–2029 Figure 09: Global Orthotic Devices, Casts and Splints Market Attractiveness Analysis by Product, 2022–2024 Figure 10: Global Orthotic Devices, Casts and Splints Market Share Analysis (%) by Distribution Channel, 2021 & 2024 Figure 11: Global Orthotic Devices, Casts and Splints Market Y-o-Y Growth (%) by Distribution Channel, 2018–2024 Figure 12: Global Orthotic Devices, Casts and Splints Market Attractiveness Analysis by Distribution Channel, 2022–2024 Figure 13: Global Orthotic Devices, Casts and Splints Market Share Analysis (%) by Region, 2021 & 2024 Figure 14: Global Orthotic Devices, Casts and Splints Market Y-o-Y Growth (%) by Region, 2018–2024 Figure 15: Global Orthotic Devices, Casts and Splints Market Attractiveness Analysis by Region on, 2022–2024 Figure 16: North America Casting Supplies & Equipment Pricing Analysis (US$) By Region, 2021 (Per Unit) Figure 17: North America Splinting Supplies & Equipment Pricing Analysis (US$) By Region, 2021 (Per Unit) Figure 18: North America Orthopedic Braces and Supports Pricing Analysis (US$) By Region, 2021 (Per Unit) Figure 19: North America Orthotics Pricing Analysis (US$) By Region, 2021 (Per Unit) Figure 20: North America Orthotic Devices, Casts and Splints Market Value (US$ Mn), 2014 – 2021 Figure 21: North America Orthotic Devices, Casts and Splints Market Value (US$ Mn) Forecast, 2021–2024 Figure 22: North America Orthotic Devices, Casts and Splints Market Attractiveness Analysis by Product, 2022–2024 Figure 23: North America Orthotic Devices, Casts and Splints Market Attractiveness Analysis by Distribution Channel, 2022–2024 Figure 24: North America Orthotic Devices, Casts and Splints Market Attractiveness Analysis by Country, 2022–2024 Figure 25: Latin America Casting Supplies & Equipment Pricing Analysis (US$) By Region, 2021 (Per Unit) Figure 26: Latin America Splinting Supplies & Equipment Pricing Analysis (US$) By Region, 2021 (Per Unit) Figure 27: Latin America Orthopedic Braces and Supports Pricing Analysis (US$) By Region, 2021 (Per Unit) Figure 28: Latin America Orthotics Pricing Analysis (US$) By Region, 2021 (Per Unit) Figure 29: Latin America Orthotic Devices, Casts and Splints Market Value (US$ Mn), 2014 – 2021 Figure 30: Latin America Orthotic Devices, Casts and Splints Market Value (US$ Mn) Forecast, 2021–2024 Figure 31: Latin America Orthotic Devices, Casts and Splints Market Attractiveness Analysis by Product, 2022–2024 Figure 32: Latin America Orthotic Devices, Casts and Splints Market Attractiveness Analysis by Distribution Channel, 2022–2024 Figure 33: Latin America Orthotic Devices, Casts and Splints Market Attractiveness Analysis by Country, 2022–2024 Figure 34: Europe Casting Supplies & Equipment Pricing Analysis (US$) By Region, 2021 (Per Unit) Figure 35: Europe Splinting Supplies & Equipment Pricing Analysis (US$) By Region, 2021 (Per Unit) Figure 36: Europe Orthopedic Braces and Supports Pricing Analysis (US$) By Region, 2021 (Per Unit) Figure 37: Europe Orthotics Pricing Analysis (US$) By Region, 2021 (Per Unit) Figure 38: Europe Orthotic Devices, Casts and Splints Market Value (US$ Mn), 2014 – 2021 Figure 39: Europe Orthotic Devices, Casts and Splints Market Value (US$ Mn) Forecast, 2021–2024 Figure 40: Europe Orthotic Devices, Casts and Splints Market Attractiveness Analysis by Product, 2022–2024 Figure 41: Europe Orthotic Devices, Casts and Splints Market Attractiveness Analysis by Distribution Channel, 2022–2024 Figure 42: Europe Orthotic Devices, Casts and Splints Market Attractiveness Analysis by Country, 2022–2024 Figure 43: South Asia Casting Supplies & Equipment Pricing Analysis (US$) By Region, 2021 (Per Unit) Figure 44: South Asia Splinting Supplies & Equipment Pricing Analysis (US$) By Region, 2021 (Per Unit) Figure 45: South Asia Orthopedic Braces and Supports Pricing Analysis (US$) By Region, 2021 (Per Unit) Figure 46: South Asia Orthotics Pricing Analysis (US$) By Region, 2021 (Per Unit) Figure 47: South Asia Orthotic Devices, Casts and Splints Market Value (US$ Mn), 2014 – 2021 Figure 48: South Asia Orthotic Devices, Casts and Splints Market Value (US$ Mn) Forecast, 2021–2024 Figure 49: South Asia Orthotic Devices, Casts and Splints Market Attractiveness Analysis by Product, 2022–2024 Figure 50: South Asia Orthotic Devices, Casts and Splints Market Attractiveness Analysis by Distribution Channel, 2022–2024 Figure 51: South Asia Orthotic Devices, Casts and Splints Market Attractiveness Analysis by Country, 2022–2024 Figure 52: East Asia Casting Supplies & Equipment Pricing Analysis (US$) By Region, 2021 (Per Unit) Figure 53: East Asia Splinting Supplies & Equipment Pricing Analysis (US$) By Region, 2021 (Per Unit) Figure 54: East Asia Orthopedic Braces and Supports Pricing Analysis (US$) By Region, 2021 (Per Unit) Figure 55: East Asia Orthotics Pricing Analysis (US$) By Region, 2021 (Per Unit) Figure 56: East Asia Orthotic Devices, Casts and Splints Market Value (US$ Mn), 2014 – 2021 Figure 57: East Asia Orthotic Devices, Casts and Splints Market Value (US$ Mn) Forecast, 2021–2024 Figure 58: East Asia Orthotic Devices, Casts and Splints Market Attractiveness Analysis by Product, 2022–2024 Figure 59: East Asia Orthotic Devices, Casts and Splints Market Attractiveness Analysis by Distribution Channel, 2022–2024 Figure 60: East Asia Orthotic Devices, Casts and Splints Market Attractiveness Analysis by Country, 2022–2024 Figure 61: Oceania Casting Supplies & Equipment Pricing Analysis (US$) By Region, 2021 (Per Unit) Figure 62: Oceania Splinting Supplies & Equipment Pricing Analysis (US$) By Region, 2021 (Per Unit) Figure 63: Oceania Orthopedic Braces and Supports Pricing Analysis (US$) By Region, 2021 (Per Unit) Figure 64: Oceania Orthotics Pricing Analysis (US$) By Region, 2021 (Per Unit) Figure 65: Oceania Orthotic Devices, Casts and Splints Market Value (US$ Mn), 2014 – 2021 Figure 66: Oceania Orthotic Devices, Casts and Splints Market Value (US$ Mn) Forecast, 2021–2024 Figure 67: Oceania Orthotic Devices, Casts and Splints Market Attractiveness Analysis by Product, 2022–2024 Figure 68: Oceania Orthotic Devices, Casts and Splints Market Attractiveness Analysis by Distribution Channel, 2022–2024 Figure 69: Oceania Orthotic Devices, Casts and Splints Market Attractiveness Analysis by Country, 2022–2024 Figure 70: MEA Casting Supplies & Equipment Pricing Analysis (US$) By Region, 2021 (Per Unit) Figure 71: MEA Splinting Supplies & Equipment Pricing Analysis (US$) By Region, 2021 (Per Unit) Figure 72: MEA Orthopedic Braces and Supports Pricing Analysis (US$) By Region, 2021 (Per Unit) Figure 73: MEA Orthotics Pricing Analysis (US$) By Region, 2021 (Per Unit) Figure 74: MEA Orthotic Devices, Casts and Splints Market Value (US$ Mn), 2014 – 2021 Figure 75: MEA Orthotic Devices, Casts and Splints Market Value (US$ Mn) Forecast, 2021–2024 Figure 76: MEA Orthotic Devices, Casts and Splints Market Attractiveness Analysis by Product, 2022–2024 Figure 77: MEA Orthotic Devices, Casts and Splints Market Attractiveness Analysis by Distribution Channel, 2022–2024 Figure 78: MEA Orthotic Devices, Casts and Splints Market Attractiveness Analysis by Country, 2022–2024 Figure 79: U.S. Orthotic Devices, Casts and Splints Market Share Analysis (%), by Product, 2021 & 2024 Figure 80: U.S. Orthotic Devices, Casts and Splints Market Share Analysis (%), by Distribution Channel, 2021 & 2024 Figure 81: Canada Orthotic Devices, Casts and Splints Market Share Analysis (%), by Product, 2021 & 2024 Figure 82: Canada Orthotic Devices, Casts and Splints Market Share Analysis (%), by Distribution Channel, 2021 & 2024 Figure 83: Brazil Orthotic Devices, Casts and Splints Market Share Analysis (%), by Product, 2021 & 2024 Figure 84: Brazil Orthotic Devices, Casts and Splints Market Share Analysis (%), by Distribution Channel, 2021 & 2024 Figure 85: Mexico Orthotic Devices, Casts and Splints Market Share Analysis (%), by Product, 2021 & 2024 Figure 86: Mexico Orthotic Devices, Casts and Splints Market Share Analysis (%), by Distribution Channel, 2021 & 2024 Figure 87: Germany Orthotic Devices, Casts and Splints Market Share Analysis (%), by Product, 2021 & 2024 Figure 88: Germany Orthotic Devices, Casts and Splints Market Share Analysis (%), by Distribution Channel, 2021 & 2024 Figure 89: Italy Orthotic Devices, Casts and Splints Market Share Analysis (%), by Product, 2021 & 2024 Figure 90: Italy Orthotic Devices, Casts and Splints Market Share Analysis (%), by Distribution Channel, 2021 & 2024 Figure 91: France Orthotic Devices, Casts and Splints Market Share Analysis (%), by Product, 2021 & 2024 Figure 92: France Orthotic Devices, Casts and Splints Market Share Analysis (%), by Distribution Channel, 2021 & 2024 Figure 93: U.K. Orthotic Devices, Casts and Splints Market Share Analysis (%), by Product, 2021 & 2024 Figure 94: U.K. Orthotic Devices, Casts and Splints Market Share Analysis (%), by Distribution Channel, 2021 & 2024 Figure 95: Spain Orthotic Devices, Casts and Splints Market Share Analysis (%), by Product, 2021 & 2024 Figure 96: Spain Orthotic Devices, Casts and Splints Market Share Analysis (%), by Distribution Channel, 2021 & 2024 Figure 97: BENELUX Orthotic Devices, Casts and Splints Market Share Analysis (%), by Product, 2021 & 2024 Figure 98: BENELUX Orthotic Devices, Casts and Splints Market Share Analysis (%), by Distribution Channel, 2021 & 2024 Figure 99: Russia Orthotic Devices, Casts and Splints Market Share Analysis (%), by Product, 2021 & 2024 Figure 100: Russia Orthotic Devices, Casts and Splints Market Share Analysis (%), by Distribution Channel, 2021 & 2024 Figure 101: India Orthotic Devices, Casts and Splints Market Share Analysis (%), by Product, 2021 & 2024 Figure 102: India Orthotic Devices, Casts and Splints Market Share Analysis (%), by Distribution Channel, 2021 & 2024 Figure 103: Malaysia Orthotic Devices, Casts and Splints Market Share Analysis (%), by Product, 2021 & 2024 Figure 104: Malaysia Orthotic Devices, Casts and Splints Market Share Analysis (%), by Distribution Channel, 2021 & 2024 Figure 105: Thailand Orthotic Devices, Casts and Splints Market Share Analysis (%), by Product, 2021 & 2024 Figure 106: Thailand Orthotic Devices, Casts and Splints Market Share Analysis (%), by Distribution Channel, 2021 & 2024 Figure 107: Indonesia Orthotic Devices, Casts and Splints Market Share Analysis (%), by Product, 2021 & 2024 Figure 108: Indonesia Orthotic Devices, Casts and Splints Market Share Analysis (%), by Distribution Channel, 2021 & 2024 Figure 109: China Orthotic Devices, Casts and Splints Market Share Analysis (%), by Product, 2021 & 2024 Figure 110: China Orthotic Devices, Casts and Splints Market Share Analysis (%), by Distribution Channel, 2021 & 2024 Figure 111: Japan Orthotic Devices, Casts and Splints Market Share Analysis (%), by Product, 2021 & 2024 Figure 112: Japan Orthotic Devices, Casts and Splints Market Share Analysis (%), by Distribution Channel, 2021 & 2024 Figure 113: Australia Orthotic Devices, Casts and Splints Market Share Analysis (%), by Product, 2021 & 2024 Figure 114: Australia Orthotic Devices, Casts and Splints Market Share Analysis (%), by Distribution Channel, 2021 & 2024 Figure 115: New Zealand Orthotic Devices, Casts and Splints Market Share Analysis (%), by Product, 2021 & 2024 Figure 116: New Zealand Orthotic Devices, Casts and Splints Market Share Analysis (%), by Distribution Channel, 2021 & 2024 Figure 117: GCC Countries Orthotic Devices, Casts and Splints Market Share Analysis (%), by Product, 2021 & 2024 Figure 118: GCC Countries Orthotic Devices, Casts and Splints Market Share Analysis (%), by Distribution Channel, 2021 & 2024 Figure 119: Turkey Orthotic Devices, Casts and Splints Market Share Analysis (%), by Product, 2021 & 2024 Figure 120: Turkey Orthotic Devices, Casts and Splints Market Share Analysis (%), by Distribution Channel, 2021 & 2024 Figure 121: Northern Africa Orthotic Devices, Casts and Splints Market Share Analysis (%), by Product, 2021 & 2024 Figure 122: Northern Africa Orthotic Devices, Casts and Splints Market Share Analysis (%), by Distribution Channel, 2021 & 2024 Figure 123: South Africa Orthotic Devices, Casts and Splints Market Share Analysis (%), by Product, 2021 & 2024 Figure 124: South Africa Orthotic Devices, Casts and Splints Market Share Analysis (%), by Distribution Channel, 2021 & 2024
Need specific information?
Request CustomizationExplore Healthcare Insights
View Reports