Reports

- Global Locations -

Headquarters

Future Market Insights, Inc.

Christiana Corporate, 200
Continental Drive, Suite 401,
Newark, Delaware - 19713,
United States

T: +1-845-579-5705

Americas

Future Market Insights, Inc.

616 Corporate Way, Suite 2-9018,
Valley Cottage, NY 10989, United States

T: +1-347-918-3531

MEA

Future Market Insights

1602-6 Jumeirah Bay X2 Tower, Plot No: JLT-PH2-X2A,
Jumeirah Lakes Towers, Dubai,
United Arab Emirates

Europe

Future Market Insights

3rd Floor, 207 Regent Street,
W1B 3HH London
United Kingdom

T: + 44 (0) 20 8123 9659
D: +44 (0) 20 3287 4268

Asia Pacific

Future Market Insights

IndiaLand Global Tech Park, Unit UG-1, Behind Grand HighStreet, Phase 1, Hinjawadi, MH, Pune – 411057, India

Motion Preservation Devices Market Outlook (2022-2032)

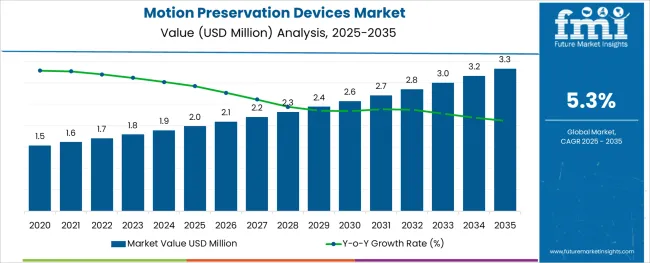
[342 Pages Report] The global motion preservation devices market is forecasted to be valued at US$ 3.0 million by 2032, up from US$ 1.7 million in 2022, advancing at a CAGR of 5.3% during the forecast period.

Report Attribute Details
Motion Preservation Devices Market Value (2022) US$ 1.7 Million
Motion Preservation Devices Market Anticipated Value (2032) US$ 3.0 Million
Motion Preservation Devices Projected Growth Rate (2022-2032) 5.3%

Motion preservation devices are used for treating disorders related to the spine, which maintain alignment and restore the spine motions.

The demand for motion preservation devices is increasing as they maintain normal or near-normal motion to prevent adverse outcomes seen in spinal fusion.

Moreover, motion preservation devices are minimally invasive in nature, and it preserves or re-establishes normal motion of the spine. Pinal disorders are most common in the geriatric population, and due to aging, there are structural changes in the spine, which is creating traction for the adoption of motion preservation devices and fueling the market growth for motion preservation devices.

The market growth can be attributed to factors such as the increasing number of arthroplasty procedures along with the rising incidence of trauma resulting in joint fracture. It is anticipated that the motion preservation devices market is likely to witness a significant growth during the forecast period.

Don't pay for what you don't need

Customize your report by selecting specific countries or regions and save 30%!

What are the Demand Drivers for the Motion Preservation Devices Market?

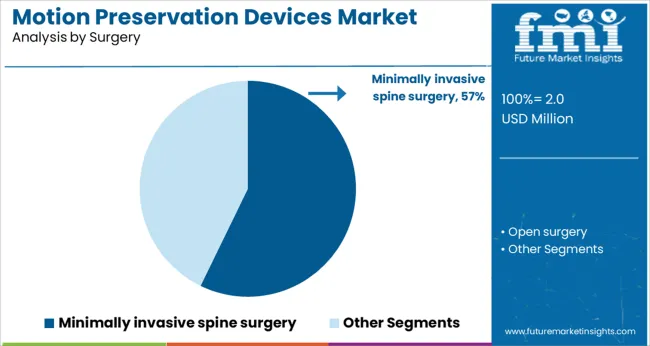
The preference for minimally invasive spine surgery over traditional open surge treatment procedures is driving the demand for motion Preservation devices globally.

Moreover, there is a very low cost involved in minimally invasive surgical procedures as compared to the previous traditional means of surgeries. There is also a rise in the geriatric population, which is fueling the growth of the global motion Preservation devices market.

In addition to that, an increase in technological advancement and development in bone graft products will boost the overall market for motion preservation devices. Due to the increase in popularity, other motion preservation products will have a significant portion of the motion preservation devices market.

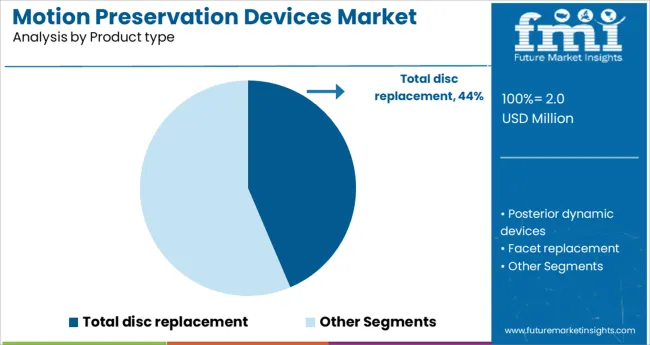
It is projected that artificial disc replacement devices dominate the market due to the adoption of the same, and motion Preservation surgeries help in restoring motion that is leading to increased adoption of surgical procedures.

Furthermore, the main purpose of motion preservation devices is to provide better treatment than spine fusion with pain for the patient and loss of function caused in spines such as lumbar spinal stenosis, degenerative disc disease, and facet pain, therefore, the motion preservation devices market is gaining traction globally.

On the other hand, incidences of diseases such as spinal disorders & neurological disorders and advancements in surgical techniques create new opportunities in the coming years.

What are the Driving Challenges in the Motion Preservation Devices Market?

It is anticipated that the motion Preservation devices involve expensive implants and the high procedure cost associated with the plantation is likely to restrain the growth of the motion preservation devices market.

Furthermore, there are stringent regulatory approvals and unfavorable reimbursement scenarios, which is likely to inhibit the growth of the motion preservation devices market.

Sabyasachi Ghosh
Sabyasachi Ghosh

Principal Consultant

Talk to Analyst

Find your sweet spots for generating winning opportunities in this market.

Regional Analysis

How is the Performance of the North America Motion Preservation Devices Market?

At present, the North American region is accountable for 33.1% of the total motion preservation devices market share.
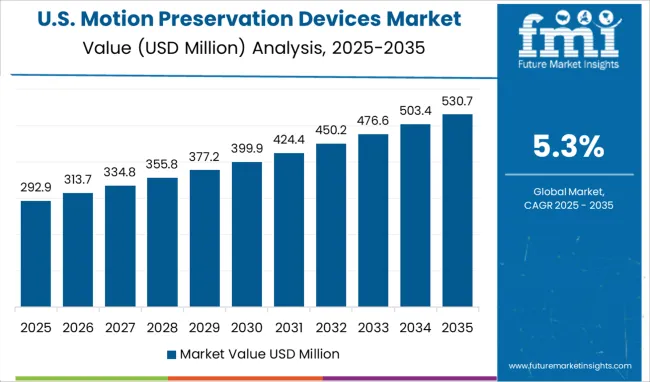
Due to the adoption of several motion preservation techniques and the usage of cervical artificial disc replacement which allows for decompression of the spinal cord and nerve roots and maintains natural movement in the neck that is usually indicated for patients with stenosis and disc herniation, the market demand is being driven in North America.

Additionally, lumbar artificial disc replacement in this region for spine disorder patients is allowing the decomposition of the nerve roots and spinal canal and is maintaining the natural movement of the back for the geriatric population, fuelling the market size of motion Preservation devices.

What is the Growth Outlook for the Europe Motion Preservation Devices Market?

Europe is currently accountable for a 29.1% share of the total motion Preservation devices market.
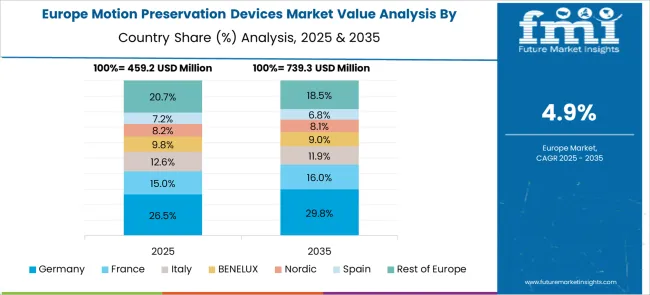
In this region, there is an increase in preference for motion Preservation devices. This is due to the presence of major companies and vendors that have focused on product development to serve dual procedures and mitigation of the disability rate caused by spinal injuries.

Start-up Ecosystem

How are New Entrants Revolutionizing the Motion Preservation Devices Market?
The start-up ecosystem in the motion Preservation devices market is intense with frequent innovations being made. Start-ups in the motion Preservation devices market are focusing on improvising the devices for better implementation in surgical procedures.

ZygoFix develops a miniature implant that achieves spinal fusion and stability without screws. The medical device is called zLOCK and its unique design allows it to adjust to the joint’s natural geometry and provide stabilization. The zLOCK is made from rigid titanium with a porous texture and the minimal invasiveness required to place the implant is yet another essential benefit. Some of the other start-ups include TracInnovations, ABLE, and other.

Get the data you need at a Fraction of the cost

Personalize your report by choosing insights you need
and save 40%!

Competitive Landscape

Who are some of the Key Market Players in the Motion Preservation Devices Market?

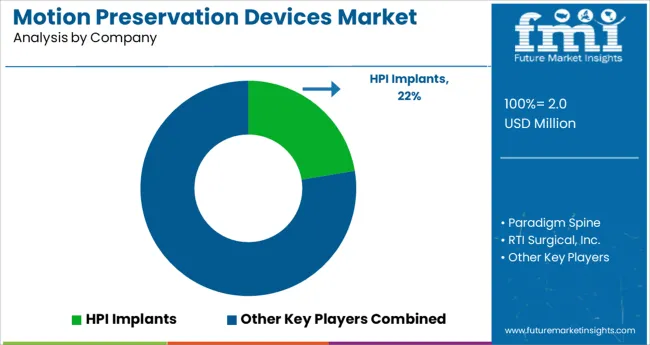
Some of the key players in the Motion Preservation Devices Market are HPI Implants, Paradigm Spine, RTI Surgical, Inc., B. Braun Melsungen AG, Depuy Synthes, Globus Medical, Inc, Spinal Kinetics, Zimmer Biomet Holdings, Inc., Ulrich GmbH & Co. KG.

The key market players have adopted product development strategies such as approvals, product launches, and clinical trials. Constant efforts are being made in improvising the techniques of surgical procedures.

Report Scope

Report Attribute Details
Growth Rate CAGR of 5.3% from 2022 to 2032
Base Year for Estimation 2021
Historical Data 2016-2021
Forecast Period 2022-2032
Quantitative Units Revenue in USD million and CAGR from 2022-2032
Report Coverage Revenue Forecast, Volume Forecast, Company Ranking, Competitive Landscape, Growth Factors, Trends and Pricing Analysis
Segments Covered
  • Type
  • Design
  • Region
Regions Covered
  • North America
  • Latin America
  • Europe
  • East Asia
  • South Asia
  • Oceania
  • Middle East and Africa
Key Countries Profiled
  • USA
  • Canada
  • Brazil
  • Argentina
  • Germany
  • UK
  • France
  • Spain
  • Italy
  • Nordics
  • BENELUX
  • Australia & New Zealand
  • China
  • India
  • ASEAN
  • GCC
  • South Africa
Key Companies Profiled
  • HPI Implants
  • Paradigm Spine
  • RTI Surgical, Inc.
  • B. Braun Melsungen AG
  • Depuy Synthes
  • Globus Medical, Inc
  • Spinal Kinetics
  • Zimmer Biomet Holdings, Inc.
  • Ulrich GmbH & Co. KG.
Customization Available Upon Request

Key Segments

By Type:

  • Total Disc Replacement
  • Posteriors Dynamic Devices
  • Facet Replacement
  • Prosthetic Nucleus Replacement

By Design:

  • Portable Devices
  • Fixed Devices

By Region:

  • North America
  • Latin America
  • Asia Pacific
  • Europe
  • MEA

Frequently Asked Questions

What is the Growth Outlook for the Motion Preservation Devices Market?

The growth outlook for the motion preservation devices market is predicted to advance at a CAGR of 5.3% from 2022-to 2032.

Which Region Leads the Motion Preservation Devices Market?

The North American region is anticipated to lead the motion preservation devices market during the forecast period.

How much Growth Potential does the Motion Preservation Devices Market hold?

The motion preservation devices market is likely to hold a valuation of US$ 2439.0 million by 2032.

Which sector is the key driver in the Motion Preservation Devices Market?

The hospital & healthcare industry sector is the key driver in the motion preservation devices market.

Table of Content

1. Executive Summary

    1.1. Global Market Outlook

    1.2. Demand-side Trends

    1.3. Supply-side Trends

    1.4. Technology Roadmap Analysis

    1.5. Analysis and Recommendations

2. Market Overview

    2.1. Market Coverage / Taxonomy

    2.2. Market Definition / Scope / Limitations

3. Market Background

    3.1. Market Dynamics

        3.1.1. Drivers

        3.1.2. Restraints

        3.1.3. Opportunity

        3.1.4. Trends

    3.2. Scenario Forecast

        3.2.1. Demand in Optimistic Scenario

        3.2.2. Demand in Likely Scenario

        3.2.3. Demand in Conservative Scenario

    3.3. Opportunity Map Analysis

    3.4. Investment Feasibility Matrix

    3.5. PESTLE and Porter’s Analysis

    3.6. Regulatory Landscape

        3.6.1. By Key Regions

        3.6.2. By Key Countries

    3.7. Regional Parent Market Outlook

4. Global Market Analysis 2017-2021 and Forecast, 2022-2032

    4.1. Historical Market Size Value (US$ Mn) & Volume (Units) Analysis, 2017-2021

    4.2. Current and Future Market Size Value (US$ Mn) & Volume (Units) Projections, 2022-2032

        4.2.1. Y-o-Y Growth Trend Analysis

        4.2.2. Absolute $ Opportunity Analysis

5. Global Market Analysis 2017-2021 and Forecast 2022-2032, By Product type

    5.1. Introduction / Key Findings

    5.2. Historical Market Size Value (US$ Mn) & Volume (Units) Analysis By Product type, 2017-2021

    5.3. Current and Future Market Size Value (US$ Mn) & Volume (Units) Analysis and Forecast By Product type, 2022-2032

        5.3.1. Total disc replacement

        5.3.2. Posterior dynamic devices

        5.3.3. Facet replacement

        5.3.4. Prosthetic nucleus replacement

    5.4. Y-o-Y Growth Trend Analysis By Product type, 2017-2021

    5.5. Absolute $ Opportunity Analysis By Product type, 2022-2032

6. Global Market Analysis 2017-2021 and Forecast 2022-2032, By Surgery

    6.1. Introduction / Key Findings

    6.2. Historical Market Size Value (US$ Mn) & Volume (Units) Analysis By Surgery, 2017-2021

    6.3. Current and Future Market Size Value (US$ Mn) & Volume (Units) Analysis and Forecast By Surgery, 2022-2032

        6.3.1. Minimally invasive spine surgery

        6.3.2. Open surgery

    6.4. Y-o-Y Growth Trend Analysis By Surgery, 2017-2021

    6.5. Absolute $ Opportunity Analysis By Surgery, 2022-2032

7. Global Market Analysis 2017-2021 and Forecast 2022-2032, By End user

    7.1. Introduction / Key Findings

    7.2. Historical Market Size Value (US$ Mn) & Volume (Units) Analysis By End user, 2017-2021

    7.3. Current and Future Market Size Value (US$ Mn) & Volume (Units) Analysis and Forecast By End user, 2022-2032

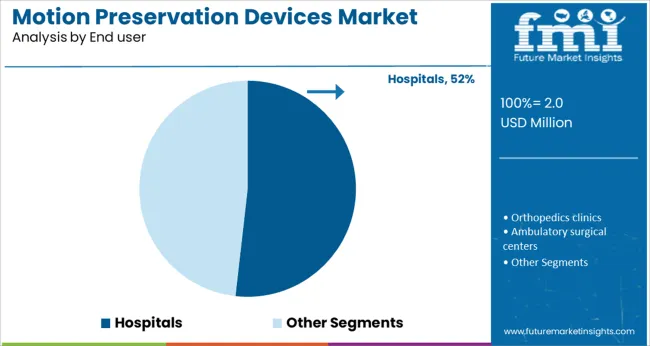
        7.3.1. Hospitals

        7.3.2. Orthopedics clinics

        7.3.3. Ambulatory surgical centers

        7.3.4. Specialty clinics

    7.4. Y-o-Y Growth Trend Analysis By End user, 2017-2021

    7.5. Absolute $ Opportunity Analysis By End user, 2022-2032

8. Global Market Analysis 2017-2021 and Forecast 2022-2032, By Region

    8.1. Introduction

    8.2. Historical Market Size Value (US$ Mn) & Volume (Units) Analysis By Region, 2017-2021

    8.3. Current Market Size Value (US$ Mn) & Volume (Units) Analysis and Forecast By Region, 2022-2032

        8.3.1. North America

        8.3.2. Latin America

        8.3.3. Europe

        8.3.4. Asia Pacific

        8.3.5. MEA

    8.4. Market Attractiveness Analysis By Region

9. North America Market Analysis 2017-2021 and Forecast 2022-2032, By Country

    9.1. Historical Market Size Value (US$ Mn) & Volume (Units) Trend Analysis By Market Taxonomy, 2017-2021

    9.2. Market Size Value (US$ Mn) & Volume (Units) Forecast By Market Taxonomy, 2022-2032

        9.2.1. By Country

            9.2.1.1. U.S.

            9.2.1.2. Canada

        9.2.2. By Product type

        9.2.3. By Surgery

        9.2.4. By End user

    9.3. Market Attractiveness Analysis

        9.3.1. By Country

        9.3.2. By Product type

        9.3.3. By Surgery

        9.3.4. By End user

    9.4. Key Takeaways

10. Latin America Market Analysis 2017-2021 and Forecast 2022-2032, By Country

    10.1. Historical Market Size Value (US$ Mn) & Volume (Units) Trend Analysis By Market Taxonomy, 2017-2021

    10.2. Market Size Value (US$ Mn) & Volume (Units) Forecast By Market Taxonomy, 2022-2032

        10.2.1. By Country

            10.2.1.1. Brazil

            10.2.1.2. Mexico

            10.2.1.3. Rest of Latin America

        10.2.2. By Product type

        10.2.3. By Surgery

        10.2.4. By End user

    10.3. Market Attractiveness Analysis

        10.3.1. By Country

        10.3.2. By Product type

        10.3.3. By Surgery

        10.3.4. By End user

    10.4. Key Takeaways

11. Europe Market Analysis 2017-2021 and Forecast 2022-2032, By Country

    11.1. Historical Market Size Value (US$ Mn) & Volume (Units) Trend Analysis By Market Taxonomy, 2017-2021

    11.2. Market Size Value (US$ Mn) & Volume (Units) Forecast By Market Taxonomy, 2022-2032

        11.2.1. By Country

            11.2.1.1. Germany

            11.2.1.2. U.K.

            11.2.1.3. France

            11.2.1.4. Spain

            11.2.1.5. Italy

            11.2.1.6. Rest of Europe

        11.2.2. By Product type

        11.2.3. By Surgery

        11.2.4. By End user

    11.3. Market Attractiveness Analysis

        11.3.1. By Country

        11.3.2. By Product type

        11.3.3. By Surgery

        11.3.4. By End user

    11.4. Key Takeaways

12. Asia Pacific Market Analysis 2017-2021 and Forecast 2022-2032, By Country

    12.1. Historical Market Size Value (US$ Mn) & Volume (Units) Trend Analysis By Market Taxonomy, 2017-2021

    12.2. Market Size Value (US$ Mn) & Volume (Units) Forecast By Market Taxonomy, 2022-2032

        12.2.1. By Country

            12.2.1.1. China

            12.2.1.2. Japan

            12.2.1.3. South Korea

            12.2.1.4. Malaysia

            12.2.1.5. Singapore

            12.2.1.6. Australia

            12.2.1.7. Rest of Asia Pacific

        12.2.2. By Product type

        12.2.3. By Surgery

        12.2.4. By End user

    12.3. Market Attractiveness Analysis

        12.3.1. By Country

        12.3.2. By Product type

        12.3.3. By Surgery

        12.3.4. By End user

    12.4. Key Takeaways

13. MEA Market Analysis 2017-2021 and Forecast 2022-2032, By Country

    13.1. Historical Market Size Value (US$ Mn) & Volume (Units) Trend Analysis By Market Taxonomy, 2017-2021

    13.2. Market Size Value (US$ Mn) & Volume (Units) Forecast By Market Taxonomy, 2022-2032

        13.2.1. By Country

            13.2.1.1. GCC Countries

            13.2.1.2. South Africa

            13.2.1.3. Israel

            13.2.1.4. Rest of MEA

        13.2.2. By Product type

        13.2.3. By Surgery

        13.2.4. By End user

    13.3. Market Attractiveness Analysis

        13.3.1. By Country

        13.3.2. By Product type

        13.3.3. By Surgery

        13.3.4. By End user

    13.4. Key Takeaways

14. Key Countries Market Analysis

    14.1. U.K.

        14.1.1. Pricing Analysis

        14.1.2. Market Share Analysis, 2021

            14.1.2.1. By Product type

            14.1.2.2. By Surgery

            14.1.2.3. By End user

    14.2. Canada

        14.2.1. Pricing Analysis

        14.2.2. Market Share Analysis, 2021

            14.2.2.1. By Product type

            14.2.2.2. By Surgery

            14.2.2.3. By End user

    14.3. Brazil

        14.3.1. Pricing Analysis

        14.3.2. Market Share Analysis, 2021

            14.3.2.1. By Product type

            14.3.2.2. By Surgery

            14.3.2.3. By End user

    14.4. Mexico

        14.4.1. Pricing Analysis

        14.4.2. Market Share Analysis, 2021

            14.4.2.1. By Product type

            14.4.2.2. By Surgery

            14.4.2.3. By End user

    14.5. Rest of Latin America

        14.5.1. Pricing Analysis

        14.5.2. Market Share Analysis, 2021

            14.5.2.1. By Product type

            14.5.2.2. By Surgery

            14.5.2.3. By End user

    14.6. Germany

        14.6.1. Pricing Analysis

        14.6.2. Market Share Analysis, 2021

            14.6.2.1. By Product type

            14.6.2.2. By Surgery

            14.6.2.3. By End user

    14.7. U.K.

        14.7.1. Pricing Analysis

        14.7.2. Market Share Analysis, 2021

            14.7.2.1. By Product type

            14.7.2.2. By Surgery

            14.7.2.3. By End user

    14.8. France

        14.8.1. Pricing Analysis

        14.8.2. Market Share Analysis, 2021

            14.8.2.1. By Product type

            14.8.2.2. By Surgery

            14.8.2.3. By End user

    14.9. Spain

        14.9.1. Pricing Analysis

        14.9.2. Market Share Analysis, 2021

            14.9.2.1. By Product type

            14.9.2.2. By Surgery

            14.9.2.3. By End user

    14.10. Italy

        14.10.1. Pricing Analysis

        14.10.2. Market Share Analysis, 2021

            14.10.2.1. By Product type

            14.10.2.2. By Surgery

            14.10.2.3. By End user

    14.11. Rest of Europe

        14.11.1. Pricing Analysis

        14.11.2. Market Share Analysis, 2021

            14.11.2.1. By Product type

            14.11.2.2. By Surgery

            14.11.2.3. By End user

    14.12. China

        14.12.1. Pricing Analysis

        14.12.2. Market Share Analysis, 2021

            14.12.2.1. By Product type

            14.12.2.2. By Surgery

            14.12.2.3. By End user

    14.13. Japan

        14.13.1. Pricing Analysis

        14.13.2. Market Share Analysis, 2021

            14.13.2.1. By Product type

            14.13.2.2. By Surgery

            14.13.2.3. By End user

    14.14. South Korea

        14.14.1. Pricing Analysis

        14.14.2. Market Share Analysis, 2021

            14.14.2.1. By Product type

            14.14.2.2. By Surgery

            14.14.2.3. By End user

    14.15. Malaysia

        14.15.1. Pricing Analysis

        14.15.2. Market Share Analysis, 2021

            14.15.2.1. By Product type

            14.15.2.2. By Surgery

            14.15.2.3. By End user

    14.16. Singapore

        14.16.1. Pricing Analysis

        14.16.2. Market Share Analysis, 2021

            14.16.2.1. By Product type

            14.16.2.2. By Surgery

            14.16.2.3. By End user

    14.17. Australia

        14.17.1. Pricing Analysis

        14.17.2. Market Share Analysis, 2021

            14.17.2.1. By Product type

            14.17.2.2. By Surgery

            14.17.2.3. By End user

    14.18. Rest of Asia Pacific

        14.18.1. Pricing Analysis

        14.18.2. Market Share Analysis, 2021

            14.18.2.1. By Product type

            14.18.2.2. By Surgery

            14.18.2.3. By End user

    14.19. GCC Countries

        14.19.1. Pricing Analysis

        14.19.2. Market Share Analysis, 2021

            14.19.2.1. By Product type

            14.19.2.2. By Surgery

            14.19.2.3. By End user

    14.20. South Africa

        14.20.1. Pricing Analysis

        14.20.2. Market Share Analysis, 2021

            14.20.2.1. By Product type

            14.20.2.2. By Surgery

            14.20.2.3. By End user

    14.21. Israel

        14.21.1. Pricing Analysis

        14.21.2. Market Share Analysis, 2021

            14.21.2.1. By Product type

            14.21.2.2. By Surgery

            14.21.2.3. By End user

    14.22. Rest of MEA

        14.22.1. Pricing Analysis

        14.22.2. Market Share Analysis, 2021

            14.22.2.1. By Product type

            14.22.2.2. By Surgery

            14.22.2.3. By End user

15. Market Structure Analysis

    15.1. Competition Dashboard

    15.2. Competition Benchmarking

    15.3. Market Share Analysis of Top Players

        15.3.1. By Regional

        15.3.2. By Product type

        15.3.3. By Surgery

        15.3.4. By End user

16. Competition Analysis

    16.1. Competition Deep Dive

        16.1.1. HPI Implants

            16.1.1.1. Overview

            16.1.1.2. Product Portfolio

            16.1.1.3. Profitability by Market Segments

            16.1.1.4. Sales Footprint

            16.1.1.5. Strategy Overview

                16.1.1.5.1. Marketing Strategy

        16.1.2. Paradigm Spine

            16.1.2.1. Overview

            16.1.2.2. Product Portfolio

            16.1.2.3. Profitability by Market Segments

            16.1.2.4. Sales Footprint

            16.1.2.5. Strategy Overview

                16.1.2.5.1. Marketing Strategy

        16.1.3. RTI Surgical, Inc.

            16.1.3.1. Overview

            16.1.3.2. Product Portfolio

            16.1.3.3. Profitability by Market Segments

            16.1.3.4. Sales Footprint

            16.1.3.5. Strategy Overview

                16.1.3.5.1. Marketing Strategy

        16.1.4. B. Braun Melsungen AG

            16.1.4.1. Overview

            16.1.4.2. Product Portfolio

            16.1.4.3. Profitability by Market Segments

            16.1.4.4. Sales Footprint

            16.1.4.5. Strategy Overview

                16.1.4.5.1. Marketing Strategy

        16.1.5. Depuy Synthes

            16.1.5.1. Overview

            16.1.5.2. Product Portfolio

            16.1.5.3. Profitability by Market Segments

            16.1.5.4. Sales Footprint

            16.1.5.5. Strategy Overview

                16.1.5.5.1. Marketing Strategy

        16.1.6. Globus Medical, Inc

            16.1.6.1. Overview

            16.1.6.2. Product Portfolio

            16.1.6.3. Profitability by Market Segments

            16.1.6.4. Sales Footprint

            16.1.6.5. Strategy Overview

                16.1.6.5.1. Marketing Strategy

        16.1.7. Spinal Kinetics

            16.1.7.1. Overview

            16.1.7.2. Product Portfolio

            16.1.7.3. Profitability by Market Segments

            16.1.7.4. Sales Footprint

            16.1.7.5. Strategy Overview

                16.1.7.5.1. Marketing Strategy

        16.1.8. Zimmer Biomet Holdings, Inc.

            16.1.8.1. Overview

            16.1.8.2. Product Portfolio

            16.1.8.3. Profitability by Market Segments

            16.1.8.4. Sales Footprint

            16.1.8.5. Strategy Overview

                16.1.8.5.1. Marketing Strategy

        16.1.9. Ulrich GmbH & Co. KG

            16.1.9.1. Overview

            16.1.9.2. Product Portfolio

            16.1.9.3. Profitability by Market Segments

            16.1.9.4. Sales Footprint

            16.1.9.5. Strategy Overview

                16.1.9.5.1. Marketing Strategy

17. Assumptions & Acronyms Used

18. Research Methodology

Don't pay for what you don't need

Customize your report by selecting specific countries or regions and save 30%!

List of Tables

Table 1: Global Market Value (US$ Mn) Forecast by Region, 2017-2032

Table 2: Global Market Volume (Units) Forecast by Region, 2017-2032

Table 3: Global Market Value (US$ Mn) Forecast by Product type, 2017-2032

Table 4: Global Market Volume (Units) Forecast by Product type, 2017-2032

Table 5: Global Market Value (US$ Mn) Forecast by Surgery, 2017-2032

Table 6: Global Market Volume (Units) Forecast by Surgery, 2017-2032

Table 7: Global Market Value (US$ Mn) Forecast by End user, 2017-2032

Table 8: Global Market Volume (Units) Forecast by End user, 2017-2032

Table 9: North America Market Value (US$ Mn) Forecast by Country, 2017-2032

Table 10: North America Market Volume (Units) Forecast by Country, 2017-2032

Table 11: North America Market Value (US$ Mn) Forecast by Product type, 2017-2032

Table 12: North America Market Volume (Units) Forecast by Product type, 2017-2032

Table 13: North America Market Value (US$ Mn) Forecast by Surgery, 2017-2032

Table 14: North America Market Volume (Units) Forecast by Surgery, 2017-2032

Table 15: North America Market Value (US$ Mn) Forecast by End user, 2017-2032

Table 16: North America Market Volume (Units) Forecast by End user, 2017-2032

Table 17: Latin America Market Value (US$ Mn) Forecast by Country, 2017-2032

Table 18: Latin America Market Volume (Units) Forecast by Country, 2017-2032

Table 19: Latin America Market Value (US$ Mn) Forecast by Product type, 2017-2032

Table 20: Latin America Market Volume (Units) Forecast by Product type, 2017-2032

Table 21: Latin America Market Value (US$ Mn) Forecast by Surgery, 2017-2032

Table 22: Latin America Market Volume (Units) Forecast by Surgery, 2017-2032

Table 23: Latin America Market Value (US$ Mn) Forecast by End user, 2017-2032

Table 24: Latin America Market Volume (Units) Forecast by End user, 2017-2032

Table 25: Europe Market Value (US$ Mn) Forecast by Country, 2017-2032

Table 26: Europe Market Volume (Units) Forecast by Country, 2017-2032

Table 27: Europe Market Value (US$ Mn) Forecast by Product type, 2017-2032

Table 28: Europe Market Volume (Units) Forecast by Product type, 2017-2032

Table 29: Europe Market Value (US$ Mn) Forecast by Surgery, 2017-2032

Table 30: Europe Market Volume (Units) Forecast by Surgery, 2017-2032

Table 31: Europe Market Value (US$ Mn) Forecast by End user, 2017-2032

Table 32: Europe Market Volume (Units) Forecast by End user, 2017-2032

Table 33: Asia Pacific Market Value (US$ Mn) Forecast by Country, 2017-2032

Table 34: Asia Pacific Market Volume (Units) Forecast by Country, 2017-2032

Table 35: Asia Pacific Market Value (US$ Mn) Forecast by Product type, 2017-2032

Table 36: Asia Pacific Market Volume (Units) Forecast by Product type, 2017-2032

Table 37: Asia Pacific Market Value (US$ Mn) Forecast by Surgery, 2017-2032

Table 38: Asia Pacific Market Volume (Units) Forecast by Surgery, 2017-2032

Table 39: Asia Pacific Market Value (US$ Mn) Forecast by End user, 2017-2032

Table 40: Asia Pacific Market Volume (Units) Forecast by End user, 2017-2032

Table 41: MEA Market Value (US$ Mn) Forecast by Country, 2017-2032

Table 42: MEA Market Volume (Units) Forecast by Country, 2017-2032

Table 43: MEA Market Value (US$ Mn) Forecast by Product type, 2017-2032

Table 44: MEA Market Volume (Units) Forecast by Product type, 2017-2032

Table 45: MEA Market Value (US$ Mn) Forecast by Surgery, 2017-2032

Table 46: MEA Market Volume (Units) Forecast by Surgery, 2017-2032

Table 47: MEA Market Value (US$ Mn) Forecast by End user, 2017-2032

Table 48: MEA Market Volume (Units) Forecast by End user, 2017-2032
Sabyasachi Ghosh
Sabyasachi Ghosh

Principal Consultant

Talk to Analyst

Find your sweet spots for generating winning opportunities in this market.

List of Charts

Figure 1: Global Market Value (US$ Mn) by Product type, 2022-2032

Figure 2: Global Market Value (US$ Mn) by Surgery, 2022-2032

Figure 3: Global Market Value (US$ Mn) by End user, 2022-2032

Figure 4: Global Market Value (US$ Mn) by Region, 2022-2032

Figure 5: Global Market Value (US$ Mn) Analysis by Region, 2017-2032

Figure 6: Global Market Volume (Units) Analysis by Region, 2017-2032

Figure 7: Global Market Value Share (%) and BPS Analysis by Region, 2022-2032

Figure 8: Global Market Y-o-Y Growth (%) Projections by Region, 2022-2032

Figure 9: Global Market Value (US$ Mn) Analysis by Product type, 2017-2032

Figure 10: Global Market Volume (Units) Analysis by Product type, 2017-2032

Figure 11: Global Market Value Share (%) and BPS Analysis by Product type, 2022-2032

Figure 12: Global Market Y-o-Y Growth (%) Projections by Product type, 2022-2032

Figure 13: Global Market Value (US$ Mn) Analysis by Surgery, 2017-2032

Figure 14: Global Market Volume (Units) Analysis by Surgery, 2017-2032

Figure 15: Global Market Value Share (%) and BPS Analysis by Surgery, 2022-2032

Figure 16: Global Market Y-o-Y Growth (%) Projections by Surgery, 2022-2032

Figure 17: Global Market Value (US$ Mn) Analysis by End user, 2017-2032

Figure 18: Global Market Volume (Units) Analysis by End user, 2017-2032

Figure 19: Global Market Value Share (%) and BPS Analysis by End user, 2022-2032

Figure 20: Global Market Y-o-Y Growth (%) Projections by End user, 2022-2032

Figure 21: Global Market Attractiveness by Product type, 2022-2032

Figure 22: Global Market Attractiveness by Surgery, 2022-2032

Figure 23: Global Market Attractiveness by End user, 2022-2032

Figure 24: Global Market Attractiveness by Region, 2022-2032

Figure 25: North America Market Value (US$ Mn) by Product type, 2022-2032

Figure 26: North America Market Value (US$ Mn) by Surgery, 2022-2032

Figure 27: North America Market Value (US$ Mn) by End user, 2022-2032

Figure 28: North America Market Value (US$ Mn) by Country, 2022-2032

Figure 29: North America Market Value (US$ Mn) Analysis by Country, 2017-2032

Figure 30: North America Market Volume (Units) Analysis by Country, 2017-2032

Figure 31: North America Market Value Share (%) and BPS Analysis by Country, 2022-2032

Figure 32: North America Market Y-o-Y Growth (%) Projections by Country, 2022-2032

Figure 33: North America Market Value (US$ Mn) Analysis by Product type, 2017-2032

Figure 34: North America Market Volume (Units) Analysis by Product type, 2017-2032

Figure 35: North America Market Value Share (%) and BPS Analysis by Product type, 2022-2032

Figure 36: North America Market Y-o-Y Growth (%) Projections by Product type, 2022-2032

Figure 37: North America Market Value (US$ Mn) Analysis by Surgery, 2017-2032

Figure 38: North America Market Volume (Units) Analysis by Surgery, 2017-2032

Figure 39: North America Market Value Share (%) and BPS Analysis by Surgery, 2022-2032

Figure 40: North America Market Y-o-Y Growth (%) Projections by Surgery, 2022-2032

Figure 41: North America Market Value (US$ Mn) Analysis by End user, 2017-2032

Figure 42: North America Market Volume (Units) Analysis by End user, 2017-2032

Figure 43: North America Market Value Share (%) and BPS Analysis by End user, 2022-2032

Figure 44: North America Market Y-o-Y Growth (%) Projections by End user, 2022-2032

Figure 45: North America Market Attractiveness by Product type, 2022-2032

Figure 46: North America Market Attractiveness by Surgery, 2022-2032

Figure 47: North America Market Attractiveness by End user, 2022-2032

Figure 48: North America Market Attractiveness by Country, 2022-2032

Figure 49: Latin America Market Value (US$ Mn) by Product type, 2022-2032

Figure 50: Latin America Market Value (US$ Mn) by Surgery, 2022-2032

Figure 51: Latin America Market Value (US$ Mn) by End user, 2022-2032

Figure 52: Latin America Market Value (US$ Mn) by Country, 2022-2032

Figure 53: Latin America Market Value (US$ Mn) Analysis by Country, 2017-2032

Figure 54: Latin America Market Volume (Units) Analysis by Country, 2017-2032

Figure 55: Latin America Market Value Share (%) and BPS Analysis by Country, 2022-2032

Figure 56: Latin America Market Y-o-Y Growth (%) Projections by Country, 2022-2032

Figure 57: Latin America Market Value (US$ Mn) Analysis by Product type, 2017-2032

Figure 58: Latin America Market Volume (Units) Analysis by Product type, 2017-2032

Figure 59: Latin America Market Value Share (%) and BPS Analysis by Product type, 2022-2032

Figure 60: Latin America Market Y-o-Y Growth (%) Projections by Product type, 2022-2032

Figure 61: Latin America Market Value (US$ Mn) Analysis by Surgery, 2017-2032

Figure 62: Latin America Market Volume (Units) Analysis by Surgery, 2017-2032

Figure 63: Latin America Market Value Share (%) and BPS Analysis by Surgery, 2022-2032

Figure 64: Latin America Market Y-o-Y Growth (%) Projections by Surgery, 2022-2032

Figure 65: Latin America Market Value (US$ Mn) Analysis by End user, 2017-2032

Figure 66: Latin America Market Volume (Units) Analysis by End user, 2017-2032

Figure 67: Latin America Market Value Share (%) and BPS Analysis by End user, 2022-2032

Figure 68: Latin America Market Y-o-Y Growth (%) Projections by End user, 2022-2032

Figure 69: Latin America Market Attractiveness by Product type, 2022-2032

Figure 70: Latin America Market Attractiveness by Surgery, 2022-2032

Figure 71: Latin America Market Attractiveness by End user, 2022-2032

Figure 72: Latin America Market Attractiveness by Country, 2022-2032

Figure 73: Europe Market Value (US$ Mn) by Product type, 2022-2032

Figure 74: Europe Market Value (US$ Mn) by Surgery, 2022-2032

Figure 75: Europe Market Value (US$ Mn) by End user, 2022-2032

Figure 76: Europe Market Value (US$ Mn) by Country, 2022-2032

Figure 77: Europe Market Value (US$ Mn) Analysis by Country, 2017-2032

Figure 78: Europe Market Volume (Units) Analysis by Country, 2017-2032

Figure 79: Europe Market Value Share (%) and BPS Analysis by Country, 2022-2032

Figure 80: Europe Market Y-o-Y Growth (%) Projections by Country, 2022-2032

Figure 81: Europe Market Value (US$ Mn) Analysis by Product type, 2017-2032

Figure 82: Europe Market Volume (Units) Analysis by Product type, 2017-2032

Figure 83: Europe Market Value Share (%) and BPS Analysis by Product type, 2022-2032

Figure 84: Europe Market Y-o-Y Growth (%) Projections by Product type, 2022-2032

Figure 85: Europe Market Value (US$ Mn) Analysis by Surgery, 2017-2032

Figure 86: Europe Market Volume (Units) Analysis by Surgery, 2017-2032

Figure 87: Europe Market Value Share (%) and BPS Analysis by Surgery, 2022-2032

Figure 88: Europe Market Y-o-Y Growth (%) Projections by Surgery, 2022-2032

Figure 89: Europe Market Value (US$ Mn) Analysis by End user, 2017-2032

Figure 90: Europe Market Volume (Units) Analysis by End user, 2017-2032

Figure 91: Europe Market Value Share (%) and BPS Analysis by End user, 2022-2032

Figure 92: Europe Market Y-o-Y Growth (%) Projections by End user, 2022-2032

Figure 93: Europe Market Attractiveness by Product type, 2022-2032

Figure 94: Europe Market Attractiveness by Surgery, 2022-2032

Figure 95: Europe Market Attractiveness by End user, 2022-2032

Figure 96: Europe Market Attractiveness by Country, 2022-2032

Figure 97: Asia Pacific Market Value (US$ Mn) by Product type, 2022-2032

Figure 98: Asia Pacific Market Value (US$ Mn) by Surgery, 2022-2032

Figure 99: Asia Pacific Market Value (US$ Mn) by End user, 2022-2032

Figure 100: Asia Pacific Market Value (US$ Mn) by Country, 2022-2032

Figure 101: Asia Pacific Market Value (US$ Mn) Analysis by Country, 2017-2032

Figure 102: Asia Pacific Market Volume (Units) Analysis by Country, 2017-2032

Figure 103: Asia Pacific Market Value Share (%) and BPS Analysis by Country, 2022-2032

Figure 104: Asia Pacific Market Y-o-Y Growth (%) Projections by Country, 2022-2032

Figure 105: Asia Pacific Market Value (US$ Mn) Analysis by Product type, 2017-2032

Figure 106: Asia Pacific Market Volume (Units) Analysis by Product type, 2017-2032

Figure 107: Asia Pacific Market Value Share (%) and BPS Analysis by Product type, 2022-2032

Figure 108: Asia Pacific Market Y-o-Y Growth (%) Projections by Product type, 2022-2032

Figure 109: Asia Pacific Market Value (US$ Mn) Analysis by Surgery, 2017-2032

Figure 110: Asia Pacific Market Volume (Units) Analysis by Surgery, 2017-2032

Figure 111: Asia Pacific Market Value Share (%) and BPS Analysis by Surgery, 2022-2032

Figure 112: Asia Pacific Market Y-o-Y Growth (%) Projections by Surgery, 2022-2032

Figure 113: Asia Pacific Market Value (US$ Mn) Analysis by End user, 2017-2032

Figure 114: Asia Pacific Market Volume (Units) Analysis by End user, 2017-2032

Figure 115: Asia Pacific Market Value Share (%) and BPS Analysis by End user, 2022-2032

Figure 116: Asia Pacific Market Y-o-Y Growth (%) Projections by End user, 2022-2032

Figure 117: Asia Pacific Market Attractiveness by Product type, 2022-2032

Figure 118: Asia Pacific Market Attractiveness by Surgery, 2022-2032

Figure 119: Asia Pacific Market Attractiveness by End user, 2022-2032

Figure 120: Asia Pacific Market Attractiveness by Country, 2022-2032

Figure 121: MEA Market Value (US$ Mn) by Product type, 2022-2032

Figure 122: MEA Market Value (US$ Mn) by Surgery, 2022-2032

Figure 123: MEA Market Value (US$ Mn) by End user, 2022-2032

Figure 124: MEA Market Value (US$ Mn) by Country, 2022-2032

Figure 125: MEA Market Value (US$ Mn) Analysis by Country, 2017-2032

Figure 126: MEA Market Volume (Units) Analysis by Country, 2017-2032

Figure 127: MEA Market Value Share (%) and BPS Analysis by Country, 2022-2032

Figure 128: MEA Market Y-o-Y Growth (%) Projections by Country, 2022-2032

Figure 129: MEA Market Value (US$ Mn) Analysis by Product type, 2017-2032

Figure 130: MEA Market Volume (Units) Analysis by Product type, 2017-2032

Figure 131: MEA Market Value Share (%) and BPS Analysis by Product type, 2022-2032

Figure 132: MEA Market Y-o-Y Growth (%) Projections by Product type, 2022-2032

Figure 133: MEA Market Value (US$ Mn) Analysis by Surgery, 2017-2032

Figure 134: MEA Market Volume (Units) Analysis by Surgery, 2017-2032

Figure 135: MEA Market Value Share (%) and BPS Analysis by Surgery, 2022-2032

Figure 136: MEA Market Y-o-Y Growth (%) Projections by Surgery, 2022-2032

Figure 137: MEA Market Value (US$ Mn) Analysis by End user, 2017-2032

Figure 138: MEA Market Volume (Units) Analysis by End user, 2017-2032

Figure 139: MEA Market Value Share (%) and BPS Analysis by End user, 2022-2032

Figure 140: MEA Market Y-o-Y Growth (%) Projections by End user, 2022-2032

Figure 141: MEA Market Attractiveness by Product type, 2022-2032

Figure 142: MEA Market Attractiveness by Surgery, 2022-2032

Figure 143: MEA Market Attractiveness by End user, 2022-2032

Figure 144: MEA Market Attractiveness by Country, 2022-2032

Recommendations

Healthcare

Motion Stimulation Therapy Market

Published : June 2022

Explore Healthcare Insights

View Reports

Motion Preservation Devices Market